American Journal of Molecular Biology
Vol.4 No.2(2014), Article ID:44450,9 pages
DOI:10.4236/ajmb.2014.42009
Selection of Reference Genes in Equine White Blood Cells for Real Time PCR Normalization Following Extracorporeal Shock Wave Therapy
Zibin Jiang1, Jinwen Chen1, Cornelius E. Uboh1,2, Mary A. Robinson1, Lawrence R. Soma1*
1Department of Clinical Studies, New Bolton Center Campus, University of Pennsylvania School of Veterinary Medicine, Philadelphia, USA
2Pennsylvania Equine Toxicology & Research Center, Department of Chemistry, West Chester University, West Chester, USA
Email: *soma@vet.upenn.edu
Copyright © 2014 by authors and Scientific Research Publishing Inc.
This work is licensed under the Creative Commons Attribution International License (CC BY).
http://creativecommons.org/licenses/by/4.0/


Received 12 February 2014; revised 10 March 2014; accepted 28 March 2014
Selection of proper reference genes (RGs) is an essential step needed for accurate normalization of results from genomic studies. Expression of RGs is regulated by many factors such as species, age, gender, type of tissue, the presence of disease, and the administration of therapeutic treatment. The aim of the present study was to identify optimal RGs in a set of blood samples collected at different time points (0, 24, 48, 72 h) from horses following administration of extracorporeal shock wave therapy (ESWT). The mRNA expression of twelve RGs: HPRT1, ACTB, HSP90A, SDHA, GUSB, B2M, UBC, NONO, TBP, H6PD, RPL32, GAPDH was determined using real time quantitative polymerase chain reaction (qPCR). An SAS program developed on the algorithm of geNorm, SASqPCR, was used to determine stability of the expression and the number of optimal RGs. The results showed that the range of quantification cycle (Cq) values of the evaluated genes varied between 17 and 26 cycles, and that one optimal RG, ACTB, was sufficient for normalization of gene expression. Results of stability of expression demonstrated that ACTB was the optimal choice for all the samples studied. Notably, in samples collected at 72 h post ESWT, TBP showed a significant change in the expression level, and was not suitable for use as a RG. These results substantiate the importance of validating and selecting an appropriate RG.
Keywords:Reference Genes; Real Time PCR; Normalization; Equine; White Blood Cell; Extracorporeal Shock Wave Therapy

Extracorporeal Shock Wave Therapy (ESWT) has been used for treatment of a wide variety of bone and tendon injuries. Shockwaves are high-energy pressure waves that are transmitted to the injured tissue via a probe placed on the surface of the skin overlying the affected area [1] . ESWT triggers repair mechanisms that accelerate healing of orthopedic injuries [2] such as stress fractures [3] , tendon injuries [4] , and stimulation of bone formation in nonunion fractures.
It has been reported that expression levels for some genes, such as ERK and p38 [5] , GF-β1 and IGF-1 [6] , BMP-2 [7] , VEGF [8] , were significantly altered by ESWT in animal models. In equine research, it was reported that ESWT increased Cx43 expression in in-vitro mesenchymal stem cells [9] , suppressed TGF-β1 and increased IGF-1 expression in surgically created wounds [10] . Exposure of normal tendinous tissue to ESWT led to downregulation of MMP3 and up-regulation of COL1 and MMP14 [11] . However, to date, there is no report on the effects of ESWT on the equine white blood cell (WBC) transcript-ome. To investigate the effect of ESWT on this transcriptome, a microarray platform was chosen to determine the transcriptome profile in equine WBC before and after ESWT. For this reason a number of potential candidate genes with significant changes in expression were screened for and validated using real time qPCR.
Quantitative polymerase chain reaction is a very powerful technique for comparing gene expression profiles under different biological conditions. When comparing gene expression profiles before and after treatment, it is critical to consider factors that confound expression levels, such as different quantities and quality of starting material, RNA extraction and reverse transcription efficiencies. Among several normalization approaches proposed [12] , housekeeping genes as RGs are accepted and frequently used to normalize qPCR and thus, reduce possible errors generated during quantification of gene expression. An ideal RG should be expressed in the cells and tissues of interest without alteration by the experimental conditions or by disease status. However, such an ideal universal RG does not exist [13] . Commonly used RGs have variability in the expression levels in different tissues and/or disease states [14] -[17] , emphasizing the importance of evaluation studies for the identification of the most stable RGs in different tissues and/or disease states before undertaking a qPCR study. Currently, there are no studies that have systematically compared the stability of RGs in ESWT-treated equine WBC samples.
In the present study, the expression levels of twelve candidate RGs in equine WBC collected at different times post-ESWT were analyzed using qPCR, and the stability of the expression and the number of optimal RGs were determined. The most stable RG used in the analysis of gene expression in ESWT was identified.
2.1. Ethics Statement
The protocols were approved by the University of Pennsylvania Institutional Animal Care and Use Committee.
2.2. Extracorporeal Shock Wave Therapy and Sample Collection
All horses underwent routine dental and foot care and scheduled administration of appropriate vaccinations and de-worming agents. The horses were no longer actively racing. These horses were pasture fit and not exercised on a routine basis. Based on physical examination and routine blood chemistry analysis, all the horses in the study were in good health. Horses were housed on pasture and brought into temperature controlled stalls 7 days before ESWT. Twelve horses were administered a total of 2700 impulses at an energy density of 0.55 mJ/mm2 to one of the dorsal metacarpal bones using a ESWT unlimited, Duolith SD1 T-Top, Vet, F-SW (STORZ MEDICAL AG, Tägerwilen, Switzerland). Blood samples (10 mL aliquots) were collected in heparinized tubes by venipuncture of the jugular vein before ESWT (0 h) and at 24, 48 and 72 h post ESWT.
2.3. RNA extraction and Transcription
RNA was extracted from fresh blood samples using LeuKoLOCK™ total RNA isolation procedure (Applied Biosystems, Foster City, CA, USA) as previously described [18] . Genomic DNA was eliminated by RNase-free DNase I digestion during the isolation procedure. The quality and quantity of extracted RNA samples were assayed using the Agilent Bioanalyzer system (Agilent Technologies, Inc., Santa Clara, CA, USA). All samples were quantified using a NanoDrop 2000 spectrometer (Thermo Fisher Scientic, Pittsburgh, USA). Complementary DNA (cDNA) was synthesized using hexanucleotide primers and Multiscribe Reverse Transcriptase (Applied Biosystems, Foster City, CA, USA) in a final reaction volume of 20 µL containing 2 µL reverse transcriptase buffer, 5.5 mM MgCl2, 0.5 mM deoxyribonucleoside triphosphate, 2.5 mM random hexamers, 0.4 U RNase inhibitor, 1.25 U Multiscribe Reverse Transcriptase and 200 ng RNA. All reactions were performed under the following conditions: initial primer incubation step was performed for 10 min at 25˚C, followed by reverse transcriptase incubation for 2 h at 37˚C, terminated by reverse transcriptase inactivation for 5 min at 95˚C, and cooled to 4˚C before storage at −80˚C pending analysis.
2.4. Quantitative Real Time PCR
Twelve RGs were selected from commonly used in equine research [8] -[10] and commercially available products (Table 1). All primers were designed with Primer Express 3.0.1 (Applied Biosystems, Foster City, CA, USA) to amplify at 60˚C and to bind specifically to different exons of equine cDNA sequences. The qPCR efficiency ranged from 92% - 99% (Table 2).
Amplification of specific PCR products was detected using SYBR Green PCR Master Mix (Applied Biosystems, Foster City, CA, USA). All primers employed were custom-synthesized by Applied Biosystems, Inc. Amplification efficiency of each primer pair was evaluated by the standard curve method. Gene expression study for all twelve genes was performed in 96-well plates using ABI 7500 real time PCR System (Applied Biosystems, Foster City, CA, USA). PCR step was carried out in 20 μL, including 10 μL 2x SYBR Green PCR Master Mix, 50 nM of each primer and 5 μL cDNA samples. The reaction mixtures were heated at 95˚C for 10 min and then subjected to 40 cycles at 95˚C for 15 sec, and 60˚C for 1 min. Each PCR reaction was performed in triplicate paralleling with no template control.
2.5. Data Analysis
qPCR data were analyzed using SDS Software, and standard curves were fit using linear regression (v 2.0.6; Applied Biosystems, Foster City, CA, USA). Real-time PCR amplification efficiencies were calculated using the
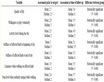
Table 1 . Candidate reference genes.
Table 2. The primer sequences and qPCR efficiencies for the evaluated reference genes.
slope of the standard curve.
All analyses were performed using SAS 9.3 (SAS Institute Inc. Cary, NC, USA). The normality test was performed by the Shapiro-Wilk method combining a graphic method: normal probability plot. Data were presented as mean ± SD. Pair-wise comparisons of gene expression levels among four groups of subjects were performed using one-way ANOVA when expression levels were normally distributed, and a non-parametric (Wilcoxon) test was applied when expression levels were not normally distributed. Bonferroni correction was used to adjust for multiple comparisons. Results were considered statistically significant when p < 0.05.
The stability of the selected RGs and the number of optimal RGs were determined using SASqPCR [19] , a SAS macro-program that was developed according to the algorithm of geNorm [13] .
3.1. Expression Levels of Candidate RGs
For comparison of RGs transcription levels, the quantification cycle (Cq) values were plotted directly, assuming the same threshold for all genes evaluated. Cq is defined as the number of cycles needed for fluorescence to reach a specific threshold of detection and is inversely correlated with the number of RNA template present in the reaction. The twelve RGs analyzed in this study displayed a wide range of expression, with Cq values between 17 and 26 (Figure 1). The normality of Cq values for all the genes evaluated was tested using the ShapiroWilk method combining a graphic method: normal probability plot. Five genes, ACTB, HSP90A, HPRT1, TBP and UBC showed normal distribution in all samples collected at different time points. The remaining seven genes did not show normal distribution in one or more samples.
The twelve RGs were clearly distributed into different categories of expression level. Most genes coded for highly expressed mRNAs with the majority of Cq values between 17 and 22 cycles; five other genes, GUSB, SDHA, H6PD and HPRT1 and TBP, were moderately expressed with Cq values between 23 and 26 cycles. It should be noted that TBP had slightly higher expression levels in the 72 h samples than in the remaining samples (Figure 1).
As suggested by Ohl et al. [16] , pairwise comparisons on raw Cq values among 4 different samples were performed, and there were significant differences in gene expression of TBP between 72 h and the other 3 samples (72 h vs. control. p = 0.0003; 72 vs. 24 h, p = 0.0002; 72 vs. 48 h, p = 0.0004). These results indicated variability in TBP gene expression level by ESWT, even though it had previously been considered a house-keeping gene.
3.2. Identification of the Best Candidate
The main objective of this study was to identify RGs in the white blood cells with minimal variability following treatment of horses with ESWT. In order to determine the least variable RGs, we evaluated expression stability of the twelve candidate RGs in the panel of samples using SASqPCR. Gene expression stability measurement (M) was calculated based on the average pairwise variation between a particular gene and all other genes studied. The suggested cut-off value of M was 1.5 [13] .
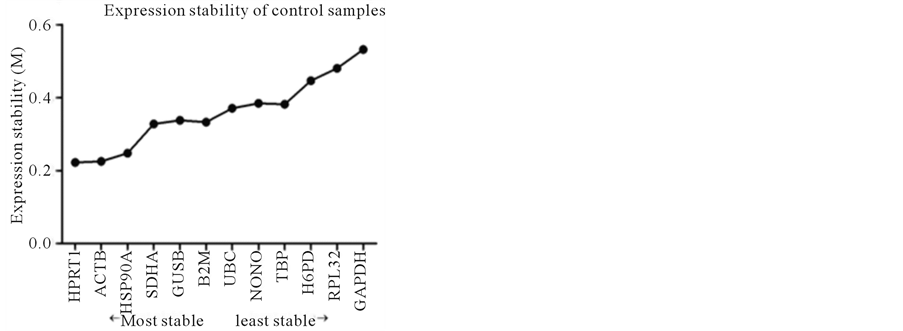
In the control samples, M values for all genes were between 0.2 and 0.6, and the expression stability from the most stable to the least stable was as follows: HPRT1 > ACTB > HSP90A > SDHA > GUSB > B2M > UBC > NONO > TBP > H6PD > RPL32 > GAPDH (Figure 2(a)).
In the 24 h samples, the M values for all genes were also between 0.2 and 0.6, and the order of expression stability from the most stable to the least stable was as follows: ACTB > HSP90A > HPRT1 > TBP > GUSB > H6PD > B2M > NONO > GAPDH > SDHA > UBC > RPL32 (Figure 2(b)).
In the 48 h samples, the M values for all the genes were still between 0.2 and 0.6, the expression stability from the most stable to the least stable was as follows: ACTB > HPRT1 > HSP90A > GUSB > H6PD > SDHA > RPL32 > TBP > NONO > UBC > GAPDH > B2M (Figure 2(c)).
In the 72 h samples, M values for all genes were still between 0.2 and 1.6, showing a much wider range compared to the rest of the samples, the expression stability calculated for the genes analyzed was from the most stable to the least stable: ACTB > HPRT1 > H6PD > NONO > RPL32 > SDHA > GAPDH > HSP90A > GUSB > UBC > B2M > TBP (Figure 2(d)). It should be noted that the M value for TBP was 1.505, which was above the cut-off value of 1.5, suggesting that TBP was not a suitable reference gene in the 72 h samples. This was consistent with the pairwise comparison results.
3.3. Determination of the Optimal Number of RGs for Genes Expression Normalization
To determine the number of stable RGs needed for normalization, a pairwise variation Vn/n+1 (n = number of RGs) was calculated for two sequential normalization factors (NF) NFn and NFn+1 for all samples. A large V value indicates that the added gene had a significant effect and should probably be included for calculation of the normalization factor. In the present study, the relative quantities of all candidate RGs in all samples were used to calculate V. As shown in Figure 3, all the pairwise variations, Vn/n+1, were below the 0.15 cut-off value [13] , an additional RG did not significantly contribute to improving accuracy. Since V1/2 values for all samples were less than 0.15, one most stable RG was sufficient for accurate calibration, and an additional RG was not required as an internal control.
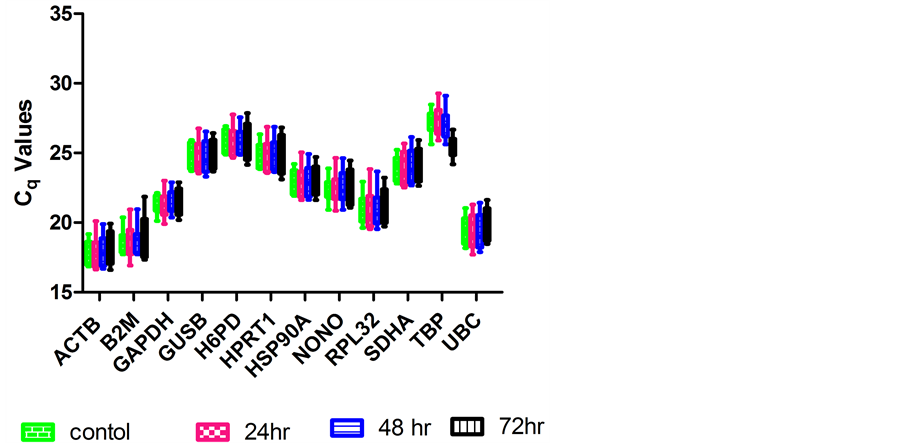
Figure 1. Expression levels of candidate RGs in samples collected at different time points post ESWT. Boxes represent lower and upper quartiles of quantification cycle range with medians indicated, whiskers represent the 10th and 90th percentiles. Graph was plotted using GraphPad Prism 5 software.
 (a)
(a)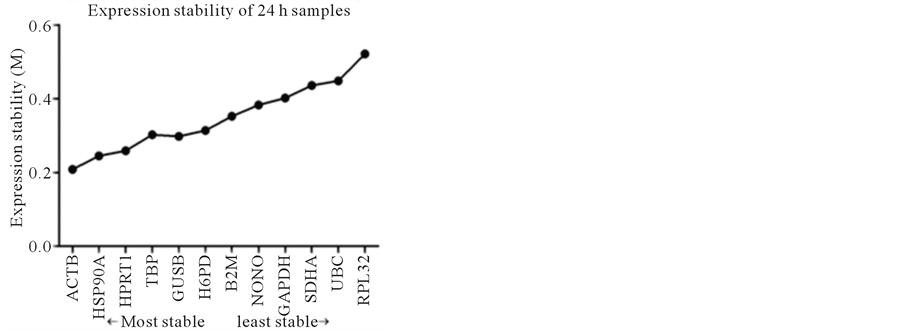 (b)
(b)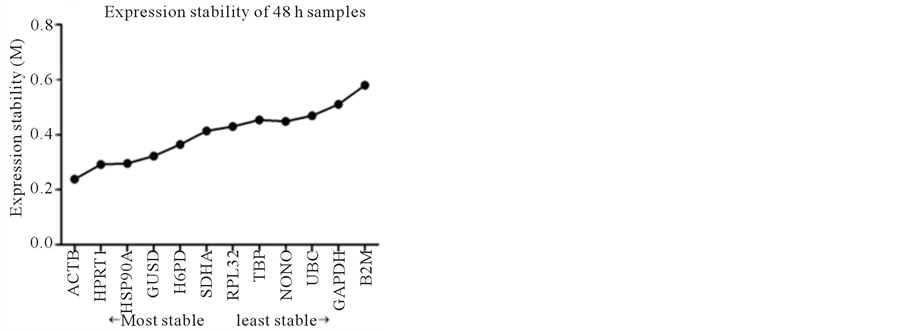 (c)
(c)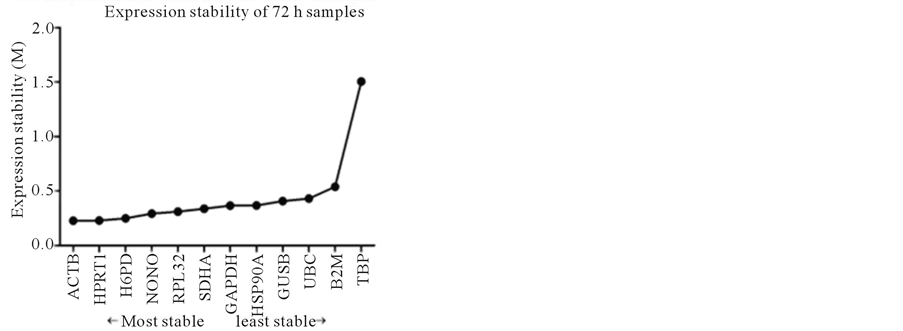 (d)
(d)
Figure 2. Stability of reference gene expression (M) calculated using SAS qPCR.

Figure 3. Determination of the optimal number of RGs for genes expression normalization.
When selecting optimal RGs, three Visual Basic Applications (geNorm, BestKeeper and NormFinder) are available. GeNorm is a currently preferred program for selection of the most stable reference genes using the principle that the expression ratio of two ideal reference genes is identical in all tested samples [13] . Using this program, candidate RGs for normalization were ranked according to their expression stability M values. The program NormFinder is another tool for identifying the optimal normalization genes among various candidate reference genes using a model-based approach. Norm-Finder ranks the various candidate reference genes according to their expression pair-wise variation Vn/n+1, and more stably expressed genes have lower average expression stability values [20] . The BestKeeper program is another Excel-based software tool such as geNorm and NormFinder software programs, and it determines the optimal reference gene using the coefficient of correlation analysis for all pairs of candidate reference genes (up to 10 genes), and calculation of the geometric mean, SD, and % CV for each candidate gene’s Cq values [21] .
In the present study, we evaluated expression stability of candidate RGs with SASqPCR [18] . This program was developed primarily based on the algorithm of geNorm. The key variable indexing the relative expression stability of reference genes is the M value, which is calculated as the mean standard deviation of the log-transformed expression ratios across samples for a particular gene relative to other genes remaining in the gene panel of reference candidates. The calculation is iteratively performed by stepwise exclusion of individual genes with the highest M value (i.e. the least stable gene) from the panel until the last three genes are reached. The most stable gene with the smallest M value is identified as a single gene in SASqPCR rather than two genes tied for the best stability. In addition, the expression stability of candidate genes was ranked based on their reverse order of stepwise exclusion in iterative calculation of cycles rather than the absolute M values as used in the geNorm program. These modifications provide more accurate assessment on the relative expression stability of candidate genes compared to geNorm.
The candidate RGs analyzed in present study are generally used as internal controls, because they are considered to have relatively stable expression in many tissues. However, examples exist to demonstrate that this assumption is not always correct. Two commonly used RGs, ACTB and GAPDH, were decreased in cells obtained by bronchoalveolar lavage and in biopsy samples from asthmatics not receiving inhaled corticosteroids, when compared with normal controls and asthmatic subjects receiving inhaled corticosteroids [16] . RGs clearly require careful validation before use for normalization of quantitative mRNA assay before and after a therapeutic treatment.
Previous studies on equine gene expression have used GAPDH as an internal RG for normalization [9] -[11] . Though in the present study, M values for GAPDH in all the four samples were below the cutoff value (<1.5), it was not the most stable RG. In fact, the M value of GAPDH was higher in control samples than that of any other RG, suggesting that GAPDH is not the best choice for ESWT studies. Notably, expression level of TBP was significantly (p < 0.05) increased 72 h post-ESWT, the M value for TBP in the 72 h samples was 1.505 > 1.5, suggesting that TBP was not suitable as a RG in the 72 h samples. All these, taken together, emphasized the importance of selecting optimal RG for qPCR normalization in ESWT study.
The results on the optimal number of RGs suggested that one most stable RG was sufficient for use in the present study. For all 4 samples studied, the three most stable RGs were ACTB, HSP90A and HPRT1 (Figure 2). Except control samples, ACTB was the most stable RG of the remaining 3 samples, obviously, ACTB would be the first choice for those samples. For the control samples, the most stable RG was HPRT1, followed by ACTB. Considering very slight difference between the M values in the control sample (ACTB was 0.225, and HPRT1 was 0.222), ACTB would be selected for control samples, too. Therefore, in present study, ACTB will be used as RG.
In the present study, a reliable strategy was outlined to identify the optimal RGs in ESWT study by combining analyses of expression stability and the number of optimal RGs. The results showed that one most stable RG was sufficient for normalization in the present study, and ACTB was the first choice for all the samples studied. Remarkably, TBP was not suitable as a reference gene in the 72 h samples post ESWT. The result of this study emphasized the importance of selecting optimal RGs in gene expression analysis using qPCR, provided a more reliable strategy to evaluate the appropriate RGs in the study of the effects of ESWT on gene expression is employed.
The study was supported by PA Racing Commissions, Pennsylvania Harness Horsemen Association at Pocono Downs and Chester Downs, Meadows Standardbred Owners Association, and Pennsylvania Horsemen Benevolent and Protective Association at Penn National, and Presque Isle Downs.
- Ogden, J.A., Tóth-Kischkat, A., and Schultheiss, R. (2001) Principles of Shock Wave Therapy. Clinical Orthopaedics and Related Research, 387, 8-17. http://dx.doi.org/10.1097/00003086-200106000-00003
- Haupt, G. (1997) Use of Extracorporeal Shock Waves in the Treatment of Pseudarthrosis, Tendinopathy and Other Orthopedic Diseases. The Journal of Urology, 58, 4-11.
- Furia, J.P., Rompe, J.D., Cacchio, A. and Maffulli, N. (2010) Shock Wave Therapy as a Treatment of Nonunions, Avascular Necrosis, and Delayed Healing of Stress Fractures. Foot and Ankle Clinics, 15, 651-662. http://dx.doi.org/10.1016/j.fcl.2010.07.002
- Wang, C.J., Huang, H.Y. and Pai, C.H. (2002) Shock Wave-Enhanced Neovascularization at the Tendon-Bone Junction: An Experiment in Dogs. The Journal of Foot and Ankle Surgery, 41, 16-22. http://dx.doi.org/10.1016/S1067-2516(02)80005-9
- Chen, Y.J., Kuo, Y.R., Yang, K.D., Wang, C.J., Sheen Chen, S.M., Huang, H.C., et al. (2004) Activation of Extracellular Signal-Regulated Kinase (ERK) and p38 Kinase in Shock Wave-Promoted Bone Formation of Segmental Defect in Rats. Bone, 34, 466-477. http://dx.doi.org/10.1016/j.bone.2003.11.013
- Chen, Y.J., Wang, C.J., Yang, K.D., Kuo, Y.R., Huang, H.C., Huang, Y.T., et al. (2004) Extracorporeal Shock Waves Promote Healing of Collagenase-Induced Achilles Tendinitis and Increase TGF-beta1 and IGF-I Expression. Journal of Orthopaedic Research, 22, 854-861. http://dx.doi.org/10.1016/j.orthres.2003.10.013
- Lee, T.C., Wang, C.J., Yang, Y.L., Huang, Y.H., Lin, W.C. and Chang, S.Y. (2010) Bone Morphogenetic Protein-2 Expression in Spinal Fusion Masses Enhanced by Extracorporeal Shock Wave Treatment: A Rabbit Experiment. Acta Neurochirurgica (Wien), 152, 1779-1784. http://dx.doi.org/10.1007/s00701-010-0744-0
- Ma, H.Z., Zeng, B.F. and Li, X.L. (2007) Upregulation of VEGF in Subchondral Bone of Necrotic Femoral Heads in Rabbits with Use of Extracorporeal Shock Waves. Calcified Tissue International, 81, 124-131. http://dx.doi.org/10.1007/s00223-007-9046-9
- Raabe, O., Shell, K., Goessl, A., Crispens, C., Delhasse, Y., Eva, A., et al. (2013) Effect of Extracorporeal Shock Wave on Proliferation and Differentiation of Equine Adipose Tissue-Derived Mesenchymal Stem Cells in Vitro. American Journal of Stem Cells, 2, 62-73.
- Link, K.A., Koenig, J.B., Silveira, A., Plattner, B.L. and Lillie, B.N. (2013) Effect of Unfocused Extracorporeal Shock Wave Therapy on Growth Factor Gene Expression in Wounds and Intact skin of Horses. American Journal of Veterinary Research, 74, 324-332. http://dx.doi.org/10.2460/ajvr.74.2.324
- Bosch, G., De Mos, M., Van Binsbergen, R., Van Schie, H.T., Van de Lest, C.H. and Van Weeren, P.R. (2009) The Effect of Focused Extracorporeal Shock Wave Therapy on Collagen Matrix and Gene Expression in Normal Tendons and Ligaments. Equine Veterinary Journal, 41, 335-341. http://dx.doi.org/10.2746/042516409X370766
- Huggett, J., Dheda, K., Bustin, S. and Zumla, A. (2005) Real-Time RT-PCR Normalisation; Strategies and Considerations. Genes and Immunity, 6, 279-284. http://dx.doi.org/10.1038/sj.gene.6364190
- Vandesompele, J., De Preter, K., Pattyn, F., Poppe, B., Van Roy, N., De Paepe, A., et al. (2002) Accurate Normalization of Real-Time Quantitative RT-PCR Data by Geometric Averaging of Multiple Internal Control Genes. Genome Biology, 3, RESEARCH0034.
- Selvey, S., Thompson, E.W., Matthaei, K., Lea, R.A., Irving, M.G. and Griffiths, L.R. (2001) β-Actin—An Unsuitable Internal Control for RT-PCR. Molecular and Cellular Probes, 15, 307-311. http://dx.doi.org/10.1006/mcpr.2001.0376
- Lee, J.H., Fitzgerald, J.B., Dimicco, M.A. and Grodzinsky, A.J. (2005) Mechanical Injury of Cartilage Explants Causes Specific Time-Dependent Changes in Chondrocyte Gene Expression. Arthritis & Rheumatism, 52, 2386-2395. http://dx.doi.org/10.1002/art.21215
- Glare, E.M., Divjak, M., Bailey, M.J. and Walters, E.H. (2002) β-Actin and GAPDH Housekeeping Gene Expression in Asthmatic Airways Is Variable and Not Suitable for Normalising mRNA Levels. Thorax, 57, 765-770. http://dx.doi.org/10.1136/thorax.57.9.765
- Ohl, F., Jung, M., Xu, C., Stephan, C., Rabien, A., Burkhardt, M., et al. (2005) Gene Expression Studies in Prostate Cancer Tissue: Which Reference Gene Should Be Selected for Normalization? Journal of Molecular Medicine, 83, 1014-1024. http://dx.doi.org/10.1007/s00109-005-0703-z
- Jiang, Z., Uboh, C.E., Chen, J. and Soma, L.R. (2013) Isolation of RNA from Equine Peripheral Blood Cells: Comparison of Methods. SpringerPlus, 2, 478. http://dx.doi.org/10.1186/2193-1801-2-478
- Ling, D. (2012) SASqPCR: Robust and Rapid Analysis of RT-qPCR Data in SAS. PlosOne, 7, e29788. http://dx.doi.org/10.1371/journal.pone.0029788
- Andersen, C.L., Jensen, J.L. and Orntoft, T.F. (2004) Normalization of Real-Time Quantitative Reverse Transcription-PCR Data: A Model-Based Variance Estimation Approach to Identify Genes Suited for Normalization, Applied to Bladder and Colon Cancer Data Sets. Cancer Research, 64, 5245-5250. http://dx.doi.org/10.1158/0008-5472.CAN-04-0496
- Pfaffl, M.W., Tichopad, A., Prgomet, C. and Neuvians, T.P. (2004) Determination of Stable Housekeeping Genes, Differentially Regulated Target Genes and Sample Integrity: BestKeeper—Excel-Based Tool Using Pair-Wise Correlations. Biotechnology Letters, 26, 509-515. http://dx.doi.org/10.1023/B:BILE.0000019559.84305.47

*Corresponding author.