American Journal of Plant Sciences
Vol.5 No.15(2014), Article ID:47696,12 pages
DOI:10.4236/ajps.2014.515247
Estimating Emission of Leaves Seedlings Forest in Different Shading Levels, at Conditions of Transition Amazon-Cerrado, Brazil
Emanoeli Borges Monteiro, Cátia Cardoso da Silva, Andréa Carvalho da Silva*, Adilson Pacheco de Souza*
Institute of Agricultural and Environmental Sciences, Federal University of Mato Grosso, Sinop, Brazil
Email: *acarvalho@ufmt.br, *adilsonpacheco@ufmt.br
Copyright © 2014 by authors and Scientific Research Publishing Inc.
This work is licensed under the Creative Commons Attribution International License (CC BY).
http://creativecommons.org/licenses/by/4.0/


Received 9 April 2014; revised 16 June 2014; accepted 4 July 2014
This study determined the thermal requirements of forest native seedlings (Hymenolobium petraeum and Parkia pendula) and exotic seedlings (Adenanthera pavonina and Cassia fistula) all belonging to Fabaceae family, in three shading conditions (full sun, 50% and 65% of global radiation attenuation by poliefinas black screens). Also they were estimated of leaf emergence by Phyllochron and the Wang and Engel models, on climatological conditions at Sinop (Region of Transition Amazon-Cerrado), Mato Grosso State, Brazil, for winter period (between June and August of 2012). The minimum (Tb) and maximum (TB) basal temperatures and the optimum temperature (Topt) of growth of each species were estimated by regressions between relative growth rates and minimum, maximum and average temperatures, respectively. The values of the estimated Tb were 15.0˚C, 16.4˚C, 14.5˚C and 14.6˚C; to TB were 39.7˚C, 37.1˚C, 38.6˚C and 40.1˚C; and to Topt were 24.4˚C, 24.9˚C, 24.9˚C and 25.1˚C to A. pavonina, C. fistula, H. petraeum and P. pendula, respectively. The Phyllochron model showed highest efficiency in the estimation of leaf appearance when compared to Wang and Engel method.
Keywords:Vegetative Growth, Thermal Sum, Degree-Days, Statistical Indicatives

The growth, development and yield of plants are resultant from interactions between environmental factors, crop management and genotype, being a high productivity dependent of metabolic efficiency and use of environmental resources [1] . The vegetables are organisms highly responsive to environment where they live, and influenced by factors such as solar radiation, temperature, water and nutrient availability. So, the knowledge about plant-environment relation is necessary.
The solar radiation availability affects the morphogenetic, phototropism and photosynthetic processes [2] [3] , establishing itself as the driving force of the latter process as it leads to the transformation of atmospheric CO2 in metabolic energy [4] . Its properties such as intensity, quality, duration and direction of solar radiation interfere on metabolic responses and development of plants [3] [5] . The characterizations of regarding adaptation under varied conditions are based on analysis of their growth characteristics, physiological behavior, speed standards and allocation efficiency of dry matter [6] [7] .
Among the processes resulting from the energy balance, temperature is one of environmental factors that most influences on metabolism of plants, acting in enzymatic activity and chemical reactions [8] , through the quantitative energetic effect, conditioning directly and indirectly, the processes of therm-periodism, therm-induction and therm-morphism. In photosynthetic process, low temperatures make CO2 fixation slower, whereas high temperatures cause considerable reduction in the carboxylation and photorespiration increase [9] .
According to Snyder et al. [10] , the increase of plant development rates is a linear function of temperature, being these variables correlated by several methodologies. In this context, the heat units (accumulated thermal sum or degree-days) are used to quantify the plants development, based on the requirements of duration of phenological phases and air temperature. This variable defines the daily energy accumulation between limiting conditions (minimum and maximum basal temperature) required by the plant, which evidence the energetic states (sensible heat) minimums propitious to metabolic processes, and the maximum levels, above which the respiratory rates exceed the rate production of photoassimilates [11] .
Thus, plants that are not under hydric stress, phytosanitary problems and nutritional restrictions present their growth rates expressed by the local environmental conditions, and in these cases, occur high rates of net carbon assimilation by photosynthetic process, contributing to the plant dry mass definition. The leaf area is a limiting factor for direct interference in light interception and in its conversion into chemical energy, influencing also in numerous processes such as the ground cover, competition with other plants, specific surface for evapotranspiration and aerodynamic resistance of canopy, among other interactions with the environment [12] [13] .
The quantitative growth analysis is paramount in the evaluation of plant production and requires information on the mass accumulation in different partitions of plants. Thus, the estimate of number of leaves (NL) has been widely used as a tool for ecophysiological studies of agricultural and forestry crops, to evaluate the plants development, since the NL can considered directly proportional to plant leaf area [14] . Based on mathematical modeling applied to ecophysiology, NL can be obtained by integrating the leaf appearance rate (LAR), which indicating the number of leaves that become visible on the main stem per unit time [15] -[18] . In turn, different methodologies are employed to estimate the LAR, especially the models Phyllochron and Wang and Engel for applications on modeling growth of forest seedlings.
The Phyllochron model is defined as the time elapsed between the appearance of successive leaves on the main stem of plant [19] and considers a linear relationship between air temperature and LAR [20] , expressed by the thermal sum required for appearance of each leaf [21] . The multiplicative model developed by Wang and Engel (WE) considers the effect of air temperature as a nonlinear function [f(T)] on the phenological response of plant and describes the environmental factors that influencing on the leaf emergence (LAR) through a beta function [16] . Although the Phyllochron method is widely used to estimate the growth of most crop [20] [22] , the assumption of proportional linearity between development rate and temperature is seen as a disadvantage [23] . According to Streck [22] and Xue et al. [20] , biological processes such as LAR, have non-linear responses to temperature. Estimates of leaf appearance through the Phyllochron methodology are recurring for crops like wheat [24] , cassava [25] , strawberry [26] , maize [27] and eggplant [28] , among others. As to the method of WE, studies with wheat [20] , potato [29] and maize [30] , among others were also found. In forest species, such searches were restricted to eucalypt [14] [31] , Araucaria [32] and olive tree [33] , not being reported in literature, evaluations for tropical native species.
Studies with air temperature, development and phenology tend to receive little attention, however, even considering the variability of growth and forest species development in tropical climates. The information is vital for the appropriate implementation of management for forest species, as well to improve the quality of produced seedlings, increasing the probability of successful implementation in plantations, whether for production or recovery [14] . In this context, considering the lack of information about the ecophysiological aspects of tropical forest seedlings, this study aimed to determine the thermal requirements of the following species: Adenanthera pavonina (L.), Cassia fistula (L.), Hymenolobium petraeum (Ducke) and Parkia pendula (Willd.), and estimate the leaf emission in forest seedlings, in different shading levels, in Sinop (Amazon-Cerrado transition), Mato Grosso State, Brazil.
The experiment was conducted between June and August 2012 at the Experimental Station of Federal University of Mato Grosso, located at Sinop (11˚51'08"S; 55˚30'56''W; 376 meters above sea level), Mid-North of Mato Grosso State (Cerrado-Amazon Transition), Brazil. The climate of this region according to Köppen’s classification is Aw—tropicalhot and humid climate, with distinct seasons: drought (May to September) and rainy (October to April), with average monthly temperatures between 24˚C and 27˚C, and annual rainfall around 1970 mm [34] .
The seeds were collected from health trees matrices, distributed in the vicinity of Sinop, Mato Grosso State. The germination occurred on germitex paper, into BOD growth chamber, with constant temperature of 30˚C. Sequentially, the seeds were transplanted to in black polyethylene bags (15 × 30 cm) with lateral holes for water drainage. The substrate utilized was a mixture of commercial substrate (compost by Pinus spp. bark biostabilized, vegetal turf, expanded vermiculite and acidy correctives) and Yellow-Red Oxisol from forestry in a 3.2:1 ratio, respectively. The fertilization was done with 500 g∙m−3 of NPK 4-14-8 granular fertilizer for provide the basic nutritional requirements for all evaluated species. Were employed suspended modular nurseries, built with wood in the dimensions of 1.5 × 5.0 × 1.0 m (width × length × height).
The seedlings were submitted to the following shading treatments: 0% (full sun), 50% and 65% of global radiation attenuation, through nylon black shade-screen (commercial screen Sombrite®). The shading levels were established by measurements of the luminosity (lux) in each treatment, with twelve measurements during the day, with hourly intervals, during the first 30 days after transplation (DAT), using a LD-200 digital luxmeter (Instrutherm). We used a no shaded control point to determine the measure of full sun. The irrigation management was performed by determining the daily evapotranspiration of species by weighing lysimeters.
Were employed meteorological data from the Meteorological Automatic Station (MAS), located in the 11.98˚S; 55.56˚W and altitude of 371 m above of sea level. As there was no routine to monitoring of air temperature (T) and global radiation (GR) on indoor the suspended tree nurseries, were performed periodic evaluations to obtain the correlations (in different shading conditions) to T and GR estimated, considering as reference the data monitored in MAS (treatment in full sun). The instant measures of GR were obtained with portable digital luximeters (LD-200) at 07:00, 09:00, 12:00, 15:00, 17:00 h, while the temperature and relative humidity of air measurements were performed daily (at same time) with digital thermo-hygrometers (HT-600).
Was adopted a completely randomized design with five replicates of four plants, with weekly non-destructive analysis (counting the number of leaves on the main stem) and biweekly destructive (total dry mass). The plants drying was obtained by kiln with air forced movement under temperature of ±65˚C, until constant mass be achieved, with determination on a digital scale precision 0.01 g. Sequentially, the growth relative rates of plants (GRR) was obtained in gg−1∙day−1 as proposed by Benincasa [35] . Were applied linear regressions obtained by correlations for determination of the minimum (Tm), medium (Tmed) and maximum (TM) air temperatures. Subsequently, were determined the minimum (Tb) and maximum (TB) basal temperatures of each species for all treatments with linear regressions between Tm and TM and GRR. Therefore, to define the optimal temperatures (Topt) were adjusted the polynomial regressions between Tmed and LAR.
Were evaluated two methodologies to leaves emission estimative on the main stem of the four studied species. Firstly, the Phyllochron method considers the plant development a linear function of thermal units accumulation, in other words, accumulated thermal sum (STa), expressed in degree day (˚C∙day−1) [36] . The calculation of the daily thermal sum (STd) was performed following the Omettomethodology [37] cited by Souza et al. [38] , using the following expressions for the local climate conditions:
Case 1: TB > TM; Tm > Tb:
 (1)
(1)
Case 2: TB > TM > Tb ≥ Tm:
 (2)
(2)
where: Tb and TB: minimum and maximum basal temperature, respectively (˚C); Tm and TM: daily minimum and maximum temperature, respectively (˚C); The STd accumulation over the development period, generates up STa (in ˚C∙day−1).
To application of Phyllochron model, firstly was performed a linear regression (Equation (3)) between the number of leaves on the main stem (NL) and STa [39] . For this, the Phyllochron (˚C∙day∙leaf−1) was obtained through the inverse slope of the linear regression equation, i.e., 1/a [20] [40] . The NL accumulated on the main stem was obtained by the ratio between STa and Phyllochron [40] .
 (3)
(3)
According to the Wang and Engel (WE) method [16] , LAR was obtained by multiplication between f(T) (nonlinear function of the temperature) and the maximum observed LAR (LARmax) [20] . WE model was expressed by the general formula [14] :
 (4)
(4)
where: LAR: leaf appearance rate (leaves day−1); LARmax: maximum leaf appearance rate (occurs in Topt) of species (leaf day−1); f(T): temperature beta function, which in conditions where Tmed < Tb or Tmed > TB has a null value, and when Tb < Tmed ≤ TB, is defined by Equation (5) [14] :
 (5)
(5)
where: Topt: optimum temperature for each species (˚C); The α coefficient was obtained based on niperiam logarithm (ln) by Equation (6) [14] :
 (6)
(6)
Finally, the NL by WE model was taken with the sum of daily values of LAR
 from transplanting date [16] [18] . To evaluate the performance of NL estimation methods
and enable indication which showed a better description of the forest species seedlings
development, was performed the F test between NL values observed to verify the data
variance homogeneity. Subsequently, were applied the RMSE indicatives (root mean
square error); dw (Willmott index adjustment); BIAS (systematic error); r (correlation
coefficient); and c (performance index) [20]
[22] [41]
-[43] .
from transplanting date [16] [18] . To evaluate the performance of NL estimation methods
and enable indication which showed a better description of the forest species seedlings
development, was performed the F test between NL values observed to verify the data
variance homogeneity. Subsequently, were applied the RMSE indicatives (root mean
square error); dw (Willmott index adjustment); BIAS (systematic error); r (correlation
coefficient); and c (performance index) [20]
[22] [41]
-[43] .
 (7)
(7)
 (8)
(8)
 (9)
(9)
 (10)
(10)
 (11)
(11)
where: Ei: estimated values; Oi: observed values; n: number of observations;![]() : average of estimated values and
: average of estimated values and![]() : average of observed values.
: average of observed values.
The RMSE value demonstrates the error produced by the model and its lower value indicates that better is the model [22] . The model accuracy was determined by the Willmott [41] concordance index, with values ranging from zero to one, refers to minimum and maximum concordance, respectively [40] . The BIAS index refers to the average deviation between the observed and estimated values, expressing this way the tendency of model [44] , being the best model analyzed, which present values close to zero [43] . The correlation coefficient (r) indicates the association degree between two or more variables, with values ranging from −1 to 1, and its higher absolute value indicates that occurs greater adhesion between estimated and observed values [44] . The model performance index (c) varies from 0 to 1 and the higher value indicates the better estimates performance [42] .
Finally, was employed the statistical method by position values (Vp) of statistical indicatives (scores), that classify and define the best method for the of leaf emergence estimation. To obtain the Vp were assigned weights of 1 to “n” for each statistical indicator, being “n” the number of tested models, in this case, were assigned weight “1” to the best model and “2” to the worst, and consequently, the best model is the one with the lowest sum of assigned weights or lower accumulated Vp [45] .
The averages of the main meteorological parameters monitored by Automatic Meteorological Station from June to August 2012 showed in Table1 The total rainfall was 4.80 mm during this period, with monthly average temperature of 24.45˚C. This study performed in dry season allowing evaluating the direct effects in growth and development of seedlings under shading conditions, considering that in the winter months (June, July and August) occur the higher temperature ranges in this region [34] . The water vapor has a great potential for radiation attenuation in the atmosphere during the summer or rainy season, the differences between nocturnal and diurnal temperatures are lower, mainly with attenuation in the maximum temperature resulting to the changes in direct and diffuse total components with cloudiness. Consequently, the coverage use tend to modify the behavior by changes in absorption, reflection and transmission of incident global solar radiation, and therefore, changes in the balance of short and long waves, which in turn allow variations in the available net energy for physical processes (latent and sensible heat), biochemical (photosynthesis) and biophysical (evapotranspiration).
The air temperature attenuation coefficients obtained for coverage with nylon black shade-screen of 50% and 65% attenuation, as well the linear regressions of correlations between the internal environment (shading) temperatures and external (full sun) ones are illustrated in Figure 1. The values of Tb and Topt estimated for each species shown in Table2 The cardinal average temperatures for the four forest species were 15.1˚C (Tb); 24.8˚C (Topt) and 38.9˚C (TB). Although the standard deviations between the values of basal temperatures for the four species had been low (0.87˚C; 1.37˚C and 0.28˚C for Tb, TB and Topt respectively), the H. petraeum and Parkia pendula showed the lowest Tb values (14.5˚C and 14.6˚C), whereas these species with A. pavonina showed higher TB values (38.6˚C; 40.1˚C and 39.7˚C, respectively).
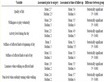
Table 1. Meteorological parameters collected by meteorological automatic station during period form 06/06 to 14/08/2012, at Sinop, Mato Grosso State, Brazil (11.98˚S and 55.56˚W).
DAT: days after transplantation; ETo: daily reference evapotranspiration.
Table 2. Values of optimal temperatures (Topt), minimum (Tb) and maximum (TB) basal temperatures estimated for forest species.

Figure 1. Correlations between daily mean temperatures (˚C) measured at full sun and under the covers at 50% and 65% shading by nylon black shade-screen (p = 0.01).
In the literature are reported the thermal requirements for perennials crops, especially Eucalyptus saligna species, whose values of Tb, TB and Topt are 8.0˚C; 35.0˚C and 25.0˚C, respectively [21] [46] ; Eucalyptus grandis are 10.0˚C; 36.0˚C and 27.0˚C [21] [47] ; whose for fig tree (Ficus carica), the values of Tb and TB are 8.0˚C and 36.0˚C [38] ; coffee (Coffea arabica) in implementation phase are 12.9˚C and 32.4˚C [48] ; and finally, the olive tree (Olea europaea L.) Tb is 8.5˚C [49] . The values of optimum temperatures (Topt) provides the higher development rates and hardly found in the literature for native species. However, it is noted that Topt values to H. peatrum and P. pendula are close to those determined for Eucalyptus species, while the values of Tb and TB were higher than, in view that they are originate from tropical regions and two are Amazonian.
As to the shading levels effect on the seedlings development, it was observed that the highest values of RGR occurred in 50% shade coverage for all species, indicating that this percentage can be considered suitable for accommodate the evaluated species seedlings. Based on the basal temperatures and daily average temperatures estimated at each cultivation condition, were obtained the STa values for the experimental period at the different treatments (Table 3), being observed small values of standard deviation of STa between the different coverage for all species.
The estimated Phyllochron values for the four forest species had low standard deviation between treatments, being the average values 11.40˚C day leaf−1; 19.54˚C day leaf−1; 26.72˚C day leaf−1 and 30.30˚C day leaf−1 for A. pavonina, C. fistula, H. petraeum and P. pendula. From these values, it is noteworthy that the higher Phyllochron value is the greater quantity of STa needed for leaf issuance, and thus, the species with the highest thermal demand to issue one leaf organ was P. pendula.
It was found out in NL estimates for A. pavonina, C. fistula and P. pendula in all treatments that the Phyllochron method overestimated the NL average, while the WE model propitiated under estimations. To H. petraeum, both models underestimated the NL with minimal values of 2.9 and 6.9 leaves to Phyllochron and WE, respectively (Figure 2). For all species and treatments, the standard deviation for Phyllochron method were higher than those presented by WE model. Analyzing the observed and estimated data (Figure 3) noted that for H. petraeum, the Phyllochron method approached the 1:1 line (simple linear regression with passage through the origin), indicating better accuracy of the estimate. For the other species, this behavior was given by the WE model, which presented values of determination coefficients (R2) higher than those adjusted for Phyllochron model.
The RMSE values were better in the WE method and lower those presented by Phyllochron method (except
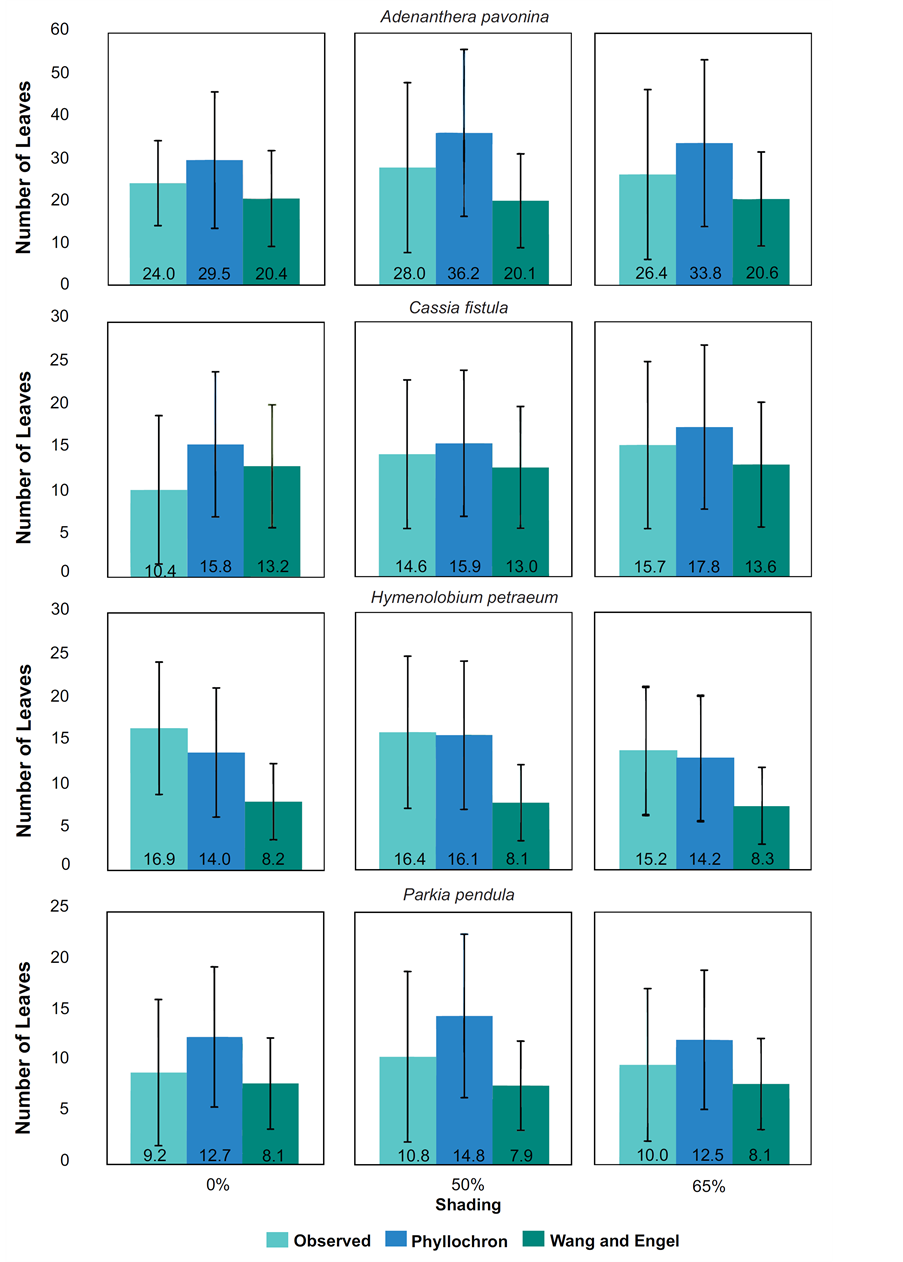
Figure 2. Means of accumulated leaves observed and estimated by two methods (Phyllochron and WE) for forest species at 50% and 65% shading by nylon black shade-screen.
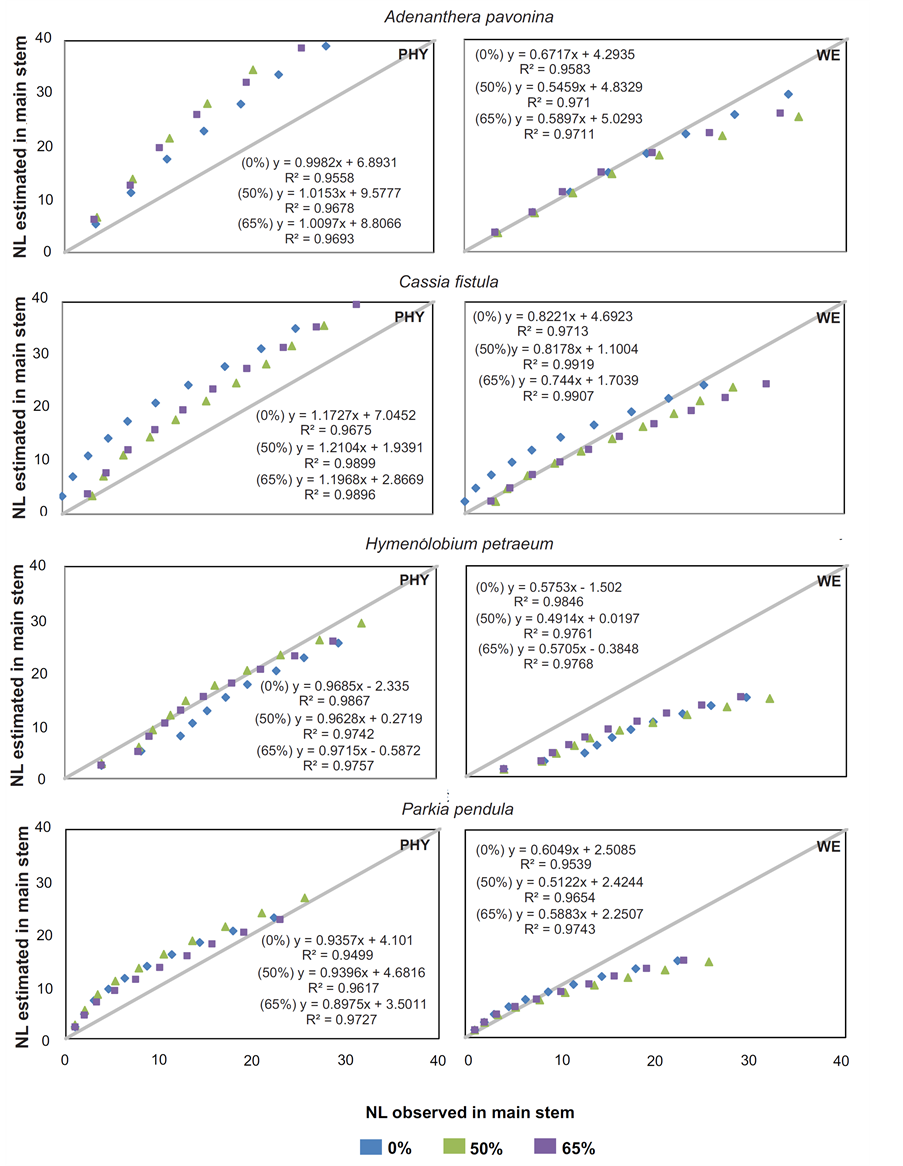
Figure 3. Number of accumulated leaves (NL) observed and NL estimated by two models (phyllochron and WE) for forest seedlings species at 50% and 65% shading by nylon black shade-screen.The solidlineisthe 1:1 linecross.
for H. petraeum in 50% shading), varying from 0.741 to 2.924 for WE and 1.418 to 8.891 for Phyllochron. In relation to correlation coefficient (r), performance index (c) and concordance index (dw), the Phyllochron method showed be superior than the WE method. Regarding the statistical indicatives (Table 4), it was observed
Table 3 . Accumulated thermal sum (STa, in ˚C∙day−1) estimated for forest species at 50% and 65% shading by nylon black shade-screen.
Table 4. Empirical values of the statistics used to classify Phyllochron (PHY) and Wang and Engel (WE) methods for four species in each treatment (0%, 50% and 65% shading).
The values in parentheses below each statistic relate to weights assigned second method of statistical weighted scores (Vp), where 1 refers to the best model and 2, to worst.
that the Phyllochron method showed lowest of Vp values when compared with the WE method for all species and treatments, being this way, indicated as the best method to estimate the leaf appearance.
Finally, the BIAS index indicated that the Phyllochron method excelled over WE, considering that for the species H. petraeum and A. pavonina, the first was superior in estimating the NL in all treatments, while the second was greater only in the full sun treatment for C. fistula and P. pendula. For the mentioned index, the values ranged from −0.021 to 0.519 and −0.229 to Phyllochron to −0.127 for WE.
The results were different from the observations for E. saligna and E. grandis, since for these species the best NL estimates given by WE method with nonlinear responses of LAR as a temperature function [14] . In general, the Phyllochron method criticized by considering the leaf emission response linear to temperature, what not accepted from the biological viewpoint. Streck [22] and Xue et al. [20] affirm that the linearity of responses (development) obtained only in the proximity of basal temperatures. However, this method is widely used to estimate crop development, mainly agricultural [20] , and which for forest species, the studies of this nature are not frequent.
The thermal requirements estimated for the species Adenanthera pavonina, Cassia fistula, Hymenolobium petraeum and Parkia pendula were respectively 15.0˚C, 16.4˚C, 14.5˚C and 14.6˚C, for the minimum basal temperatures; 39.7˚C, 37.1˚C, 38.6˚C and 40.1˚C, for the maximum basal temperatures; 24.4˚C, 24.9˚C, 24.9˚C and 25.1˚C, for optimum temperatures for development; and accumulated thermal sums (STa) averages are 682.15˚C∙day−1; 584.96˚C∙day−1; 715.14˚C∙day−1 and 707.06˚C∙day−1.
The Phyllochron model presented best estimates of leaf appearance of forest seedlings in shaded conditions and full sun.
- Whitehead, D. and Beadle, C.L. (2004) Physiological Regulation of Productivity and Water Use in Eucalyptus: A Review. Forest Ecology and Management, 193, 113-140. http://dx.doi.org/10.1016/j.foreco.2004.01.026
- Monteith, J.L. (1965) Light Distribution and Photosynthesis in Field Crops. Annals of Botany, 29, 17-37.
- Chory, J. (1997) Light Modulation of Vegetative Development. The Plant Cell, 9, 1225-1234.http://dx.doi.org/10.1105/tpc.9.7.1225
- Taiz, L. and Zieger, E. (2004) Fisiologia Vegetal. 3rd Edition, Artmed, Porto Alegre, 719 p.
- Engel, V.L. and Poggiani, F. (1991) Study of Foliar Chlorophyll Concentration and Its Light Absorption Spectrum as Related to Shading at the Juvenile Phase of Four Native Forest Tree Species. Revista Brasileira de Fisiologia Vegetal, 3, 39-45.
- Dias-Filho, M.B. (1997) Physiological Response of Solanum crinitum Lam. to contrasting Light Enviroments. Pesquisa Agropecuária Brasileira, 32, 789-796.
- Naves, V.L., Alvarenga, A.A. and Oliveira, L.E.M. (1994) Stomatal Behavior of Seedlings of Three Tree Species Subjected to Different Levels of Photosynthetically Active Radiation. Ciência e Prática, 18, 408-414.
- Oliari, I.C.R., Umburanas, R.C., Eschemback, V. and Kawakami, J. (2010) Effect of Restriction of Solar Radiation and Increases of Temperature on the Growth of Radish Plants. Applied Research and Agrotechnology, 3, 83-88.
- Larcher, W. (2000) Ecophysiological Plant. Rima, São Carlos, 531 p.
- Snyder, R.L., Spano, D., Cesaraccio, C. and Duce, P. (1999) Determining Degree-Day Thresholds from Field Observations. International Journal of Biometeorology, 42, 77-182. http://dx.doi.org/10.1007/s004840050102
- Souza, A.P., Leonel, S. and Silva, A.C. (2011) Basal Temperature and Thermal Sum in Phonological Phases of Nectarine and Peach Cultivars. Pesquisa Agropecuária Brasileira, 46, 1588-1596.
- Severino, L.S., Vale, L.S. and Beltrão, N.E.M. (2007) A Simple Method for Measurement of Jatropha curcas Leaf Area. Revista Brasileira Oleaginosas e Fibrosas, 11, 9-14.
- Severino, L.S., Cardoso, G.D., Vale, L.S. and Santos, J.W. (2004) A Method for Castor Beanleaf Area Estimation. Revista Brasileira de Oleaginosas e Fibrosas, 8, 753-762.
- Martins, F.B. and Streck, N.A. (2007) Leaf Appearance in Seedlings of Eucalyptus Estimated by Two Models. Pesquisa Agropecuária Brasileira, 42, 1091-1100. http://dx.doi.org/10.1590/S0100-204X2007000800005
- Amir, J. and Sinclair, T.R. (1991) A Model of Water Limitation on Spring Wheat Growth and Yield. Field Crops Research, 29, 59-96. http://dx.doi.org/10.1016/0378-4290(91)90074-6
- Wang, E. and Engel, T. (1998) Simulation of Phonological Development of Wheat Crops. Agricultural Systems, 58, 1-24. http://dx.doi.org/10.1016/S0308-521X(98)00028-6
- Streck, N.A., Bellé, R.A. and Schuh, M. (2005) Estimating Leaf Appearance Rate and Phyllochron in Safflower (Carthamus tinctorius L.). Ciência Rural, 35, 1448-1450. http://dx.doi.org/10.1590/S0103-84782005000600036
- Streck, N.A., Weiss, A., Xue, Q. and Baezinger, P.S. (2003) Incorporating a Chronology Response Function into the Prediction of Leaf Appearance Rate in Winter Wheat. Annals of Botany, 92, 181-190. http://dx.doi.org/10.1093/aob/mcg121
- Kirby, E.J.M. (1995) Environmental Factors Influencing the Phyllochron. Crop Science, 5, 11-19.
- Xue, Q.W., Weiss, A. and Baenziger, P.S. (2004) Predicting Leaf Appearance in Field-Grown Winter Wheat: Evaluating Linear and Non-Linear Models. Ecological Modelling, 175, 261-270. http://dx.doi.org/10.1016/j.ecolmodel.2003.10.018
- Martins, F.B., Silva, J.C. and Streck, N.A. (2007) Estimating Base Temperature for Leaf Appearance Rate and the Phyllochron in Two Eucalyptus Species during Seedling Phase. Revista árvore, 31, 373-381. http://dx.doi.org/10.1590/S0100-67622007000300002
- Streck, N.A. (2002) A Generalized Nonlinear Air Temperature Response Function for Node Appearance Rate in Muskmelon (Cucumis melo L.). Revista Brasileira de Agrometeorologia, 10, 105-111.
- Yan, W. and Hunt, L.A. (1999) An Equation for Modelling the Temperature Response of Plants Using only the Cardinal Temperatures. Annals of Botany, 84, 607-614. http://dx.doi.org/10.1006/anbo.1999.0955
- Walter, L.C., Streck, N.A., Rosa, H.T., Alberto, C.M. and de Oliveira, F.B. (2009) Vegetative and Reproductive Development of Wheat Cultivars and Its Association with Leaf Appearance. Ciência Rural, 39, 2320-2326. http://dx.doi.org/10.1590/S0103-84782009005000169
- Fagundes, L.K., Streck, N.A., Lopes, S.J., Rosa, H.T., Walter, L.C. and Zanon, A.J. (2009) Vegetative Development on Different Stems of Cassava as a Function of Planting Date. Ciência Rural, 39, 657-663. http://dx.doi.org/10.1590/S0103-84782008005000097
- Mendonça, H.F.C., Calvete, E.O., Nienow, A., Costa, R.C., Zerbielli, L. and Bonafé, M. (2012) Phyllochron Estimation in Intercropped Strawberry and Monocrop Systems in a Protected Environment. Revista Brasileira de Fruticultura, 34, 15-23. http://dx.doi.org/10.1590/S0100-29452012000100005
- Martins, J.D., Carlesso, R., Petry, M.T., Knies, A.E., Oliveira, Z.B. and Broetto, T. (2012) Estimating the Phyllochron in Maize Hybrids with Different Cycles of Vegetative Development. Ciência Rural, 42, 777-783.
- Maldaner, I.C., Guse, F.I., Streck, N.A., Heldwein, A.B., Lucas, D.D.P. and Loose, L.H. (2009) Phyllochron, Leaf Area, and Fruit Yield in Eggplants Grown with One and Two Stems per Plant in Plastic Greenhouse. Ciência Rural, 39, 671-677. http://dx.doi.org/10.1590/S0103-84782009005000013
- Streck, N.A., Lago, I., Paula, F.L.M., Bisognin, D.A. and Heldwein, A.B. (2007) Improving Predictions of Leaf Appearance in Field Grown Potato. Scientia Agricola, 64, 12-18. http://dx.doi.org/10.1590/S0103-90162007000100002
- Streck, N.A., Lago, I., Gabriel, L.F. and Samboranha, F.K. (2008) Simulating Maize Phenology as a Function of Air Temperature with a Linear and a Nonlinear Model. Pesquisa Agropecuária Brasileira, 43, 449-455. http://dx.doi.org/10.1590/S0100-204X2008000400002
- Martins, F.B. (2007) Development and Water Stress in Seedlings of Eucalyptus grandis (Hill ex Maiden) and Eucalyptus saligna (Smith). Dissertation Master’s in Agricultural Engineering, Federal University of Santa Maria, Santa Maria.
- Assumpção Neto, A. (2008) Plastochron and Phyllochron Apparent Annual in Araucaria angustifolia (Bert.) O. Ktze., in the Municipality of Colombo-PR. Dissertation Masters in Sciences, Federal University of Paraná, Curitiba.
- Martins, F.B., Reis, D.F. and Pinheiro, M.V. (2012) Base Temperature and Phyllochron in Two Olive Cultivars. Ciência Rural, 42, 1975-1981. http://dx.doi.org/10.1590/S0103-84782012001100011
- Souza, A.P., Mota, L.L., Zamadei, T., Martim, C.C., Almeida, F.T. and Paulino, J. (2013) Classificação climática e balanço hídrico climatológico no estado de Mato Grosso. Pesquisas Agrárias e Ambientais, 1, 34-43. http://dx.doi.org/10.14583/2318-7670.v01n01a07
- Benincasa, M.M.P. (2003) Growth Analysis of Plants (Basics Knowledge). FUNEP, Jaboticabal, 42 p.
- Pereira, L.C., Júnior, J.H.C. and Ferronato, A. (2010) Comparison of Methods for Estimating Plastochron in Cotton Plant under Tropical Weather Conditions. Pesquisa Agropecuária Tropical, 40, 213-220. http://dx.doi.org/10.5216/pat.v40i2.6716
- Ometto, J.C. (1981) Vegetable Bioclimatology. Agronômica Ceres, São Paulo, 425 p.
- Souza, A.P., Silva, A.C., Leonel, S. and Escobedo, J.F. (2009) Basic Temperatures and Thermal Sum for the Fig Trees Pruned in Different Months. Revista Brasileira de Fruticultura, 31, 314-322. http://dx.doi.org/10.1590/S0100-29452009000200005
- Frank, A.B. and Bauer, A. (1995) Phyllochron Differences in Wheat, Barley and Forage Grasses. Crop Science, 35, 19-23. http://dx.doi.org/10.2135/cropsci1995.0011183X003500010004x
- Streck, N.A., Lago, I., Buriol, G.A., Heldwein, A.B. and Tibola, T. (2006) A Non-Linear Model to Simulate Node Appearance in Muskmelon (Cucumis melo L.) Grown inside Plastic Greenhouse as a Function of Air Temperature. Revista Brasileira de Agrometeorologia, 14, 210-216.
- Willmott, C.J. (1981) On the Validation of Models. Physical Geography, 2, 184-194.
- Camargo, A.P. and Sentelhas, P.C. (1997) Performance Evaluation of Different Potential Evapotranspiration Estimating Methods in the State of São Paulo, Brazil. Revista Brasileira de Agrometeorologia, 5, 89-97.
- Leite, H.G. and Andrade, V.C.L. (2002) A Method for Conducting Forest Inventories without Using Volumetric Equations. Revista árvore, 26, 321-328. http://dx.doi.org/10.1590/S0100-67622002000300007
- Schneider, P.R. (1998) Regression Analysis Applied to Forestry. 2nd Edition, UFSM/CEPEF, Santa Maria, 236 p.
- Thiersch, A. (1997) Efficiency of Diameter Distributions Prognosis for the Production of Eucalyptus camaldulensis. Dissertation Masters in Sciences Forestry, Federal University of Lavras, Lavras.
- Nieto, V.M. and Rodriguez, J. (2003) Eucalyptus saligna Sm. In: Vozzo, J.A., Ed., Tropical Tree Seed Manual, USDA Forest Service, Washington DC, 468-469.
- Almeida, A.C., Landsberg, J.J. and Sands, P.J. (2004) Parameterization of 3-PG Model for Fast-Growing Eucalyptus grandis Plantations. Forest Ecology and Management, 193, 179-195. http://dx.doi.org/10.1016/j.foreco.2004.01.029
- Lima, E.P. and Silva, E.L. (2008) Base Temperature, Crop Coefficients and Degrees-Day for Arabic Coffee Plants in the Implantation Phase. Revista Brasileira de Engenharia Agrícola e Ambiental, 12, 266-273. http://dx.doi.org/10.1590/S1415-43662008000300007
- Melo-Abreu, J.P., Barranco, D., Cordeiro, A.M., Tous, J., Rogado, B.M. and Villalobos, F.J. (2004) Modelling Olive Flowering Date Using Chilling for Dormancy Release and Thermal Time. Agricultural and Forest Meteorology, 125, 117-127. http://dx.doi.org/10.1016/j.agrformet.2004.02.009

*Corresponding authors.