Green and Sustainable Chemistry
Vol. 2 No. 2 (2012) , Article ID: 18999 , 9 pages DOI:10.4236/gsc.2012.22007
Non Equilibrium Plasma Assisted Conversion of Fossil Fuels without CO2 Release
A. J. Drexel Plasma Institute, Drexel University, Philadelphia, USA
Email: ooo27@drexel.edu
Received January 17, 2012; revised February 21, 2012; accepted March 2, 2012
Keywords: Non Equilibrium Plasma; Carbon Suboxide; Partial Oxidation; Dielectric Barrier Discharge; Energy-Dispersive X-Ray Spectroscopy; Coal; Lignite; Butane
ABSTRACT
A new method of extracting the chemical energy from hydrocarbon fuels without the release of carbon dioxide is demonstrated. This novel approach has been made possible with non-equilibrium plasma. In addition to CO2 and CO, there is a lesser known carbon oxide called carbon suboxide which can be polymerized to form thermodynamically stable substances. A process of converting hydrocarbon fuels to hydrogen and carbon suboxide without the release of carbon dioxide using dielectric barrier discharge (DBD) plasma is described in detail. Thermodynamic calculations show energy of up to 78% for the production of hydrogen and carbon suboxide. Results from the analyses of the condensed byproducts of the hydrocarbon conversion process are also discussed.
1. Introduction
Much of the world’s utilization of hydrocarbons for energy production is achieved through the combustion of fossil fuels. Combustion processes are characterized by the release of carbon dioxide and water into the atmosphere. Unfortunately, carbon dioxide released due to fossil fuel combustion is responsible for approximately 57% of all anthropogenic greenhouse gas emissions [1]. An approach to reducing CO2 emissions is the shift from coal power plants to nuclear energy. In Europe, the total amount of electricity produced by nuclear power plants reaches 80% in France, 60% in Belgium and 43% in Sweden (14% of the world’s total electricity is produced by nuclear power plants) [2]. Recent nuclear accidents in Japan and Ukraine have negatively impacted the development of nuclear energy as a secure and clean energy source. Regrettably, nuclear accidents have resulted in the release and transfer of harmful radioactive materials into the natural environment with far reaching consequences. This has led to a widespread concern over existing plans for the development of the power industry. As a result, different initiatives have been proposed to redirect the power industry. One option is the transition to thermal power stations running on fuels (such as peat, lignite, and human wastes) with low energy content (10 - 25 MJ/kg). World reserves of lignite coal and sub-bituminous coal make up more than half of all coal reserves in the world. Another energy source that can replace nuclear power is natural gas; the world’s gas reserves are 1754 trillion cubic meters (2006). It is estimated that there are also about 900 trillion cubic meters of “unconventional” gas such as shale gas, of which 180 trillion cubic meters may be recoverable [3]. The third source of energy is biomass. Biofuels are gaining increased public and scientific attention, driven by factors such as oil price and the need for increased energy security.
The common methods of extracting chemical energy from a biomass feedstock include direct combustion and partial oxidation. The direct combustion of biomass approach results in release of the most significant amount of energy as well as water and CO2 but this process has a low efficiency—about 26% [4]. Another method of energy extraction from biomass is via reforming reactions (e.g. steam, dry CO2 or partial oxidation reactions), which results in the production of syngas (combination of hydrogen and CO). Syngas is subsequently burned in order to realize a significant amount of energy but this process also results in the eventual release of CO2. Direct combustion and reforming of biomass both result in production of significant quantities of CO2, a greenhouse gas. This drawback necessitates the adoption of expensive carbon sequestration (construction of underground storages for CO2, chemical binding with amines, etc.) methods which can cost as much as $1800 per ton of carbon for 2.3 × 10⁶ tons of carbon [5]. A third possible method of extracting energy from biomass is the partial oxidation reaction which results in the production of hydrogen and solid (C3O2)n (poly(carbon suboxide)).
This novel route, which involves the production of hydrogen and solid carbon suboxide from a hydrocarbon feedstock without CO2 emission is demonstrated in this paper. This approach was first suggested by A. Fridman et al. [6] and was based mainly on thermodynamic assumptions. Although this approach may result in less energy release in comparison to direct combustion and reforming reactions, it avoids the release of CO2 in the atmosphere. An added advantage to this approach is it’s byproduct—solid poly (carbon suboxide) (C3O2)n, major building block of organic fertilizers which improves soil fertility. The aim of this paper is to demonstrate, through experiments, the possibility of producing condensed carbon suboxide from a hydrocarbon feedstock using dielectric barrier discharge plasma; and also calculate the energy efficiency of hydrogen and solid carbon suboxide production from different feedstocks via thermodynamic calculations. Carbon suboxide (C3O2) is a foul-smelling lachrymatory non-toxic gas. It has linear symmetric structure that can be represented as O=C=C=C=O. Figure 1 shows the basic structure of the carbon suboxide polymer. The suboxide monomer is stable at –78˚C; at 25˚C it polymerizes to form a highly colored solid material with a polycyclic six-member lactone structure. Carbon suboxide is typically produced by thermal dehydration of malonic acid CH2 (COOH)2 in the presence of P4O10 (a drying agent) [6,7] . Carbonsuboxide is the acid anhydride of malonic acid, and it slowly reacts with water to produce malonic acid. It can be stored at a pressure of a few Torr, but under standard conditions C3O2 forms a yellow, red, or brown polymer (C3O2)n (ruby-red above 100˚C, violet at 400˚C, and it decomposes into carbon at 500˚C) [ 6-9].
The energy of formation for gas-phase carbon suboxide C3O2wasreported to be between –97.6 kJ/mol [10] and –95.4 kJ/mol [11]. The energy of formation for liquid polymerized carbon (C3O2)n is –100 kJ per one mole of carbon, and the energy of formation for solid polymerized carbon suboxide (C3O2)n is above –112 kJ per one mole of carbon [12-14] . (C3O2)n is a basic component of humic substances which is generally a composition of organic fertilizers [6,15] .
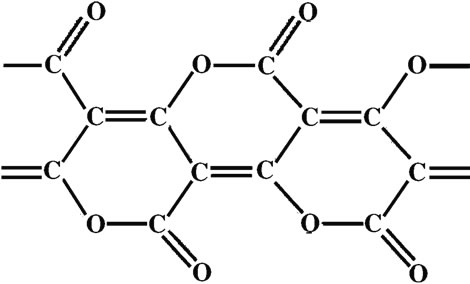
Figure 1. Basic structure of carbon suboxide (C3O2)n [8].
2. Thermodynamics
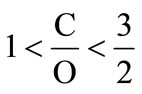
An important aspect of transitioning to new energy sources or new technologies for extracting energy from fuels is the energy cost involved and the advantages they have over preceding technologies. The thermodynamic aspect of producing energy (hydrogen) and suboxide from different types of hydrocarbon fuel is described in detail below. First, the general formula for calculating energy efficiency is derived, followed by the results of thermodynamic calculation for different types of fuel considered. The efficiency of hydrocarbon conversion resulting in solid carbon suboxide and hydrogen is measured with respect to the efficiency of producing syngas (particularly CO) from reforming reaction of a hydrocarbon feedstock. In this regard, the efficiency (%) of producing solid carbon suboxide is derived as a percentage of the efficiency of producing syngas (assuming the efficiency of producing syngas is 100%). In solid state, carbon suboxide can be in form of (C3O2)n and also in the form of monomers with carbon to oxygen ratio ,
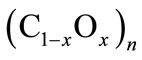
,  . The general formula for polymerized carbon suboxidecan be written as
 (1)
(1)
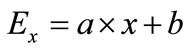
Here, coefficients x and 1 – x represent proportional amounts of atoms of oxygen and atoms of carbon in mole monomers (C1–xOx)n respectively. Coefficient x lies in the limits: 0.4 ≤ x < 0.5, where x = 0.4 corresponds to C0.6O0.4≡C3O2 (tricarbon dioxide). Since energy of formation for solid carbon suboxide is known only for tricarbon dioxide, energy of formation for a mole of monomers (1) can be approximated by the linear formula:
 (2)
(2)
where Ex represents the energy of formation and a & b are constants. Assuming that energy of formation for pure carbon (x = 0) equals 0, then constant b = 0. Also, since the energy of formation per one mole of monomers C1O2/3 is –112 kJ, therefore the energy of formation for monomers C0.6O0.4e quals E0.4 = –112 × (1 – 0.4) = –67.2 kJ. Substituting E0.4 in (2) allows calculating coefficient ![]()
 (3)
(3)
Biofuels such as oil, wood, peat, lignite (type of coal) and natural gas consist mainly of carbon, hydrogen and oxygen (95% - 98%). Therefore, the chemical formula for biofuel can be expressed in the form:
 (4)
(4)
where α, β and γ represent the ratios of molecules of carbon, oxygen and hydrogen in biofuel and it can be assumed that α + β + γ = 1. Also, hydrogen, oxygen and carbon in fuels can be expressed in weight percentage:
 (5)
(5)
It can be assumed again that Cw + Hw + Ow = 1. Formulas expressing values α, β, γ with respect to CwHwOw can be further written as:
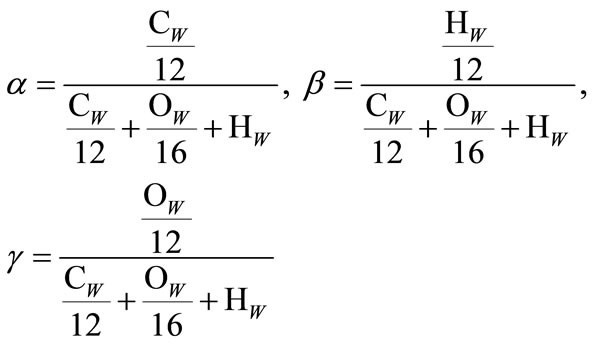 (6)
(6)
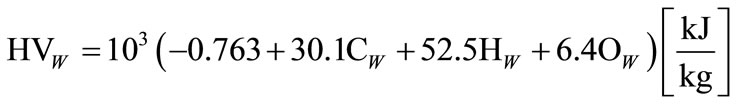
The formula expressing the heating value (HV) of hydrocarbon fuel in kJ per mole of monomers (4) with respect to heating value in kJ per kilogram is shown below:
 (7)
(7)
Calculatingthe theoretical heating value of partial oxidation of biofuel (4) to suboxide and hydrogen gives:
 (8.1)
(8.1)
 (8.2)
(8.2)
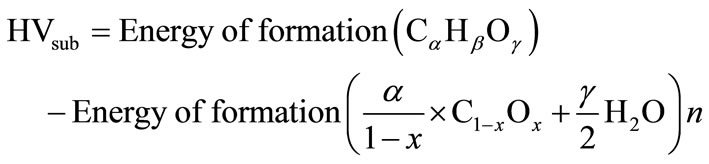
Reaction (8.1) represents the conversion of the fuel into solid carbon suboxide and hydrogen; while reaction (8.2) represents the combustion of hydrogen. The heating value of carbon suboxide (HVsub) can be expressed as:
 (9)
(9)
 (10.1)
 (10.2)
 (10.3)
Equation (10.1) describes the production of carbon monoxide and hydrogen from biofuel (4). Equation (10.2) and (10.3) correspond to the subsequent combustion of CO and H2 produced from conversion of biofuel. The energy released in reaction (10.1) is small. For methane, energy released in (10.1) equals 35.6 kJ per mole of carbon, which is only 4% of the full energy of combustion. For cellulose and lignite (C0.44O11H0.45), reaction (10.1) is endothermic; it demands an additional 9.5 kJ per mole of carbon for cellulose and 31 kJ per mole for lignite. This shows that the energy released in reaction (10.1) is insignificant and energy released in reaction (10.1) can be neglected. Therefore, the heating value of CO (HVCO) derived from (10.1 - 10.3) is stated below:
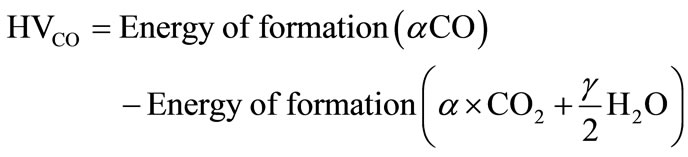 (11)
(11)
Energy efficiency of producing solid carbon suboxide and hydrogen from a hydrocarbon is defined by the ratio of heating value of carbon suboxide (9) and that of carbon monoxide (11):
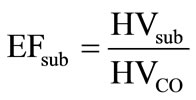 (12)
(12)
For a variety of fuels, the heating values are known but the energies of formation are unknown. In such instances, the energyof formation of a hydrocarbon fuel can becalculatedfrom the fuel’s compositionandheating value:
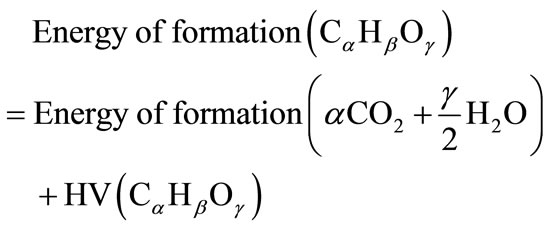 (13)
(13)
Calculation of the Efficiency of Hydrogen and Carbon Suboxide Production
The difficulty associated with the calculation of the energy efficiency of hydrogen production from biofuels lies in the fact that the formation enthalpy is not known for many biofuels. Therefore, the use of the formulas obtained from extrapolating experimental data become essential for the calculation of energy efficiency. In Table 1, the energy efficiency of hydrogen and solid carbon suboxide production with respect to the production of hydrogen and CO gas from methane, butane and cellulose is presented for different values of oxygen molecules in the monomer C1–xOx. Energy of formation values
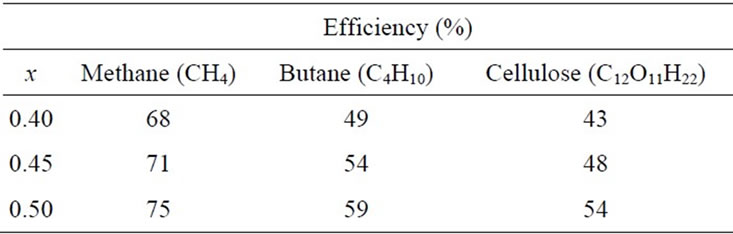
Table 1. Energy efficiency of producing carbon suboxide with respect to syngas production (100%).
were obtained from the National Institute of Standards and Technology (NIST), Chemical Kinetics Database [16]. In Table 1, x corresponds to the amount of oxygen molecules in the monomer C1–xOx; x = 0.4 corresponds to C3O2, x = 0.5 corresponds to monomer CO (x can be less than 0.5, but in this calculation, we have chosen x = 0.5).
In Table 2, the energy efficiency of hydrogen and suboxide production with respect to the production of hydrogen and CO gas from wood, sunflower oil, and castor oil are presented for different values of oxygen atoms in the monomer C1–xOx. For these calculations, energy of formation data were obtained from [17].
In Table 3, the energy efficiency of hydrogen and suboxide production with respect to the production of hydrogen and CO gas from biofuels and peat are presented. For these energy efficiency calculations, formula from [18] was used:
 (14)
(14)
This is the best approximation of experimental data for different concentrations of hydrogen , oxygen
 , and carbon
  for biofuel. In the calculations,
  = 0.06. It should be noted that heating value of peat is variable; it is dependent on moisture, composition and ash content. Biofuels and peat are categorized together due to the similarity in the composition and properties of dry peat and biofuels.
In Figure 2 and Table 4, the energy efficiency of hydrogen and solid carbon suboxide production with re-
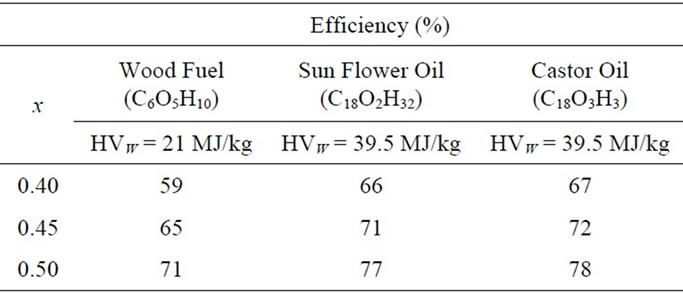
Table 2. Energy efficiency of producing hydrogen and solid carbon suboxide from wood, sunflower oil, and castor oil. HVW represents heating value in MJ/kg.
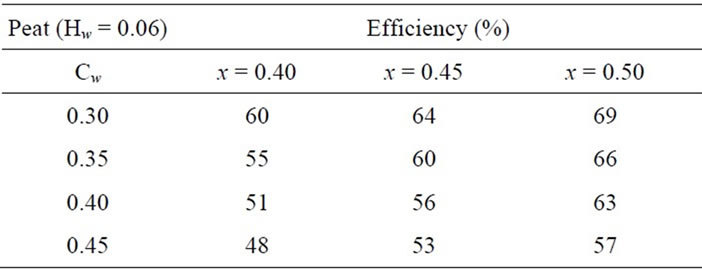
Table 3. Energy efficiency of producing hydrogen and solid carbon suboxide from peat.
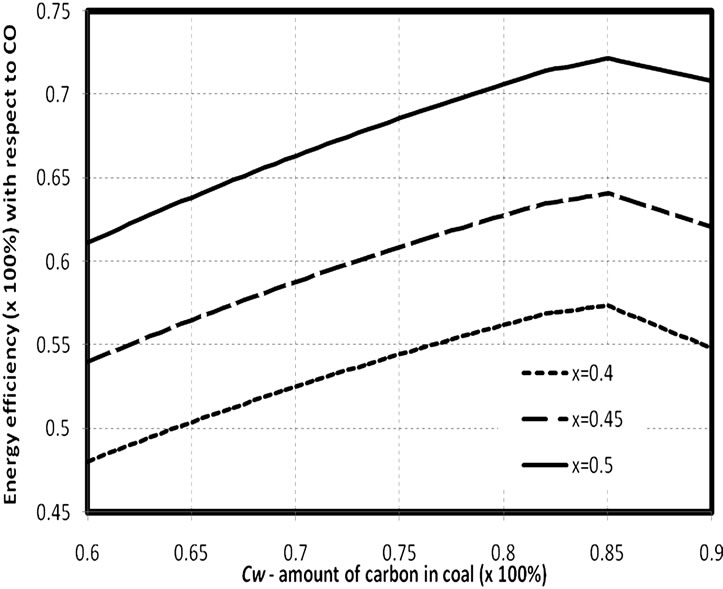
Figure 2. Energy efficiency of production of carbon suboxide and hydrogen with respect to heating value of production CO gas and hydrogen. x=0.4 corresponds to C3O2. HW lies in the limits 0.038 - 0.060.
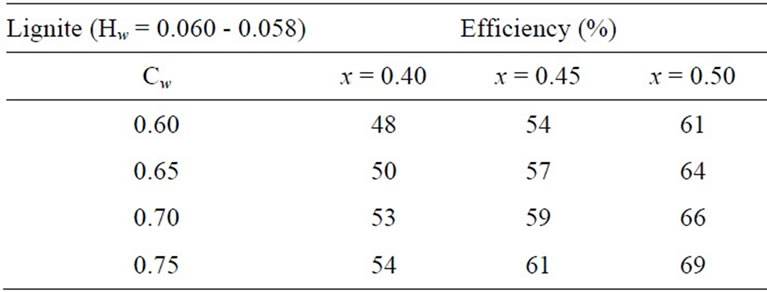
Table 4. Energy efficiency of producing hydrogen and solid carbon suboxide from coal.
spect to the production of hydrogen and CO gas from coal are presented. It should be noted that heating value of lignite changes in wide limits from 10 mega Joule per kg to 20 mega Joule per kg and in peat, the heating value depends on humidity and coal composition. Heating value calculations [19] were based on the formula stated below:
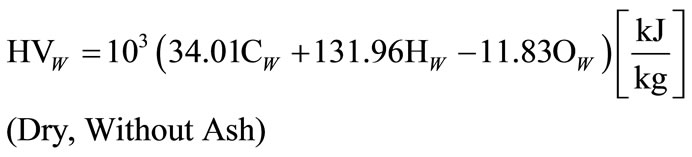 (15)
(15)
Results from thermodynamic calculations show that the energy efficiency of producing hydrogen and solid carbon suboxide can be up to 78% of energy efficiency of syngas production (depending on the type of hydrocarbon feedstock). The decrease in energy efficiency is compensated for by the elimination of CO2 emissions and production of two valuable products: hydrogen and carbon suboxide (a major component of organic fertilizers).
3. Experimental Apparatus
Gliding arc plasma (GAP), arc discharge and dielectric barrier discharge (DBD) are three atmospheric pressure plasma discharges considered for the carbon suboxide (C3O2) formation from plasma assisted hydrocarbon oxidation reaction. Arc discharge and gliding arc discharge proved to be ineffective in the formation of carbon suboxide due to the high heat energy of these plasma discharge types. A non-equilibrium plasma discharge (dielectric barrier discharge) is better suited for low temperature gaseous hydrocarbon oxidation reactions due to its low temperature and low power requirement. Low temperature plasma assisted oxidation of hydrocarbon was conducted in a dielectric barrier discharge (DBD) reactor with n-butane (C4H10) as the hydrocarbon feedstock mixed with air. The DBD reactor, Figure 3, consists of a 1.22 m long quartz tube with 22 mm internal diameter (ID). The quartz tube functions as a dielectric barrier. Inside the quartz tube is an 80 cm long stainless steel electrode that serves as the high voltage electrode. The high voltage electrode was held in place inside the quartz tube with the aid of a silicone stopper at the inlet of the quartz tube and a ceramic holder at the inner center of the reactor. The uniform distance between the high voltage electrode and the quartz inner wall will ensure the uniformity of the propagation of the plasma discharge from the high voltage electrode to the inner wall of the quartz tube. A copper mesh is wrapped around the outer surface of the quartz tube to align with the stainless steel electrode, spanning 40 cm in length. The copper mesh serves as the ground electrode. Butane gas and air were mixed before entering the DBD reactor. The gas mixture was delivered to the reactor via![]() ” tubes and fed directly into the reactor through an aperture within the stainless steel electrodes. Butane and air flow rates were each con trolled with Omega FMA-2605A series mass flow controllers according to the desired oxygen to carbon ratio.
” tubes and fed directly into the reactor through an aperture within the stainless steel electrodes. Butane and air flow rates were each con trolled with Omega FMA-2605A series mass flow controllers according to the desired oxygen to carbon ratio.
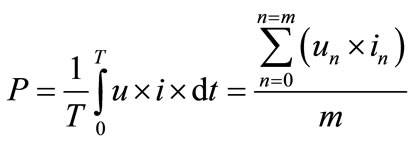
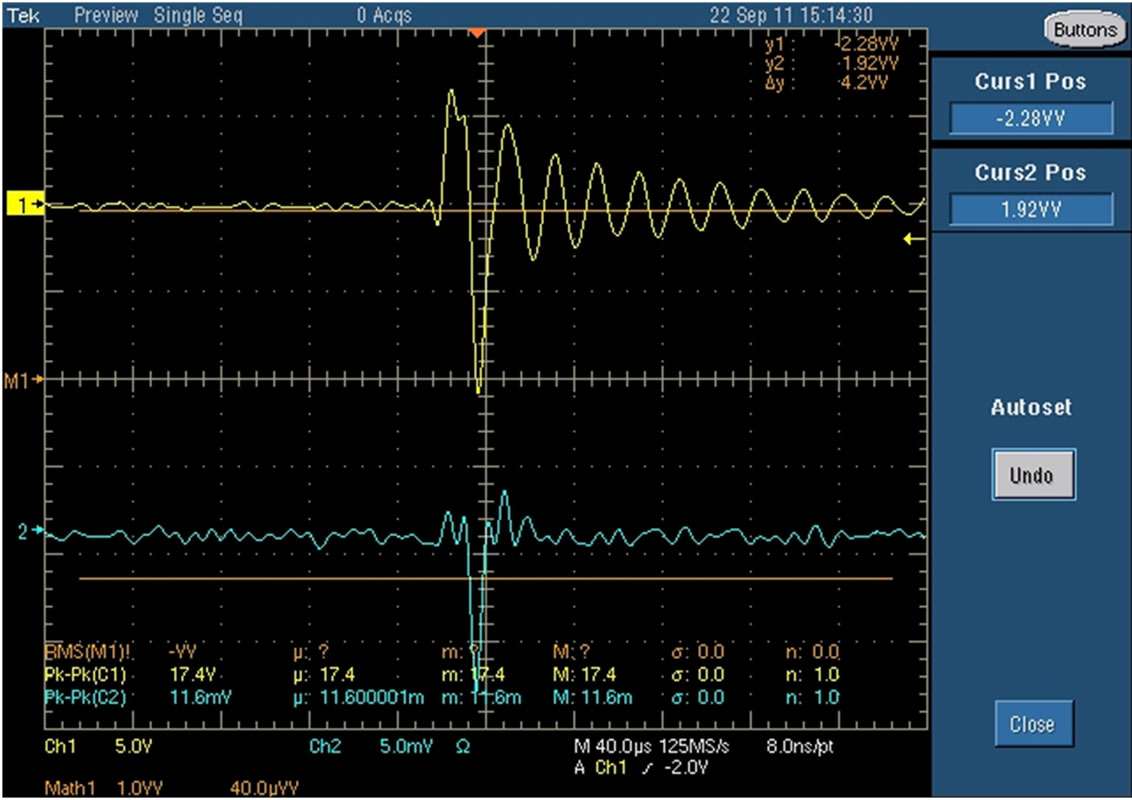
A variable alternating current (AC) power supply was used to generate the DBD plasma. The power supply has an operational frequency of 50 Hz - 1.66 kHz and a maximum peak-to-peak voltage range of 20 kV - 34 kV. Typical voltage and current waveforms of the plasma discharge are shown in Figure 4. A 500 MHz Tektronix digital phosphor oscilloscope is connected to the electrodes to monitor and evaluate the electrical characteristics of the plasma power. In order to obtain the total DBD power, integration of the voltage and current was conducted using the formula stated below and the parameters obtained from the oscilloscope. The average DBD power was calculated to be 80 Watts. The DBD power is calculated with the expression in Equation (16) below.
 (16)
(16)
P: DBD power; u: applied voltage; i: total current; m: the number of sample points; T: sampling time.
The butane oxidation chemical reaction to form hydrogen and carbon suboxide is given below:
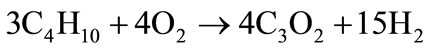 (17)
(17)
The cylindrical DBD reactor was placed in a temperature controlled Carbolite STF 16/610 furnace. In order to accelerate the rate of deposition of solid products pro-

Figure 3. Schematic of the experimental setup for the formation of carbon suboxide from hydrocarbon oxidation reaction.
 (a)
(a)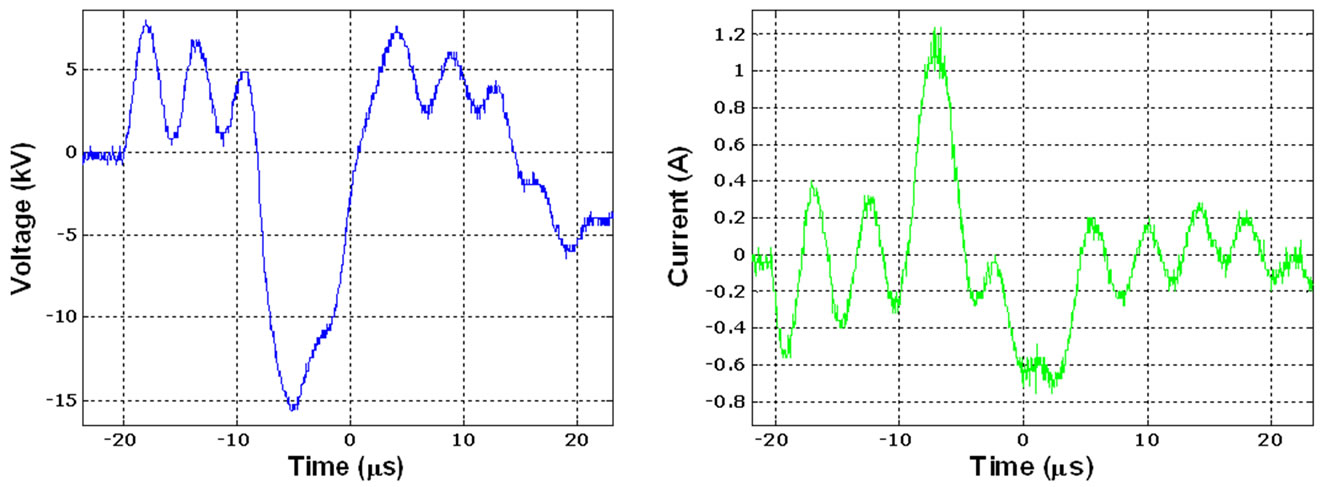 (b)
(b)
Figure 4. (a) DBD discharge voltage and current waveform screenshot taken from the oscilloscope; (b) Voltage and current characteristics of the plasma discharge. Plotted data points taken from a 500 MHz Tektronix digital phosphor oscilloscope.
duced from the plasma assisted oxidation of butane (C4H10), a water-cooled heat exchanger made from 1/16” copper tubing wound into a spiral shape was inserted inside the post-plasma region of the DBD reactor. Typical experiments involve the treatment of butane-air mixture with DBD for 150 minutes after which butane and air flows are shut off and the deposit dried up in the reactor via the heat from the furnace at 150˚C. Table 5 shows the typical experimental conditions for the n-butane oxidation experiments.
Dielectric barrier discharge is a non-thermal plasma discharge, which is strongly non-equilibrium at atmospheric pressure. DBD generates atomic and molecular species, free radicals and electrons with mean kinetic energy of 1 - 10 eV [8]. DBD already has a wide range of applications which include ozone generation, thin film

Table 5. Parameters and conditions of partial oxidation of butane experiments.
deposition [20,21] , polymer treatment [22,23] , pollution treatment [24], exhaust gas cleaning (from CO, NOx, SO2 and volatile organic compounds) [25], medical applications [8,22,26] , in CO2 lasers [27], plasma assisted combustion [8]. The dielectric barrier discharges have been extensively discussed in [28-30] As a result of a dielectric barrier between the high voltage and ground electrodes, the DBD requires alternating current for its operation.
The current passing through the dielectric is limited by factors such as the dielectric thickness, dielectric constant and the time derivative of the applied voltage dU/dt. High electric fields are required to propagate current through the discharge gap to cause a breakdown in the gas. The dielectric usually limits the current density in the gas space thereby acting as ballast which does not consume energy. Multiple micro-discharges can be observed when the electric field in the discharge gap is high enough to cause a breakdown. At higher frequencies, the dielectric material’s current limitation diminishes [27]. DBD is a non-uniform discharge which comprises of multiple, distributed micro-discharges in the discharge gap. The micro-discharges are usually in constant motion and interact frequently [8].
4. Results
The low temperature oxidation experiments were conducted in the DBD plasma reactor with butane (C4H10) and air as the reacting gases. The experiments were conducted at atmospheric pressure conditions. The temperature around the external region of the DBD reactor was constantly monitored with the aid of thermocouples connected to temperature readers. Glass slides (19 mm × 19 mm × 0.5 mm) were placed within the post plasma region of the DBD reactor to collect solid deposits for analyses and characterization.
Solid deposits start to form within moments of butaneair reaction in the presence of plasma as shown in Figure 5. The deposits formed within the post plasma region of the reactor usually appear reddish brown at temperatures between 150˚C - 400˚C and carbon black at temperatures greater than 500˚C. The reddish-brown deposits collected after 150 minutes of plasma treatment at low temperatures (150˚C - 400˚C) appear wet and adhesive. This is attributed to some water produced during the butaneoxidation reaction. The gas produced at the post plasma region of the DBD reactor as well as the reddish brown deposits were observed to be characterized by a pungent smell and induced lacrimation. The reddish brown deposits collected on the glass slides inside the reactor were dried (using the heat from a furnace) and analyzed for its
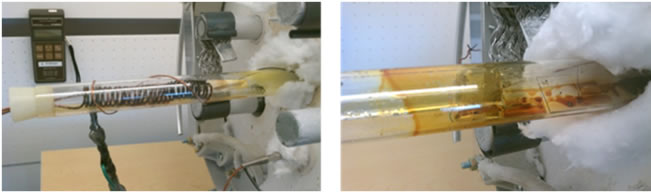
Figure 5. Initial stage of carbon suboxide formation in the DBD reactor (left) and the later stage of gradual carbon suboxide formation along the walls of the DBD reactor (right).
atomic composition via energy-dispersive X-ray spectroscopy (EDX).
4.1. Characterization
The characterization of the deposits obtained from the DBD reactor was carried out with Zeiss Supra 50 VP Scanning Electron Microscope with Energy-dispersive X-ray spectroscopy (EDX). This is an analytical technique used for the elemental analysis. EDX works by detecting characteristic X-rays that are produced by a sample placed in an electron beam [31]. In addition to visualization, SEM is capable of providing information such as surface topography and composition of the sample.
4.2 Procedure
To ensure the accuracy of the characterization results, a sample of caprolactam (C6H11NO) was tested first The Carbon: Oxygen atomic ratio result came out to be 5.5 - 6.5:1; confirming the accuracy of the EDX analysis. Elemental analysis tests were carried out on the solid deposit samples collected during the plasma assisted butane oxidation experiments (Figure 6). The Carbon: Oxygen ratio of the sample analyzed was in the range 1.5 - 1.8:1 (Table 6) and this ratio corresponds to that of carbon suboxide C3O2 (Carbon:Oxygen = 1.5). The corresponding SEM image of the characterized sample is shown in Figure 6.
Table 6 shows the analyses of a sample produced at Oxygen: Carbon = 0.42, 200˚C, 80 W and 1.2 L/min. Six different spots of the sample have been analyzed by EDX and based on the results the average C:O ratio at is 1.54. This result supports the assumption that the polymerized deposit has the similar atomic ratio as carbon suboxide (C3O2)n. Carbon suboxide (C3O2)n molecules have a carbon to oxygen ratio of 1.5. From further analyses, greater carbon: oxygen ratios were observed with increasing temperature. With the low flow rates of the gases involved in our experiments, hydrogen yield was extremely low, making analysis of the gas phase difficult.
Further work should be focused on establishing the optimal regimes for carbon suboxide and hydrogen production using different hydrocarbon feed stocks at dif
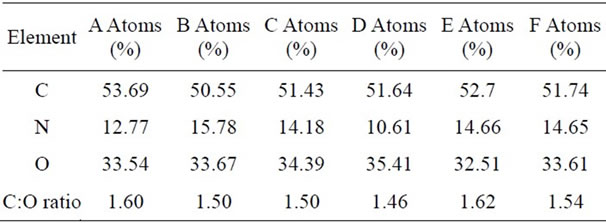
Table 6. Atomic balance of an analyzed sample, each column corresponds to the atomic ratio of each area of the sample analyzed with EDX.
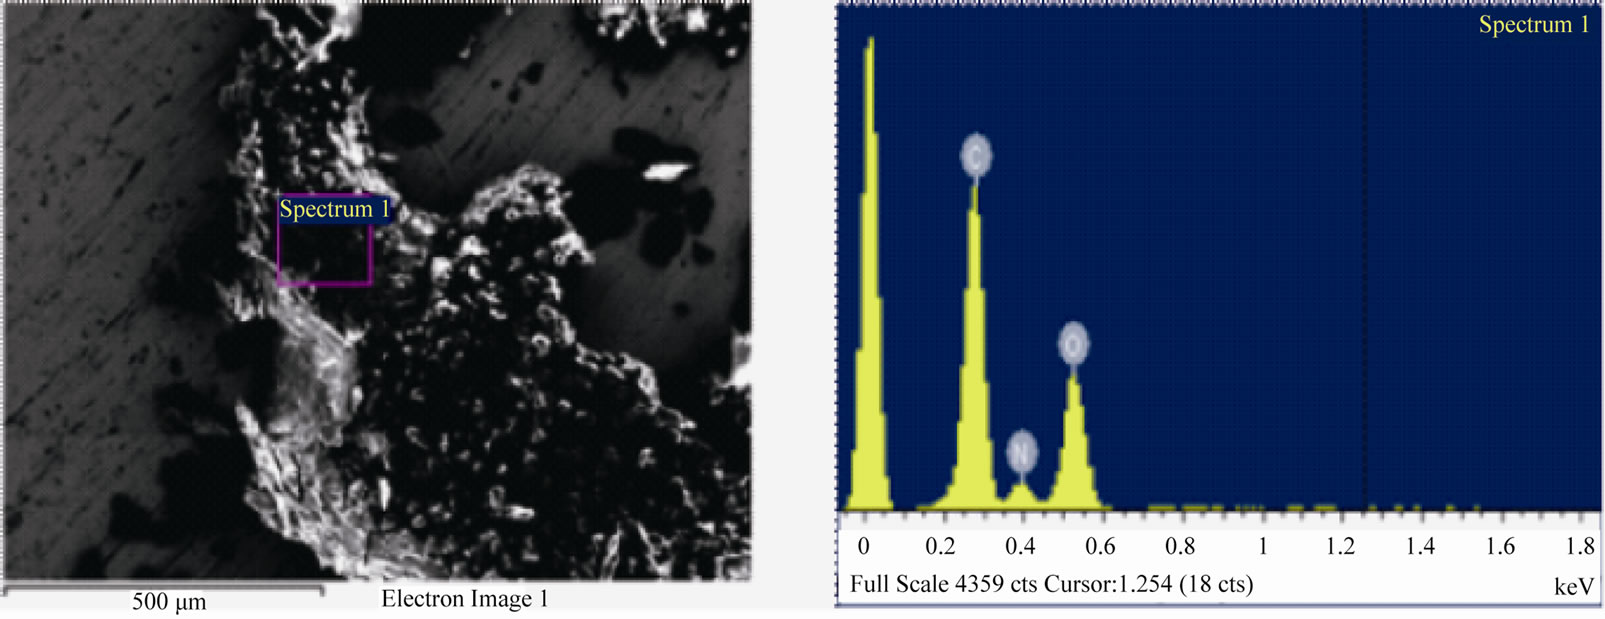
Figure 6. SEM image (left) and EDX spectrum (right) of deposit formed from plasma assisted butane oxidation. The EDX spectrum shows the carbon, oxygen and nitrogen atomic ratio of the sample.
ferent O/C ratios, temperature, plasma power and reagents flow rates. The future work will also include more detailed analyses of the gas phase products of the butane oxidation reaction.
5. Conclusion
Thermodynamic calculations show that it is possible to attain relatively high energy efficiency of conversion of abundant, low quality energy feedstock such as lignite, peat, and biofuels into hydrogen and carbon suboxide. The highlighted approach suggests a major shift of the paradigm of hydrocarbon feedstock as an energy source. It allows a substantial portion of energy to be released in the form of hydrogen, or eventually electricity, together with simultaneous bonding of carbon into solid polymerized carbon suboxide that can be used as organic fertilizers. Decrease in energy efficiency, when compared to synthesis gas production is compensated by the elimination of CO2 emissions and production of two valuable products: hydrogen and carbon suboxide. Experimental testing of non-thermal plasma reforming of butane in DBD reactor confirms carbon suboxide production. Elemental analysis (carried out with EDX spectroscopy) of the produced deposits suggests that C:O ratio in the analyzed sample is close to 1.5 and this corresponds to the C:O ratio of carbon suboxide (C3O2)n. The thermodynamic calculations show the efficiency of converting hydrocarbon feedstock such as low quality coal (lignite and peat) into carbon suboxide and hydrogen. The thermodynamic conversion efficiency was calculated to be as high as 78% with respect to the efficiency of converting the same hydrocarbon feedstock into hydrogen and carbon monoxide. The experimental results have demonstrated the possibility of producing carbon suboxide from a hydrocarbon feedstock—butane.
6. Acknowledgements
The project benefits from the support of the Prince Albert II of Monaco Foundation-USA http//www.fpa2.mc. Material characterization was performed using instruments in the Centralized Research Facility (CRF) of Drexel University.
REFERENCES
- R. K. Pachauri and A. Reisinger, “Climate Change 2007: Synthesis Report,” Intergovernmental Panel on Climate Change, Geneva, 2007.
- IAEA, “Energy, Electricity and Nuclear Power Estimates for the Period up to 2030,” International Atomic Energy Agency, 2009.
- CIA, “Natural Gas—Proved Reserves”. https://www.cia.gov/library/publications/the-world-factbook/rankorder/2179rank.html
- G. A. Deluga, et al., “Renewable Hydrogen from Ethanol by Autothermal Reforming,” Science, Vol. 303, No. 5660, 2004, pp. 993-997.
- G. R. Pautsch, et al., “The Efficiency of Sequestering Carbon in Agricultural Soils,” Contemporary Economic Policy, Vol. 19, No. 2, 2001, pp. 123-134. doi:10.1111/j.1465-7287.2001.tb00055.x
- A. Fridman, et al., “CO2-Free Energy and Hydrogen Production from Hydrocarbons,” Energy & Fuels, Vol. 20, No. 3, 2006, pp. 1242-1249. doi:10.1021/ef050247n
- J. Schmedt auf der Günne, et al., “The Structure of Poly (Carbonsuboxide) on the Atomic Scale: A Solid-State NMR Study,” Chemistry—A European Journal, Vol. 11, No. 15, 2005, pp. 4429-4440. doi:10.1002/chem.200401133
- A. A. Fridman, “Plasma Chemistry,” Cambridge University Press, Cambridge, 2008. doi:10.1017/CBO9780511546075
- P. A. Gerakines and M. H. Moore, “Carbon Suboxide in Astrophysical Ice Analogs,” Icarus, Vol. 154, No. 2, 2001, pp. 372-380. doi:10.1006/icar.2001.6711
- M. W. Chase Jr., “Nist-Janaf Themochemical Tables 4th Edition,” Journal of Physical and Chemical Reference Data, Monograph 9, 1998, pp. 1-1951. http://webbook.nist.gov/cgi/cbook.cgi?Source=1998CHA1-1951&Mask=2
- M. Ballauff, et al., “Analysis of Poly(Carbon Suboxide) by Small-Angle X-Ray Scattering,” Angewandte Chemie International Edition, Vol. 43, No. 2004, pp. 5843-5846. doi:10.1002/anie.200460263
- B. D. Kybett, et al., “The Heats of Formation and Polymerization of Carbon Suboxide,” The Journal of Physical Chemistry, Vol. 69, No. 10, 1965, pp. 3603-3606. doi:10.1021/j100894a060
- L. A. McDougall and J. E. Kilpatrick, “Entropy and Related Thermodynamic Properties of Carbon Suboxide,” The Journal of Chemical Physics, Vol. 42, No. 7, 1965, pp. 2311-2321. doi:10.1063/1.1696294
- V. Kondratiev, “Chemical Bonding Energies, Enthalpy of Chemical Processes, Ionization Potentials and Electron Affinities,” Nauka (Science), Moscow, 1974.
- S. G. Huber, et al., “Carbon Suboxide, a Highly Reactive Intermediate from the Abiotic Degradation of Aromatic Compounds in Soil,” Environmental Science & Technology, Vol. 41, No. 22, 2007, pp. 7802-7806. doi:10.1021/es071530z
- NIST, “A Compilation of Kinetics Data on Gas-Phase Reactions”. http://webbook.nist.gov/chemistry/
- P. S. Mehta and K. Anand, “Estimation of a Lower Heating Value of Vegetable Oil and Biodiesel Fuel,” Energy & Fuels, Vol. 23, No. 8, 2009, pp. 3893-3898. doi:10.1021/ef900196r
- C. Sheng and J. L. T. Azevedo, “Estimating the Higher Heating Value of Biomass Fuels from Basic Analysis Data,” Biomass and Bioenergy, Vol. 28, No. 5, 2005, pp. 499- 507. doi:10.1016/j.biombioe.2004.11.008
- Progress Publishing Co., “Engineering Mechanics: Electrical, Civil, Mechanical, and Mining Engineering,” 1892.
- F. Massines, et al., “Atmospheric Pressure Plasma Deposition of Thin Films by Townsend Dielectric Barrier Discharge,” Surface and Coatings Technology, Vol. 200, No. 5-6, 2005, pp. 1855-1861. doi:10.1016/j.surfcoat.2005.08.010
- J. M. Williamson, et al., “Comparison of High-Voltage ac and Pulsed Operation of a Surface Dielectric Barrier Discharge,” Journal of Physics D: Applied Physics, Vol. 39, No. 20, 2006, p. 4400. doi:10.1088/0022-3727/39/20/016
- G. Borcia, et al., “Dielectric Barrier Discharge for Surface Treatment: Application to Selected Polymers in Film and Fibre Form,” Plasma Sources Science and Technology, Vol. 12, No. 3, 2003, p. 335. doi:10.1088/0963-0252/12/3/306
- Z. Cheng, et al., “Surface Treatment of Polyethylene Terephthalate Films Using DBD Excited by Repetitive Unipolar Nanosecond Pulses in Air at Atmospheric Pressure,” IEEE Transactions on Plasma Science, Vol. 38, No. 6, 2010, pp. 1517-1526. doi:10.1109/TPS.2010.2045660
- J.-P. Borra, “Nucleation and Aerosol Processing in Atmospheric Pressure Electrical Discharges: Powders Production, Coatings and Filtration,” Journal of Physics D: Applied Physics, Vol. 39, No. 2, 2006, p. R19. doi:10.1088/0022-3727/39/2/R01
- U. Roland, et al., “Improved Oxidation of Air Pollutants in a Non-Thermal Plasma,” Catalysis Today, Vol. 73, No. 3, 2002, pp. 315-323. doi:10.1016/S0920-5861(02)00015-9
- H. Ayan, et al., “Heating Effect of Dielectric Barrier Discharges for Direct Medical Treatment,” IEEE Transactions on Plasma Science, Vol. 37, No. 1, 2009, pp. 113- 120. doi:10.1109/TPS.2008.2006899
- U. Kogelschatz, “Dielectric-Barrier Discharges: Their History, Discharge Physics, and Industrial Applications,” Plasma Chemistry and Plasma Processing, Vol. 23, No. 1, 2003, pp. 1-46. doi:10.1023/A:1022470901385
- S. Tao, et al., “Nanosecond-Pulse Dielectric Barrier Discharge Using Magnetic Compression Solid-State Pulsed Power,” IEEE International Power Modulator and High Voltage Conference (IPMHVC), Atlanta, 23-27 May 2010, pp. 481-484.
- S. Tao, et al., “Experimental Study on Repetitive Unipolar Nanosecond-Pulse Dielectric Barrier Discharge in Air at Atmospheric Pressure,” Journal of Physics D: Applied Physics, Vol. 41, No. 21, 2008, p. 215203. doi:10.1088/0022-3727/41/21/215203
- R. Geiger and D. Staack, “Analysis of Solid Products Formed in Atmospheric Non-Thermal Carbon Monoxide Plasma,” Journal of Physics D: Applied Physics, Vol. 44, No. 27, 2011, p. 274005. doi:10.1088/0022-3727/44/27/274005
- A. J. Garratt-Reed, D. C. Bell, et al., “Energy-Dispersive X-Ray Analysis in the Electron Microscope,” Bios Scientific Publishers, Ltd., Oxford, 2003.