Journal of Biophysical Chemistry
Vol.2 No.2(2011), Article ID:5151,10 pages DOI:10.4236/jbpc.2011.22017
Monitoring the autoproteolysis of HIV-1 protease by site-directed spin-labeling and electron paramagnetic resonance spectroscopy
1Department of Chemistry, University of Florida, Gainesville, USA; *Corresponding Author: fanucci@chem.ufl.edu
2Institute for Cancer Genetics, Columbia University Medical Center, New York, USA;
3Syngenta Crop Protection, Inc., Greensboro, USA;
4Department of Chemistry, University of Alabama, Tuscaloosa, USA.
Received 16 December 2010; revised 16 February 2011; accepted 27 March 2011.
Keywords: HIV-1 Protease; Autoproteolysis; Self-Proteolytic Activity; Site-Directed Spin-Labeling; Electron Paramagnetic Resonance (EPR)Spectroscopy
ABSTRACT
Site-directed spin-labeling with continuous wave electron paramagnetic resonance spectroscopy was used to monitor autoproteolysis of HIV-1 protease, an enzyme essential for viral maturation. Two protein constructs were examined, namely subtype F and the circulating recombinant form CRF01_A/E. As the protease undergoes self-cleavage, protein unfolds and small peptide fragments containing the spin label are generated, which collectively give rise to a sharp spectral component that is easily discernable in the high-field resonance line in the EPR spectrum. By monitoring the intensity of this spectral component over time, the autoproteolytic stability of each construct was characterized under various conditions. Data were collected for samples stored at 4˚C, 25˚C, and 37˚C, and on a subtype F HIV-1 protease sample stored at 25˚C and containing the FDA-approved protease inhibitor Tipranavir. As expected, the rate of autoproteolysis decreased as the storage temperature was lowered. Minimal autoproteolysis was seen for the sample that contained Tipranavir, providing direction for future spectroscopic studies of active protease samples. When compared to standard methods of monitoring protein degradation such as gel electrophoresis or chromatographic analyses, spin-labeling with CW EPR offers a facile, real-time, non-consuming way to monitor autoproteolysis or protein degradation. Additionally, mass spectrometry studies revealed that the N-termini of both constructs are sensitive to degradation and that the sites of specific autoproteolysis vary.
1. INTRODUCTION
Human immunodeficiency virus type 1 protease (HIV1PR), EC 3.4.23.16, is an aspartic protease that functions as a homodimer, comprised of two 99 amino acid monomers, to cleave the viral polyproteins gag and gag-pol resulting in viral maturation. Because of its function, this viral enzyme is a major target of human immunodeficiency virus (HIV) and acquired immunodeficiency syndrome (AIDS) antiretroviral therapy [1]. It is well known that HIV-1PR undergoes autoproteolysis [2-4] , an aspect that introduces challenges for structural biology characterizations particularly when relatively high concentrations are required for spectroscopic or crystallographic studies. When attempting structural characterizations of proteins with self-proteolytic activities, it is advantageous to understand the autoproteolysis kinetics and how to best store and handle samples in efforts to minimize self-degradation. Here, we set out to examine optimal preparation and storage conditions for this important enzyme, as well as to describe a sensitive and non-consuming methodology that can be utilized to study slow proteolysis of spin-labeled biomacromolecules in general. We sought to determine how time, temperature, buffer conditions, and presence of inhibitor affected the rate of autoproteolysis, all while utilizing HIV-1 protease as a well-studied model system for use in methods development. As expected, the presence of inhibitors added during or immediately following protein refolding mitigated degradation. In addition to providing useful information regarding successful purification and biophysical characterization of an important protein, these results demonstrate the utility of the SDSL EPR system in monitoring autoproteolysis.
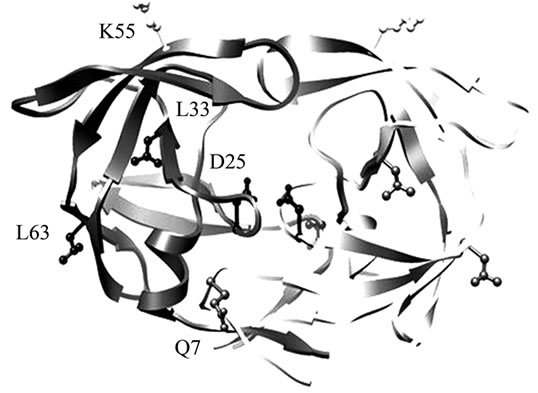
Site-directed spin-labeling (SDSL) coupled with continuous wave electron paramagnetic resonance spectroscopy (CW EPR) is a powerful technique that can be utilized to examine protein structure, including secondary and tertiary structure, conformational changes and dynamics [5-10] . Here, we show how it can also be used to monitor the rate of autoproteolysis of HIV-1PR. SDSL EPR is not hampered by size limitations, and the exquisite sensitivity stems from the relative rarity of unpaired electrons in biological systems. In protein systems, typically a specific site is chosen for spin label incorporation via site-directed mutagenesis, which most often changes the native amino acid to a cysteine residue that can subsequently be chemically modified by a sulfhydryl reactive spin label [7]. Figure 1(a) shows a crystal structure of HIV-1PR and the locations of the D25 and D25’ active site residues, the K55C and K55C’ residues, found in the flap region and chosen as reporter sites for spin label incorporation, and the stabilizing mutations Q7K, L33I, and L63I (described within). Figure 1(b) describes the resulting structure after chemical modification of the CYS side-chain with the MSL spin label. The mobility of the nitroxide label, once appended to a protein, is highly sensitive to its local environment, and the EPR spectral line shape reflects changes in the spin label correlation time [7-9] . SDSL with EPR is an ideal methodology for studying biomolecular systems because it requires only very small sample volume (as low as ~5 µL) and boasts sub-nanomole detection limits with little background interference. Additionally, analysis of CW EPR line shapes provides an excellent non-consuming and non-destructive means to examine protein autoproteolysis.
HIV-1PR can be classified into various groups, subtypes (or clades), and circulating recombinant forms (CRFs) [11,12]. Protease inhibitors used in treatment of HIV-1 are generally designed with respect to subtype B [13], which is the dominant HIV-1 subtype in Western Europe and the United States, though only a relatively small percentage of worldwide HIV infection results from subtype B. Various reports show that key differences occur in structure and dynamics of the protease among the subtypes and CRFs as a result of the assorted sequences that define each subtype, demonstrating the need to understand the key variations between subtypes that may affect efficacy of inhibitors [14].
Due to the autoproteolytic activity of HIV-1PR, many structural and spectroscopic investigations are conducted with inactive (D25N) protease constructs [14-17] . In order to continue investigations on active protease, it is
 (a)
(a)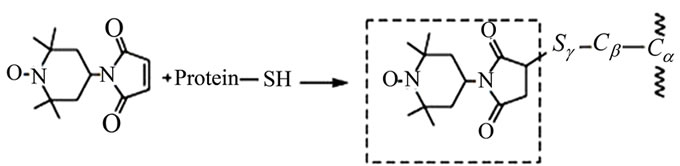 (b)
(b)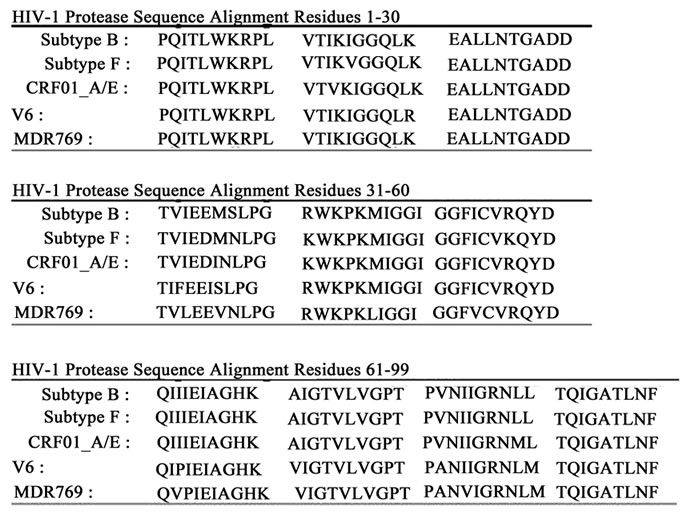 (c)
(c)
Figure 1. (a) Ribbon diagram of HIV-1 protease with K55 and K55’ reporter sites, D25 and D25’ active site residues, and Q7K, L33I and L63I substitutions shown in stick format (black); (b) Scheme of addition of 4-Maleimido-2,2,6,6-tetramethyl-1-piperidinyloxy free radical spin label (4-Maleimido TEMPO) via site-directed spin-labeling; (c) Sequence alignments of HIV-1 protease subtypes B and F, and CRF01_A/E. D25, K55C; the sites of stabilizing mutations (Q7K, L33I and L63I) are shown in bold and the known sites of subtype B autoproteolytic cleavage are given by slash marks in the subtype B sequence.
important to fully understand how conditions during sample preparation and storage affect the autoproteolytic process. To that end, the course of autoproteolysis of active spin-labeled HIV-1PR constructs derived from subtypes F and CRF01_A/E was monitored via EPR spectroscopy for a period of 100 days under various conditions. Over time, an isotropic EPR signal with sharp spectral features developed in the high field resonance of the EPR spectrum. The time evolution of this spectral feature provided for a direct means of monitoring protein degradation. By quantitative analysis of the normalized intensity of the high field line, a value proportional to the concentration of the proteolysed HIV-1PR can be obtained. This methodology has the advantage over HPLC or SDS-PAGE that it is both non-destructive and requires very little protein sample. Additionally, mass spectrometry was utilized to identify the sites of cleavage in subtype F and CRF01_A/E constructs. Amino acid sequences of subtypes B, F and CRF01_A/E constructs, as well as drug-resistant patient isolates V6 and MDR769, are shown in Figure 1(c).
Sequence determination of post-proteolysed peptide fragments, by Edman degradation, has identified three primary sites of proteolytic cleavage for subtype B protease, including peptide bonds located between amino acid residues L5-W6, L33-E34 and L63-I64 [2-4] . Rose et al. showed that by engineering a Q7K amino acid substitution to render the primary site of cleavage less labile, autoproteolysis is reduced by more than 100-fold [3]. Subsequently, Mildner et al. introduced the additional substitutions L33I and L63I to produce a triply substituted construct, which was shown to retain the specificity and kinetic properties of the wild-type enzyme but was highly stabilized against autoproteolysis [18]. Thus, the protein constructs examined here (excluding V6 and MDR769) incorporate the amino acid substitutions Q7K, L33I and L63I.
Protease samples used in EPR studies of the affect of ionic strength on protein aggregation were labeled with (1-oxyl-2,2,5,5-tetramethyl-Δ3-pyrroline-3-methyl) methanethiosulfonate (MTSL). All other constructs, including those used in the study of autoproteolysis, were labeled with 4-Maleimido-TEMPO (MSL). Though MTSL is the standard spin label in most SDSL EPR studies, the choice of spin label was carefully considered. MSL forms a non-reducible C-S bond with the free thiol of a CYS residue. MTSL, on the other hand, forms an S-S bond. Under certain conditions, the disulfide bond linking MTSL to the protein may be reduced, liberating free spin label that could complicate EPR line shape analysis. Similarly, formation of highly flexible peptide fragments with reducible disulfide bonds may liberate free spin label, complicating data analysis. To prevent such matters, all CW EPR experiments designed to examine HIV-1PR autoproteolysis were performed using MSL.
2. MATERIALS AND METHODS
2.1. Materials
The chemicals, reagents, and supplies were obtained from Fisher Scientific (Pittsburg, Pennsylvania), with a few noted exceptions. All reagents were used as received. pET23a DNA was purchased from Novagen (Gibbstown, New Jersey). HiTrap Q HP anion exchange column (5 ml), HiPrep 16/60 Sephacryl S-200 high-resolution size exclusion column, and 5 mL HiTrap desalting columns were purchased from GE Biosciences (formerly Amersham, Pittsburg, Pennsylvania). HIV-1 protease DNA was synthesized by and purchased from DNA 2.0 (Menlo Park, California). 4-maleimido-2,2,6,6-tetramethyl-1-piperidinyloxy (4-maleimido-TEMPO, MSL) was purchased from Sigma-Aldrich (St. Louis, MO). (1-oxyl2,2,5,5-tetramethyl-3-pyrroline-3-methyl) methane-thiosulfonate spin label (MTSL) was purchased from Toronto Research Chemicals, Inc (North York, Ontario, Canada). The QuikChange site-directed mutagenesis kit was purchased from Stratagene (La Jolla, California). 0.60 I.D. × 0.84 O.D. capillary tubes were purchased from Fiber Optic Center (New Bedford, Massachusetts). BL21*(DE3) pLysS Escherichia coli cells were purchased from Invitrogen (Carlsbad, California). Tipranavir was obtained via the AIDS Research and Reference Reagent Program, Division of AIDS, NIAID, NIH (Bethesda, Maryland) [19]. Note, sodium acetate will be abbreviated NaOAc and sodium chloride will be abbreviated NaCl.
2.2. Details of Constructs
Autoproteolysis of two HIV-1PR constructs were examined, namely subtype F and CRF01_A/E (a circulating recombinant form of subtype A and another distinct parental subtype, currently denoted E, though no pure form of subtype E has been identified). Additional experiments were performed with a subtype B construct called the penta-mutated protease (PMPR) and patient isolate constructs called V6 and MDR769. The Escherichia coli codon-optimized constructs were cloned into the pET-23a expression vector. Each of the subtype B, F, and CRF01_A/E constructs contained the three aforementioned stabilizing mutations. In addition, to allow for site-specific labeling, the naturally occurring cysteine residues at positions 67 and 95 were substituted to alanine. Site K55, a solvent exposed site in the flap, was chosen as the reporter site for spin labeling based upon results from saturation mutagenesis study that suggests that this site tolerates large amino acid side chains while retaining wild-type or near wild-type activity [20]. Protease samples used in EPR studies of the affect of ionic strength on protein aggregation were labeled with (1-oxyl-2,2,5,5-tetramethyl-Δ3-pyrroline3-methyl) methanethiosulfonate (MTSL). All other constructs, including those used in the study of autoproteolysis, were labeled with 4-Maleimido-TEMPO (MSL).
2.3. Protein Expression, Purification and Spin-Labeling
Purification and spin-labeling of HIV-1PR were carried out as described previously by Galiano et al., with one exception [16,21] . Because this purification scheme proceeds by anion exchange chromatography, the pH of the anion exchange buffer must be adjusted depending on the isoelectric point (pI) of the specific protein construct. The theoretical pIs of subtype B and subtype F, and CRF01_A/E constructs are 9.30, 9.20, and 9.48, respectively. The respective pH values of the buffer utilized for anion exchange chromatography are 8.9, 8.8, and 9.1. All HIV-1PR constructs were estimated to be > 95% pure by SDS-PAGE following purification. The spin-labeling reaction was carried out to completion in the dark at 4˚C and a pH of 6.9 for approximately 8 - 12 hours, and samples were concentrated to 150 µM in 2 mM NaOAc, pH 5.
2.4. Apo and Substrate-Bound Sample Preparation and Storage Conditions
10 µL MSL-labeled aliquots of apo (no substrate, ligand, or inhibitor bound) HIV-1PR subtype F and CRF01_A/E were prepared, in triplicate, in 2 mM NaOAc, pH 5.0 at 150 µM protein concentration and loaded into 0.60 I.D. × 0.84 O.D. capillary tubes. Protein concentration was measured by absorption at 280 nm with an extinction coefficient of 12490 M–1 cm–1 for each construct. The extinction coefficient was calculated using the program ProtParam at the EXPASY server (www.expasy.ch/tools). Both ends of the tubes were sealed and samples were stored at their respective temperatures (37˚C, 25˚C, or 4˚C) for a total of 100 days throughout EPR data collection, and were then analyzed via mass spectrometry. Samples of subtype F HIV-1PR containing 80 µM Tipranavir was prepared in a similar fashion, sealed in a capillary tube, and stored at 25˚C. To examine the effects of ionic strength, 100 µM MTSL-labeled subtype B HIV-1PR was prepared in 2 mM NaOAc with four different concentrations of NaCl (0 M, 50 mM, 500 mM, and 2.5 M) and loaded separately into 0.60 I.D. × 0.84 O.D. capillary tubes sealed at one end
2.5. CW EPR Measurements
CW EPR data were collected on a modified Bruker ER200 spectrometer with an ER023 M signal channel, an ER032 M field control unit, and a loop gap resonator (Medical Advances, Milwaukee, WI). All CW EPR data was collected at a controlled temperature of 25˚C. A quartz dewar (Wilmad-Labglass) surrounded the loop gap resonator for temperature control. Nitrogen gas was passed through a copper coil submerged in a recirculating water bath (Thermo Scientific) containing 40% ethylene glycol. Samples were removed from storage conditions and allowed to equilibrate in the loop gas resonator with quartz dewar for at least 15 minutes prior to sample collection. CW EPR spectra were collected at a frequency of 9.6 - 9.7 GHz with 1 Gauss modulation amplitude and 100 Gauss sweep width over 1024 points and a center field of approximately 3450 Gauss. The 100 Gauss sweep width was chosen as it was sufficient to encompass the EPR spectrum. Between 1 - 20 scans were collected and averaged.
2.6. CW EPR Data Analyses
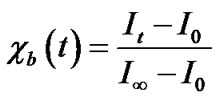
LabVIEW software was used for baseline correction and double integral area normalization, which was generously provided by Drs. Christian Altenbach and Wayne Hubbell (UCLA). Each derivative spectrum was integrated and then area-normalized to allow for easy comparison of various spectral parameters such as normalized peak intensities. Area-normalization is appropriate for this purpose only because the whole of the EPR spectrum is obtained in the 100 Gauss scans. Subsequent to area normalization, the peak-to-peak intensity (I) of the high field line was measured for each spectrum then converted to mole fraction degraded protein (cb) using
 (1)
(1)
and plotted with respect to time. For these calculations, the value of I at t = 100 days is presumed equal to I∞; and I0 was calculated from an EPR spectrum collected immediately after purification, spin-labeling, and sample preparation was complete.
Function fitting was done in Origin 8.0 with the 2 component ExpGro2 function of the form
 (2)
(2)
based upon the best fit to the experimental data. This type of fit provides the value t1, which is a degradation constant that represents the time at which the mole fraction of unfolded and/or degraded protein has increased by a factor of e. Using this type of fit requires the assumption that there are two pseudo-first order processes occurring in the autoproteolytic process, a fast component likely representative of the initial conversion of intact, properly folded protease to cleaved, unfolded protease, and a slow component likely representative of further degradation of the protease, likely non-specific systematic degradation of the N-terminal, as suggested by mass spectrometry. It should be mentioned that protein cleavage and unfolding likely occur together, however these processes are indistinguishable in the data.
2.7. Mass Spectrometry Measurements
After a total of 100 days of storage at 37˚C, apo HIV1PR samples were removed from the sealed capillary tubes used for EPR analysis and prepared for analysis via mass spectrometry (MS). Samples were diluted to 6 pmol/mL in 50% HPLC-grade acetonitrile in HPLCgrade water with 0.1% formic acid. Samples were introduced to the Bruker HCTultra Discovery ion trap mass spectrometer by direct infusion at a flow rate of 2 mL/min. The electrospray ionization source maintained a nebulizer gas pressure of 10 psi, a dry gas flow of 5 L/min, and a drying temperature of 250˚C. The positive mode mass range swept was 50 - 2000 m/z and datadependent collision-induced-dissociation (CID) fragmentation of peptides was collected. For peptides with a monoisotopic mass of less than ~3000 Da, CID spectra were collected and the fragmentation pattern analyzed de novo using MassXpert2 [22] and MS-Product (Protein Prospector, University of California San Francisco, California). The mass of the MSL spin labeled cysteine (C16H24N3O4S1; 251.14 m/z) was taken into consideration for all analyses. Further, the MS spectra were deconvolved for charge using DataAnalysis (Bruker Daltonics) with an abundance cutoff of 10%, a molecular weight tolerance of 0.01%, and an envelope cutoff of 75%. Spectra were also collected on a Bruker Ultraflex MALDI-TOF in positive reflector mode using a 337 nm continuous nitrogen flow laser. The protein samples (150 mM) were mixed with either 11 mg/mL dihydroxybenzoic acid (50% HPLC-grade acetonitrile and 0.1% trifluoroacetic acid in water) or a saturated solution of sinnapinic acid (60% HPLC-grade acetonitrile and 0.1% trifluoroacetic acid in water) at 1 : 8 and 1 : 16 v/v, respectively.
3. RESULTS AND DISCUSSION
3.1. Proteolysis-Stabilizing Mutations
Previous attempts to express and purify spin labeled active V6 HIV-1PR, which is a drug resistant patient isolate, without the three stabilizing mutations Q7K, L33I, and L63I, resulted in substantial autoproteolysis of the protein during the course of the purification. Figure 2 shows an SDS-PAGE gel of aliquots taken immediately after purification of stabilized subtype B, here called PMPR (penta-mutated protease with Q7K, L33I and L63I, C67A, and C95A substitutions), and unstabilized V6 [14,23] and MDR769 (multidrug resistant construct 769) [14,24-26] constructs (stabilizing mutations not incorporated due to the presence of naturally occurring polymorphisms at these sites). As a result, much structural work to date has been focused on protease constructs that have the Q7K, L33I, and L63I substitutions. As seen in the SDS-PAGE gel in Figure 2, stabilized subtype B (PMPR) has enhanced stabilization from
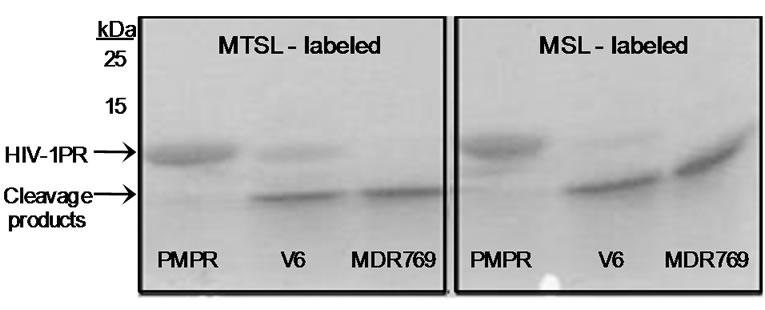
Figure 2. 16.5% tris-tricine SDS-PAGE gel of self-cleavage products for subtype B with stabilizing mutations Q7K, L33I and L63I (PMPR) labeled with either MTSL and MSL, and V6 and MDR769 (MDR) with no stabilizing mutations, labeled with either MTSL or MSL. Aliquots taken from freshly prepared stock solutions immediately after purification.
self-cleavage, while both V6 and MDR769 undergo rapid degradation during the course of the purification. The specific amino acid sequences of the self cleavage products of V6 and MDR769 were not pursued further.
3.2. Affect of Ionic Strength on Protein Aggregation
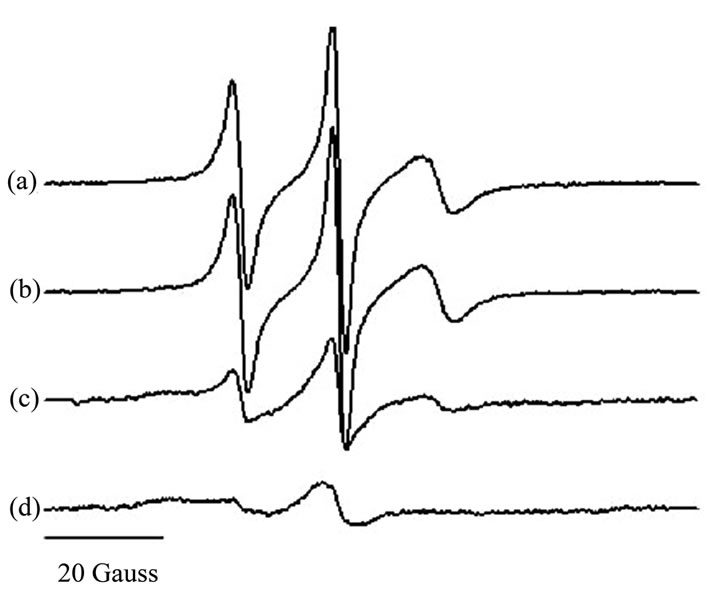
It is known that the enzymatic activity of HIV-1PR is dependent upon ionic strength, with greater activity observed in high salt concentrations near 2 M [27]. During the development of our protein purification scheme, it was observed that HIV-1 PR precipitation/aggregation was highly sensitive to salt concentration, and given that EPR spectra are acquired at protein concentrations in the micromolar range, we investigated the effects of ionic strength on the nitroxide EPR line shapes for 100 μM subtype B HIV-1 PR. Figure 3 shows area-normalized spectra for protease in 0, 50, 500, and 2500 mM NaCl.
 s
s
Figure 3. Area-normalized 100 Gauss Xband CW EPR spectra of 100 μM HIV-1PR in 2 mM NaOAc with (a) 0 mM NaCl; (b) 50 mM NaCl; (c) 500 mM NaCl; and (d) 2500 mM NaCl.
We find significant broadening of the EPR line shapes when the salt concentration is increased above 50 mM NaCl. The broadened spectrum is indicative of protein precipitation which, for salt concentrations above 500 mM, can be easily visualized in the capillary tube. Additionally, the possibility for dipolar broadening as a result of doubly-labeled protease has been eliminated by pulsed EPR distance measurements that indicated the distances between the labels exceed 25 Å and generally range from 28 - 42 Å depending on protease flap position [17]. These values are in general agreement with molecular dynamic simulations [28] and predictions from known crystal structures [29-31] . From these findings, buffers for all EPR experiments are prepared at low ionic strength, typically 2 mM NaOAc with no additional salts.
3.3. Monitoring Autoproteolysis by CW EPR Spectroscopy
HIV-1PR undergoes autoproteolysis, and this process can be readily detected in our EPR data. The growth of a sharp spectral line shape component in the high-field line, h(–1), of the EPR spectrum was detected over time. Figure 4 shows the area-normalized X-band 100 Gauss CW EPR spectra, collected at 25˚C, for subtype B HIV-1 protease labeled with MSL at positions K55C and K55C’ and stored at 25˚C, collected immediately after purification (black) and after 47 days storage at 25˚C (grey). The arrow shows the sharp component that develops in the high field line as a result of autoproteolysis. This sharper EPR signal can arise from either unfolded protein or the liberation of a spin-labeled peptide fragment. The nitroxide EPR line shape is highly sensitive to the overall correlation time of the spin label; contributions to correlation time come from three modes of motion, including global protein tumbling (τR), in-
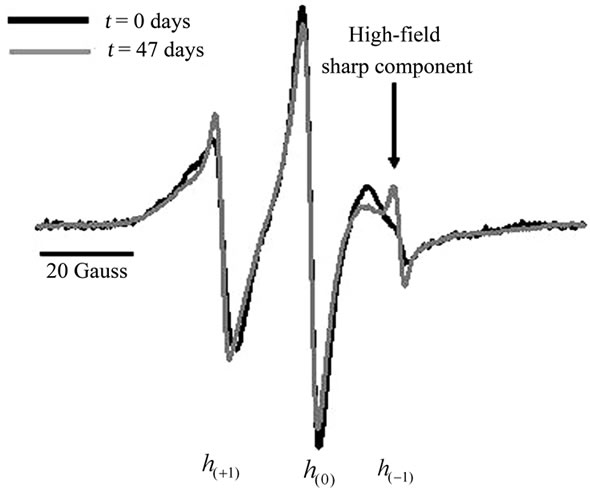
Figure 4. Overlay of day 1 (black) and day 47 (grey) area-normalized X-band 100 Gauss CW EPR spectra, collected at 25˚C, for subtype B HIV-1 protease labeled with MSL at position K55C and stored at 25˚C.
trinsic spin label mobility (τi), and backbone fluctuations (τB) [7-10] . Autoproteolysis will lead to protein unfolding and liberation of small peptide fragments, which subsequently alters the rate of global protein tumbling by unfolding the protein and reduces the local volume of tumbling of the specific site due to relaxation in protein secondary structure. The sum of these effects would likely lead to decreases in both τR and τB, significantly impacting the nitroxide spectral line shape. Because the spin label in HIV-1PR is located in the β-hairpin flap and has aqueous exposure, we do not anticipate that the unfolding will significantly alter τi. As the total correlation time of the nitroxide decreases, the derivative EPR spectrum will decrease in overall breadth and each of the resonance hyperfine transitions become sharper and increasingly narrow. Thus, the autoproteolysis leads to the development of the sharp component in the high field line.
Because of its prevalence in the United States and Europe, subtype B protease has been the most commonly studied construct of HIV-1PR. However, recent interests have turned to constructs prevalent elsewhere on the globe with the goals of understanding how subtype polymorphisms alter protease structure and function. Here we investigated the relative autoproteolytic stability of two non-B HIV-1PR constructs; namely, subtype F and CRF-01_A/E at solution concentrations pertinent for spectroscopic studies. Many experimental techniques, such as NMR, EPR and ITC, often require protease concentrations near 150 µM, thus it is important to examine the relative rates of autoproteolysis at that concentration and under varying storage conditions. Figure 5 shows overlays of area-normalized, 100 Gauss X-Band CW EPR spectra collected at 25˚C immediately after
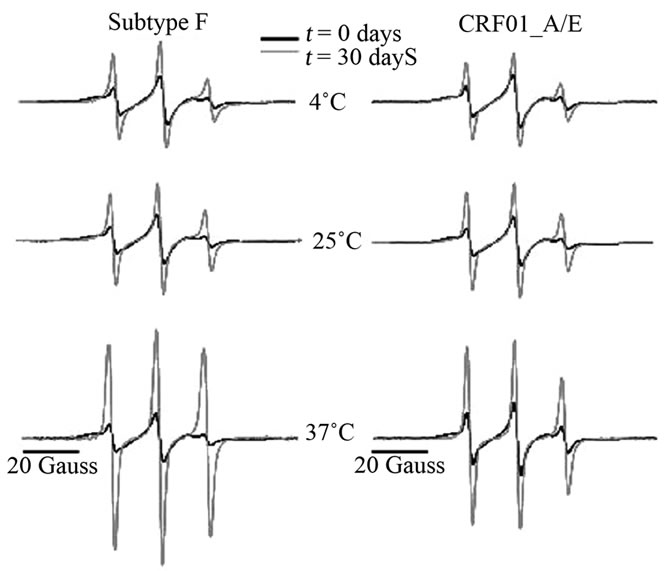
Figure 5. Overlay of day 1 (black) and day 30 (grey) area-normalized, 100 Gauss X-Band CW EPR spectra, collected at 25˚C, from subtype F and CRF01_A/E protease samples stored at 37˚C, 25˚C, and 4˚C.
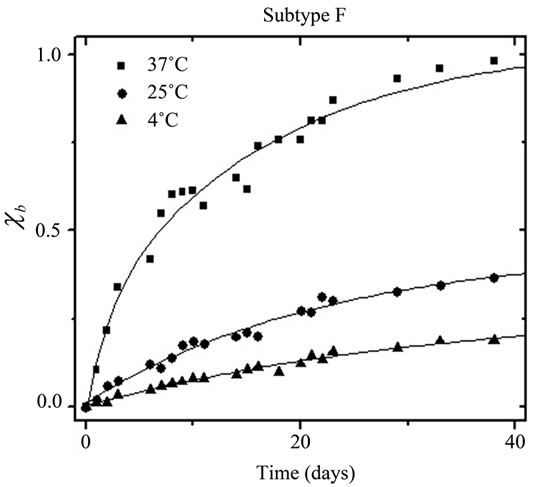
purification and spin-labeling (black) and after 30 days (grey) for subtype F and CRF01_A/E at all three storage conditions (37˚C, 25˚C, or 4˚C). Full data sets showing all spectra collected are provided in supporting information. In all cases, the normalized intensity of h(–1) is observed to increase over time, indicating protease deg radation and unfolding. Additionally, the normalized intensity of h(–1) increased dramatically with increasing storage temperature, which is not surprising and indicates a strongly temperature-dependent autoproteolytic process. Using Eq.1, the spectral intensities of h(–1) were converted to mole percent of proteolysed, unfolded protease (cb) and plotted in Figure 6 as a function of time.
The solid lines in Figure 6 are fits to the data with an exponential growth function containing two first order processes (Eq.2). The degradation constant t1 (in days) was extracted for each sample as a measure of the rate of conversion of intact, properly folded protease to unfolded/cleaved protease. For subtype F, the degradation constants t1 are 12.1 ± 1.2, 24 ± 3 , and 34 ± 6 days, for samples stored at 37˚C, 25˚C, and 4˚C; respectively. For CRF01_A/E, the degradation constants t1 are 8.2 ± 0.9,
 (a)
(a)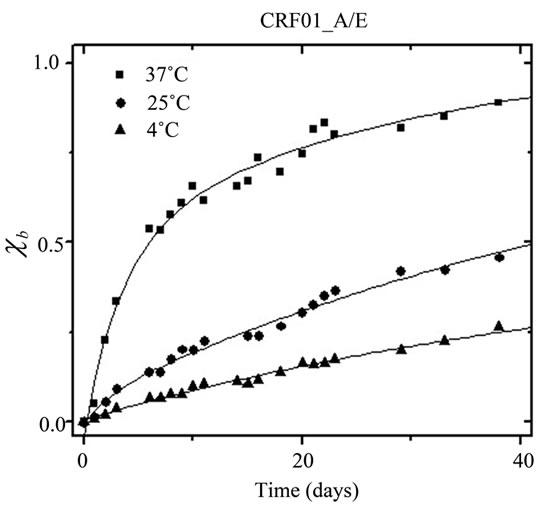 (b)
(b)
Figure 6. Fraction degraded protein (cb) vs time for (a) HIV-1 Protease subtype F and (b) CRF01_A/E undergoing self-proteolysis.
38 ± 7, and 54 ± 10 days, for samples stored at 4˚C, 25˚C, and 37˚C, respectively. The values of t1 generally indicate that autoproteolysis in the subtype F protease construct proceeded more quickly than did the autoproteolysis of the CRF01_A/E protease construct. The presence of an inhibitor, which was added immediately upon completion of protein purification and prior to refolding, impeded the autoproteolytic activity of the samples, as evidenced by almost no change in the intensity of h(–1) over the course of the 30 days. Figure 7 shows the area-normalized 100 Gauss X-Band EPR spectra of subtype F HIV-1PR in the presence of 80 µM Tipranavir, an FDA-approved protease inhibitor, collected immediately after purification and spin-labeling (black) and after 30 days of storage in a sealed capillary at 25˚C (grey); all spectra are shown in supporting information. This demonstrates, via SDSL and CW EPR, that HIV-1PR can be stabilized against autoproteolysis via the timely addition of inhibitor, even at the high concentrations necessary for spectroscopic studies. This type of preparation is suitable for many types of experiments involving HIV-1; however, addition of inhibitor is generally irreversible so experiments requiring apo protease must prepare the sample without addition of inhibitor.
3.4. Sites of Autocatalytic Cleavage in HIV-1 Subtype F and CRF01_A/E Protease Constructs
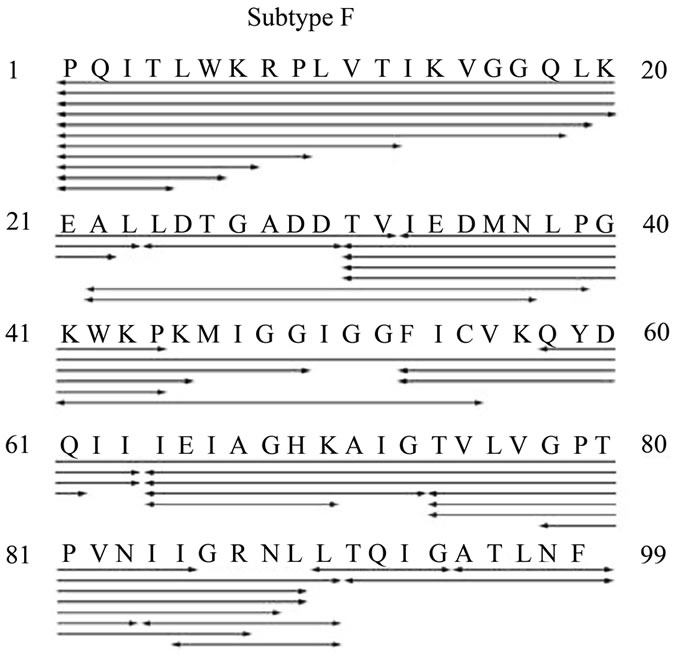
MALDI-TOF and charge deconvolved electrospray mass spectrometry of the subtype F and CRF01_A/E HIV-1PR constructs clearly indicated that both proteins have complete MSL spin labeling and were of the predicted monoisotopic and average masses. Cleavage maps of HIV-1PR subtype F and CRF01_A/E as determined in combination by MS/MS, MALDI, and charge deconvolution, are shown in Figure 8. Many peptide fragments
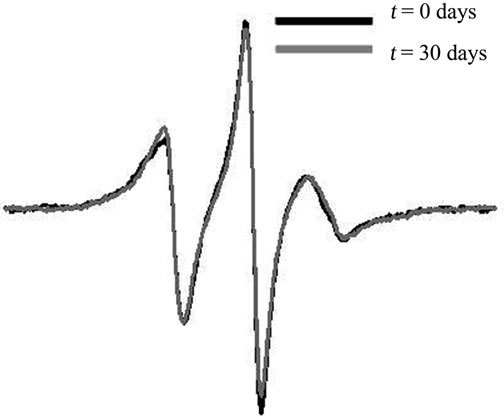
Figure 7. Area-normalized 100 Gauss
X-Band EPR spectra of HIV-1PR subtype Fin the presence of the FDA-approved in hibitor Tipranavir, immediately after purifycation and spin-labeling, and after 30 days of storage at room temperature.
 (a)
(a)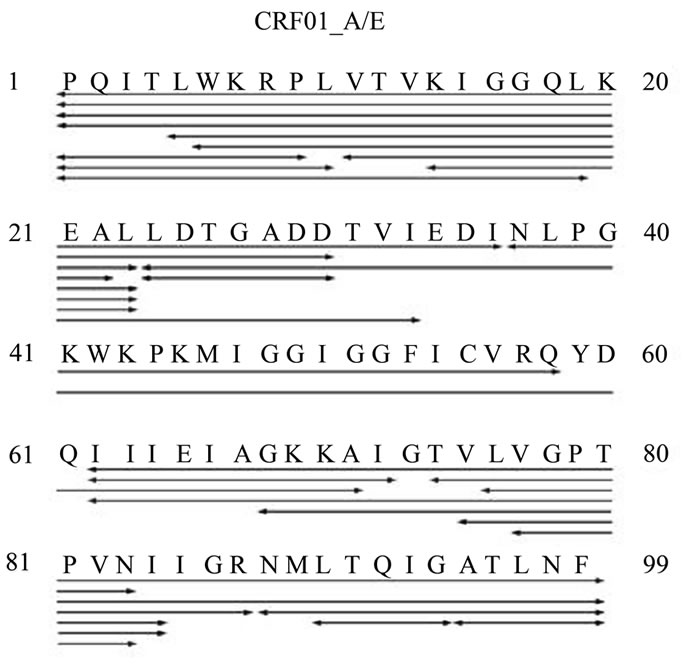 (b)
(b)
Figure 8. Cleavage maps of HIV-1PR subtype F and CRF01_A/E as determined in combination by MS/MS, MALDI, and charge deconvolution.
were observed in both samples, but the subtype F HIV-1PR sample contained more autoproteolytic peptides.
In order to identify the specific sites of autoproteolysis, electrospray mass spectrometry was used to sequence peptide fragments via collision-induced dissociation, more commonly known as tandem MS. Because of the incorporation of the MSL label at position K55C, the modification was included in the denovo analysis. The substitution of amino acids between the subtypes clearly influences the cleavage sites. For subtype F, four peptides which contain the MSL label were identified conclusively by tandem MS (peptide residues 31 - 63, 41 - 55, 53 - 61 and 53 - 63); only one peptide from the CRF01_A/E autoproteolysis sample was identified by MS sequencing (peptide residues 37 - 58), but another was identified by charge deconvolution of the multiply-charged isotopic envelope (peptide residues 24 - 71). In both samples, the N-terminus is sensitive to systematic degradation, but there are also specific cleavage sites within the proteins. The most obvious sites of autoproteolysis for subtype F are after L23, D30, G52, I63, and T73. The cleavages after L23 and D30 are conserved in CRF01_A/E, but a new proteolytic site appeared after Q61.
4. CONCLUSIONS
The CW EPR methodology has proven to be very useful in monitoring the slow autoproteolysis or degradation of a protein in a facile, real-time, non-consuming fashion. Here, autoproteolysis of active subtype F and CRF01_A/E HIV-1PR constructs was examined, with the secondary goal of determining optimal conditions for preparation and storage of active, spin-labeled HIV-1PR constructs, thereby minimizing the autoproteolytic process. From this work, it seems likely that SDSL EPR, or other spectroscopic analyses, could be successfully applied to active HIV-1PR if the protein is purified quickly and efficiently and the addition of inhibitor is prompt and timely. By evaluating the peak-to-peak intensity I of the high-field line h(–1) of the EPR spectrum, plots of cb with a two-component exponential growth function were generated, providing a term that is likely proportional to the amount of proteolyzed protein in the sample. In addition, mass spectrometry experiments revealed that the N-termini of subtype F and CRF01_A/E HIV-1PR are sensitive to degradation. Additionally, there are specific cleavage sites within the proteins that vary between constructs. Sites of auto-proteolysis for subtype F follow L23, D30, G52, I63, and T73. The cleavages after L23 and D30 are conserved in CRF01_A/E, with an additional proteolytic site following Q61.
5. ACKNOWLEDGEMENTS
This work was supported by NSF MBC-0746533 to GEF, AHA (pre-doctoral fellowships to JLK and LG), the UF Center for AIDS Research and NHMFL-IHRP.
REFERENCES
- Ashorn, P., McQuade, T.J., Thaisrivongs, S., Tomasselli, A.G., Tarpley, W.G. and Moss, B. (1990) An inhibitor of the protease blocks maturation of human and simian immunodeficiency viruses and spread of infection. Proceedings of the National Academy of Sciences USA, 87, 7472-7476. doi:10.1073/pnas.87.19.7472
- Hui, J.O., Tomasselli, A.G., Reardon, I.M., Lull, J.M., Brunner, D.P., Tomich, C.S. and Heinrikson, R.L. (1993) Large scale purification and refolding of HIV-1 protease from Escherichia coli inclusion bodies. Journal of Protein Chemistry, 12, 323-327.doi:10.1007/BF01028194
- Rosé, J.R., Salto, R. and Craik, S. (1993) Regulation of autoproteolysis of the HIV-1 and HIV-2 proteases with engineered amino acid substitutions. Journal of Biological Chemistry, 268, 11939-11945.
- Strickler, J.E., Gorniak, J., Dayton, B., Meek, T., Moore, M., Magaard, V., Malinowski, J. and Debouck, C. (1989) Characterization and autoprocessing of precursor and mature forms of human immunodeficiency virus type 1 (HIV-1) protease purified from Escherischia coli. Proteins: Structure, Function, and Bioinformatics, 6, 139-154.
- Columbus, L., Kálai, T., Jekö, J., Hideg, K. and Hubbell, W.L. (2001) Molecular motion of spin labeled side chains in alpha-helices: Analysis by variation of side chain structure. Biochemistry, 40, 3828-3846.doi:10.1021/bi002645h
- Columbus, L. and Hubbell, W.L. (2002) A new spin on protein dynamics. Trends in Biochemical Sciences, 27, 288-295. doi:10.1016/S0968-0004(02)02095-9
- Fanucci, G.E. and Cafiso, D.S. (2006) Recent advances and applications of site-directed spin labeling. Current Opinions in Structural Biology, 16, 644-653.doi:10.1016/j.sbi.2006.08.008
- Hubbell, W.L., Cafiso, D.S. and Altenbach, C. (2000) Identifying conformational changes with site-directed spin labeling. Nature Structural Biology, 7, 735-739. doi:10.1038/78956
- Hubbell, W.L., Gross, A., Langen, R. and Lietzow, M.A. (1998) Recent advances in site-directed spin labeling of proteins. Current Opinion in Structural Biology, 8, 649-656. doi:10.1016/S0959-440X(98)80158-9
- McHaourab, H.S., Lietzow, M.A., Hideg, K. and Hubbell, W.L. (1996) Motion of spin-labeled side chains in T4 lysozyme. Correlation with protein structure and dynamics. Biochemistry, 35, 7692-7704.doi:10.1021/bi960482k
- Noble, R. (2009) HIV types, subtypes, groups, and strains. 2010, AVERT.
- Kantor, R., Shafer, R.W. and Katzenstein, D. (2005) The HIV-1 non-subtype B Workgroup: Aan international collaboration for the collection and analysis of HIV-1 non-subtype B data. Journal of the International AIDS Society, 7, 1-3.
- Wlodawer, A. and Vondrasek, J. (1998) Inhibitors of HIV-1 protease: A major success of structure-assisted drug design. Annual Review of Biophysics and Biomolecular Structure, 27, 249-284.doi:10.1146/annurev.biophys.27.1.249
- Kear, J.L., Blackburn, M.E., Veloro, A.M., Dunn, B.M. and Fanucci, G.E. (2009) Subtype polymorphisms among HIV-1 protease variants confer altered flap conformations and flexibility. Journal of the American Chemical Society, 131, 14650-14651.doi:10.1021/ja907088a
- Galiano, L., Bonora, M. and Fanucci, G.E. (2007) Inter-flap distances in HIV-1 protease determined by pulsed EPR measurements. Journal of the American Chemical Society, 129, 11004-11005. doi:10.1021/ja073684k
- Galiano, L., Ding, F., Veloro, A.M., Blackburn, M.E., Simmerling, C. and Fanucci, G.E. (2009) Drug pressure selected mutations in HIV-1 protease alter flap conformations. Journal of the American Chemical Society, 131, 430-431. doi:10.1021/ja807531v
- Blackburn, M.E., Veloro, A.M. and Fanucci, G.E. (2009) Monitoring inhibitor induced conformational population shifts in HIV-1 protease by pulsed EPR spectroscopy. Biochemistry, 48, 8765-8767. doi:10.1021/bi901201q
- Mildner, A.M., Rothrock, D.J., Leone, J.W., Bannow, C.A., Lull, J.M., Reardon, I.M., Sarcich, J.L., Howe, J.W., Tomich, C.C., Smith, C.W., Heinrikson, R.L. and Tomasselli, A.G. (1994) The HIV-1 protease as enzyme and substrate: Mutagenesis of autolysis sites and generation of a stable mutant with retained kinetic properties. Biochemistry, 33, 9405-9413. doi:10.1021/bi00198a005
- National Institute of Health.
- Shao, W., Everitt, L., Manchester, M., Loeb, D.D., Hutchison, C.A., III and Swanstrom, R. (1997) Sequence requirements of the HIV-1 protease flap region determined by saturation mutagenesis and kinetic analysis of flap mutants. Proceedings of the National Academy of Sciences USA, 94, 2243-2248. doi:10.1073/pnas.94.6.2243
- Galiano, L., Blackburn, M.E., Veloro, A.M., Bonora, M. and Fanucci, G.E. (2009) Solute effects on spin labels at an aqueous-exposed site in the flap region of HIV-1 protease. Journal of Physical Chemistry B, 113, 1673-1680. doi:10.1021/jp8057788
- Rusconi, F. (2009) MassXpert 2: A cross-platform software environment for polymer chemistry modelling and simulation/analysis of mass spectrometric data. Bioinformatics, 25, 2741-2742.doi:10.1093/bioinformatics/btp504
- Clemente, J.C., Moose, R.E., Hemrajani, R., Whitford, L.R., Govindasamy, L., Reutzel, R., McKenna, R., Agbandje-McKenna, M., Goodenow, M.M. and Dunn, B.M. (2004) Comparing the accumulation of activeand nonactive-site mutations in the HIV-1 protease. Biochemistry, 43, 12141-12151. doi:10.1021/bi049459m
- Logsdon, B.C., Vickrey, J.F., Martin,, Proteasa, P.G., Koepke, J.I., Terlecky, S.R., Wawrzak, Z., Winters, M.A., Merigan, T.C. and Kovari, L.C. (2004) Crystal structures of a multidrug-resistant human immunodeficiency virus type 1 protease reveal an expanded active-site cavity. Journal of Virology, 78, 3123-3132.doi:10.1128/JVI.78.6.3123-3132.2004
- Layten, M., Hornak, V. and Simmerling, C. (2006) The open structure of a multi-drug-resistant HIV-1 protease is stabilized by crystal packing contacts. Journal of the American Chemical Society, 128, 13360-13361.doi:10.1021/ja065133k
- Martin, P., Vickrey, J.F., Proteasa, G., Jimenez, Y.L., Wawrzak, Z., Winters, M.A., Merigan, T.C. and Kovari, L.C. (2005) Wide-open 1.3 Å structure of a multidrugresistant HIV-1 protease as a drug target. Structure, 13, 1887-1895. doi:10.1016/j.str.2005.11.005
- Szeltner, Z. and Polgar, L. (1996) Conformational stability and catalytic activity of HIV-1 protease are both enhanced at high salt concentration. Journal of Biological Chemistry, 271, 5458-5463.
- Hornak, V., Okur, A., Rizzo, R.C. and Simmerling, C. (2006) HIV-1 protease flaps spontaneously open and reclose in molecular dynamics simulations. Proceedings of the National Academy of Sciences USA, 103, 915-920.doi:10.1073/pnas.0508452103
- Bandaranayake, R.M., Prabu-Jeyabalan, M., Kakizawa, J., Sugiura, W. and Schiffer, C.A. (2008) Structural analysis of human immunodeficiency virus type 1 CRF01_AE protease in complex with the substrate p1-p6. Journal of Virology, 82, 6762-6766.doi:10.1128/JVI.00018-08
- Robbins, A.H., Coman, R.M., Bracho-Sanchez, E., Fernandez, M.A., Gilliland, C.T., Li, M., AgbandjeMcKenna, M., Wlodawer, A., Dunn, B.M. and McKenna, R. (2010) Structure of the unbound form of HIV-1 subtype A protease: Comparison with unbound forms of proteases from other HIV subtypes. Acta Crystallographica Section D: Biological Crystallography, D66, 233-242. doi:10.1107/S0907444909054298
- Coman, R.M., Robbins, A.H., Goodenow, M.M., Dunn, B.M. and McKenna, R. (2008) High-resolution structure of unbound human immunodeficiency virus 1 subtype C protease: Implications of flap dynamics and drug resistance. Acta Crystallographica Section D: Biological Crystallography, D64, 754-763.doi:10.1107/S090744490801278X