Journal of Intelligent Learning Systems and Applications
Vol.5 No.4(2013), Article ID:39443,6 pages DOI:10.4236/jilsa.2013.54025
Study on the Real-Time Security Evaluation for the Train Service Status Using Safety Region Estimation
![]()
1State Key Laboratory of Rail Traffic Control and Safety, School of Traffic and Transportation, Beijing Jiaotong University, Beijing, China; 2Guangzhou Metro Corporation, Guangzhou, China.
Email: zhangyuan111@gmail.com
Copyright © 2013 Guiling Liao et al. This is an open access article distributed under the Creative Commons Attribution License, which permits unrestricted use, distribution, and reproduction in any medium, provided the original work is properly cited.
Received May 15th, 2013; revised September 1st, 2013; accepted October 2nd, 2013
Keywords: Safety region; Service status of rail vehicles; Security assessment; Lyapunov exponent; Data-driven
ABSTRACT
For the important issues of security service of rail vehicles, the online quantitative security assessment method of the service status of rail vehicles and the key equipments is urgently needed, so the method based on safety region was proposed in the paper. At first, the formal description and definition of the safety region were given for railway engineering practice. And for the research objects which their models were known, the safety region estimation method of system stability analysis based on Lyapunov exponent was proposed; and for the research objects which their models were unknown, the data-driven safety region estimation method was presented. The safety region boundary equations of different objects can be obtained by these two different approaches. At last, by real-time analysis of the location relationship and generalized distance between the equipment service status point and safety region boundary, the online safety assessment model of key equipments can be established. This method can provide a theoretical basis for online safety evaluation of trains operation; furthermore, it can provide support for real-time monitoring, early warning and systematic maintenance of rail vehicles based on the idea of active security.
1. Introduction
Rail transit vehicles, whose real-time status of security service will affect the safety and efficiency of the entire rail transport system directly, are primary tools and direct carriers for the rail transportation. With the rapid development of rail transit construction in China, there is a large increase of rail transit vehicles. At present, the quantity of railway passenger car, railway freight car, motor train set and subway vehicle has reached 52,000, 620,000, 500, and 5000 respectively. It is estimated that there will be 4000 high speed EMUs by 2020 and 20,000 urban rail transit vehicles by 2015. Therefore, measures should be immediately taken to analyze the security service status of rail vehicles timely and quantitatively.
In recent years, rail vehicles have the merit of higher speed, larger region span, vaster capacity and shorter interval. Meanwhile, stronger coupling relationship and higher use frequency exist among different parts of trains than before. Naturally, partial equipments’ faults will result in faults of other equipments and finally obstruct the whole vehicle, causing enormous economic loss and negative social influences.
Furthermore, in general, the service status is monitored and overhauled based on the off-line and regular checking, and it is evaluated afterward through the qualitative and causality analysis methods for rail vehicles. However, none of those ways can properly meet demand of the quantitative analysis and evaluation for the real-time security service status. Accidents cannot be avoided in essence. Thus, online system, which is capable of being used for monitoring and warning, and the corresponding state-overhaul mode, should be established. With the development of online detection technique of rail vehicles, 5T system for security and early warning has been implemented gradually. Also, for urban rail vehicles, online fault diagnosis and early warning system have already been in run on Shanghai Subway Line 2. However, due to nonlinear, uncertain disturbances and massive detection data, these traditional evaluation methods cannot meet the need of dynamic analysis and assessment, which will impede the online detection and warning and also the state-overhaul mode. Therefore, a breakthrough is urgently needed in this field.
Safety Region (SR) is a quantitative model used for describing the safe and stable running region for the whole system. This model is applied to obtain the boundary of the safe and stable running region. What’s more, according to the relative relation between safety region boundary and the running point, this model is capable of offering the information of safety margin and optimal control under different conditions. Currently, the Safety Region theory has been studied deeply in the field of the complex power systems [1,2] and further introduced to the field of rail transit [3,4]. Similarly, for rail vehicles and equipments, the pluralistic, massive and nonlinear real-time service status data can be quantified to analyze and evaluate safety status through the Safety Region. This theory provides a new method for the development of online detection, early warning and stateoverhaul mode of rail vehicles.
This paper briefly introduces the research status of the Safety Region theory and method, gives the basic description of the safety region in railway transportation and puts forward basic framework and general idea for safety assessment of rail vehicles service status. In addition, the two specific application methods including models and data driven are proposed. This lays the foundation for further study of online safety assessment of rail vehicles service status by the Safety Region.
2. Research Situation
For the complex system, the previous work of safety region analysis primarily focused on areas of communication information, electrical system, and so on. From the view of information security, the application of safety region has expanded to network control, highway traffic, e-government, etc. [5-8]. In addition, American scholars have put forward safety region methods to improve the security and stability of power system for the security of electrical system since the 1980s [9]. In China, the dynamic safety region started to be studied for electrical system security from 1990s [10]. Recently, the practicability was taken into account more extensively [11-14]. Yu Y.X. presented three kinds of practical security regions of power system [11]. Among them, the first one is practical dynamic security region (PDSR) in power injection space of pre-fault power system to guarantee transient stability, the second one is practical security region to guarantee static voltage stability in cut-set power flow space (CVSR) and the third one is practical security region to guarantee small disturbance stability related to Hopf bifurcation (PHSR) in power injection space. Makarov Y. and Du P. et al. gave the framework of safety region identification method and further evaluate safety situation in various operation states [12].
In the area of rail transportation, the author [3,4,15] proposed the safety region estimation method, gave the formal description and the complete definition of the safety region for the first time and finally analyzed the influence of rail irregularity by this method for the rail vehicles’ safe running. Furthermore, Jin X.S. and Ling L. et al. [16] established a derailment model based on vehicle-track coupling dynamics and further obtained the safety operation boundaries of high speed trains by using different derailment criteria and dynamics simulation results in severe environments.
As mentioned above, researches on safety region have made some achievements. However, in the rail transportation, similar research results are rarely seen except the complete framework of safety region estimation method proposed by the author. In fact, existing references still determine security region by the threshold of safety operation limit. In essence, they still adopt the method of quantitative analysis using threshold with single variable.
3. Basic Description of Safety Region
For a specified study object, safety region is a region used to determine whether the running status of study object is safe in the space decided by safety related variables. Region description is essentially region boundary identification. Mathematically, safety region boundary can be described by a safety region boundary equation, where
where  denote safety related variable, n is variable numbers, g(X) is output variable characterizing safety state of running, and c is a constant of safety threshold. If n = 3, safety region boundary is curved surface in three-dimensional space; if n = 2, safety region boundary is a curve in two-dimensional space; if n = 1, the safety region boundary equation will be univariate threshold. The region of g(X) > c (assume the region below curved surface determined by a safety region boundary equation) is defined as safety region; conversely, the region of g(X) > c is defined as non-safety region. According to whether the object’s current operating status point lies within safety region, the object’s safety status can be judged. If the point is within safety region, the object is safe; if the point is outside the safety region boundary, there may be risks.
In addition, as shown in Figure 1, the safety degree can be described by the distance between the object’s real-time operating status point and the safety region boundary. Furthermore, quantitative security margin can be given to take the optimal prevention and control measures and ensure further running safety.
4. Estimation of Safety Region for Rail Vehicles’ Service Condition
4.1. General Thinking
In view of the complicated rail vehicles equipped with a number of equipments, safety region research can be divided into three layers in accordance with the structure of objects in Figure 2. The top is system layer namely the whole rail vehicles; then unit layer includes several larger units of rail vehicles, such as running system, power system and brake system and so on; the bottom is device layer, includes key equipments of unit layer, wheel sets in running system, for example. Different objects of various layer can be studied separately, meanwhile, safety region estimation about the top layer can combine the lower’s results.
For a specified study object, safety assessment of service state based on safety region includes two steps as follows.
1) Determine safety related variables, estimate safety region boundary and divide safety region and non-safety region of service state.
2) Judge whether the running point lies within safety region based on the service state data and the safety region boundary equation. If yes, then the distance between the real-time running point and the safety region boundary should be calculated to gain security margin; if not, alarm information should be given. Finally, give quantitative evaluation results.
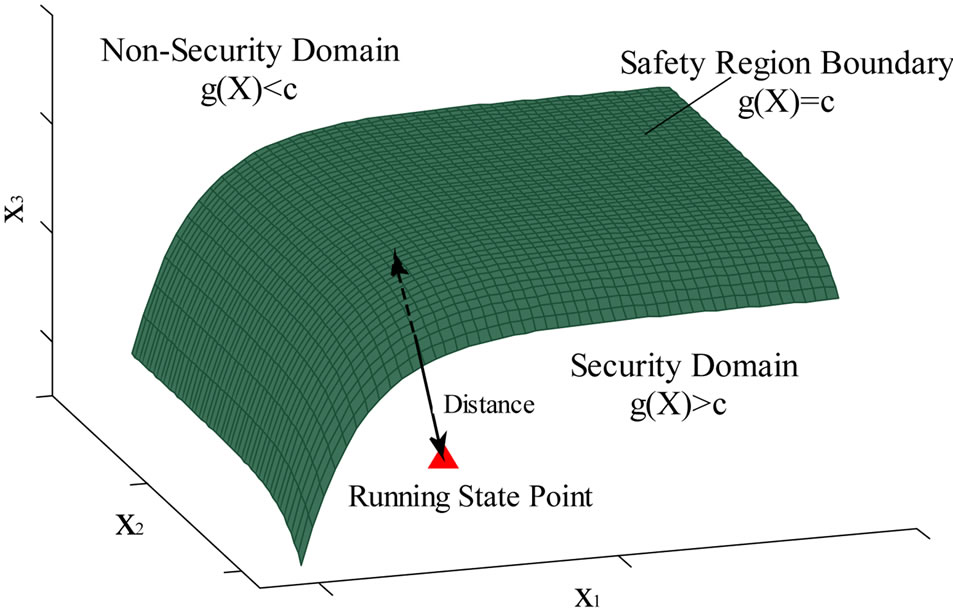
Figure 1. Schematic diagram of safety region.
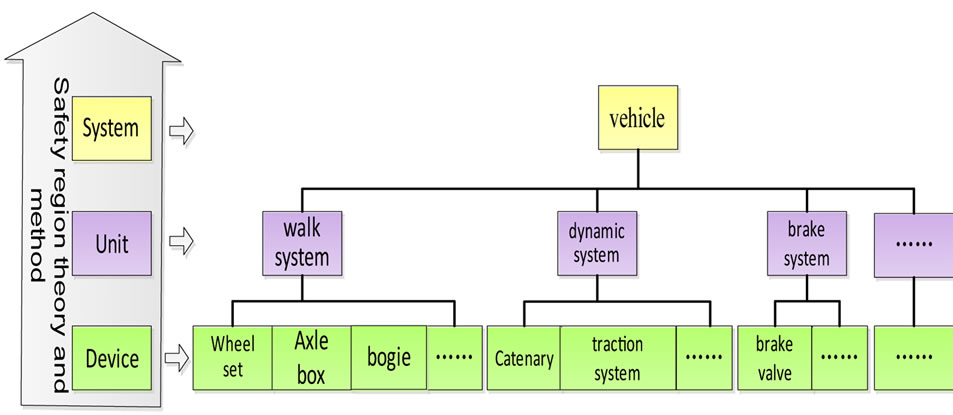
Figure 2. Safety region objects of railway vehicles.
4.2. Specific Method
The safety region estimation is the key content of safety assessment of service condition. In this paper, two schemes concerning safety region estimation are proposed on the basis of the object and the availability of its model. For the object with known or easily acquired models, system stability discrimination combining Lyapunov exponents can be used; for the object with unknown or hard acquired models, data classification methods combining Support Vector Machine (SVM) can be used.
4.2.1. Safety Region Estimation Methods Using System Stability Discrimination Based on Lyapunov Exponents
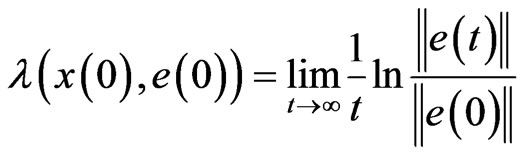
As the average exponential rate used for depicting divergence and convergence between any neighboring phase pathway in the power system, Lyapunov exponents can be used to describe stability of equilibrium points, periodic orbits and quasi-periodic motion and judge chaotic system quantitatively. Dynamic chaos can be judged visually by whether the maximum Lyapunov exponents are greater than zero. Different objects have different running states and Lyapunov exponents. Thus dynamic chaos can be distinguished with Lyapunov exponents and then identification approaches of safety operation state are put forward [17-22]. At present, the system stability judgement via maximum Lyapunov exponents is widely used [23,24]. Lyapunov exponents’ calculation can be classified into two classes. One uses the phase pathway, phase area and phase volume including the GRS and the WOLF method [25-28]; the other one takes advantage of the tangent vector of phase space including the neural networks method [29] and the wavelet transformation method [30].
In this paper, for the safety region estimation methods using system stability discrimination based on Lyapunov exponents, the whole procedures are as follows.
1) Establish the dynamic model Confirm the main objects and put up the dynamic model with consideration of railway vehicle and various key safety equipments.
2) Initialize parameters of dynamic equation Accordingly, collect parameter values from normal and failure online and further initialize the parameters acquisition for various servicing state.
3) Calculate Lyapunov exponents Solve approximate solutions of dynamic equations, tackle Jacobi matrix with QR decomposition and figure out Lyapunov exponent spectra and fractal dimension. For example, under the consideration of differential equations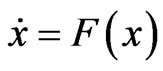 ,
, 
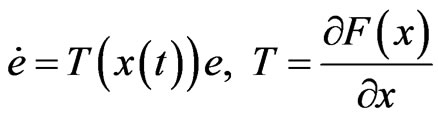 (1)
(1)
where T is Jacobi matrix of F. Furthermore, solution of equation (1) can be described as 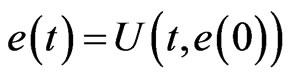 where
where 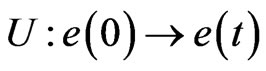 is linear operational mapping. Asymptotic behaviour of this mapping can be depicted as follows with exponents.
 (2)
(2)
therefore Lyapunov exponents of objects can be described as the mean values of the above repeated process.
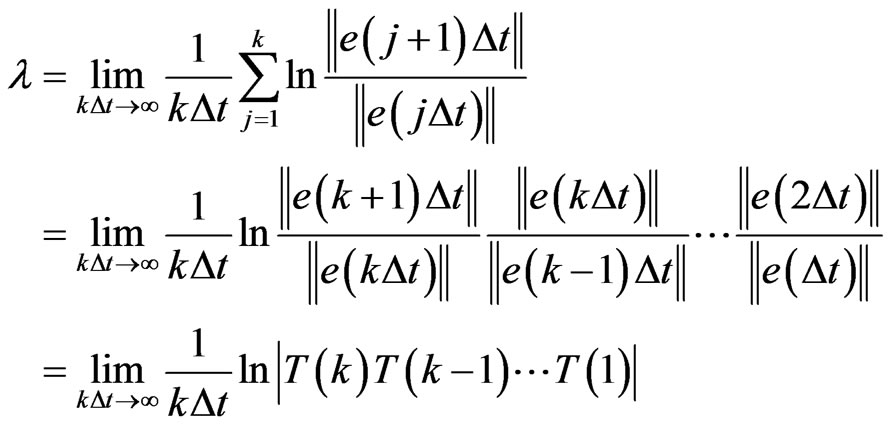 (3)
(3)
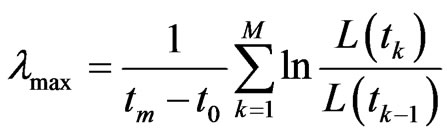
The maximum Lyapunov exponents can be obtained by the following equations.
 (4)
(4)
where L(tk) denotes the distance between two closest points at the moment of tk and M is total calculation steps.
If objects are in operation and maximum Lyapunov exponents equal zero, see safety region boundary equation.
4.2.2. Safety Region Estimation Methods Based on Data Classification Using SVM
For the research object with unknown or hard acquired models, model-based technique is no more applicable. However, data-driven safety region estimation method can be adopted to get state data. The most direct approach to acquire best classification line or surface namely the safety region boundary to be solved is to classify multi-dimensional state data of safety and nonsafety. In this paper, data classification based on SVM and its optimization is used to realize the data-driven safety region estimation. More than anything, the data of two-category and multi-category classification have the feature of small-sample, nonlinear and high-dimensional. SVM can solve this issue well [31-33]. Moreover, classification performance of SVM can be improved by combining multiple intelligent theory including hidden Markov chain [34], genetic algorithm [35], fuzzy [36,37] and DS evidence theory [38].
In this paper, for safety region estimation methods based on data classification using SVM, the whole procedures are as follows.
1) Determine safety related variables Select easily detected or acquired variables which have greater influence on safe operation in view of different objects of key equipment of rail vehicles.
2) Obtain status dataset From the prior step status dataset in normal and failure can be gained in three different ways. First, collect real-time running data in various work condition on site. Second, establish the dynamic model or simulation model with the help of dynamics simulation software including Simpack, Adams/Rail and Simulink and further collect required simulation data. Finally, for supporting this study, go through all sharing data and material offered by the related research institution.
3) Status data set preprocessing According to different structure and attribute characteristics of specific dataset, the techniques of low-pass filter, moving average, wavelet de-noising and Hilbert transform can be adopted to eliminate singularity, reduce noise and decrease interference.
4) Safety region boundary estimation Methods are adopted, including the intelligent data classification method based on SVM and intelligent optimization algorithm based on genetic algorithm and fuzzy theory. Then mark dataset in the state of normal and failure and train SVM classifier. Finally, the best classification face equation of binary classification is derived. That is also the safety region boundary equation so that safety region boundary estimation is realized.
4.3. The Overall Framework of This Method
Synthesizing the content in Section 3.1 and 3.2, the general implementation scheme of service state safety evaluation of rail vehicles based on safety region estimation has been shown in Figure 3. First, concept, connotation and formal description should be given. Second, according to the object with known or unknown models, respectively take use of safety region estimation of Lyapunov exponents based system stability analysis and SVM based data classification and further get safety region boundary equation. At last, give quantitative safety assessment results on basis of safety status judgment and safety margin calculation using real-time status and safety region boundary.
5. Conclusions
Before guaranteeing safety operation of rail transit vehicle, this paper first applied the fundamental theory and methods of safety region estimation to operation safety assessment, and analysis of rail vehicle and key equipment. On the basis of the analysis and summary of the related research status at home and abroad in different areas, basic concept and formal description of safety region were given in railway transportation and the overall
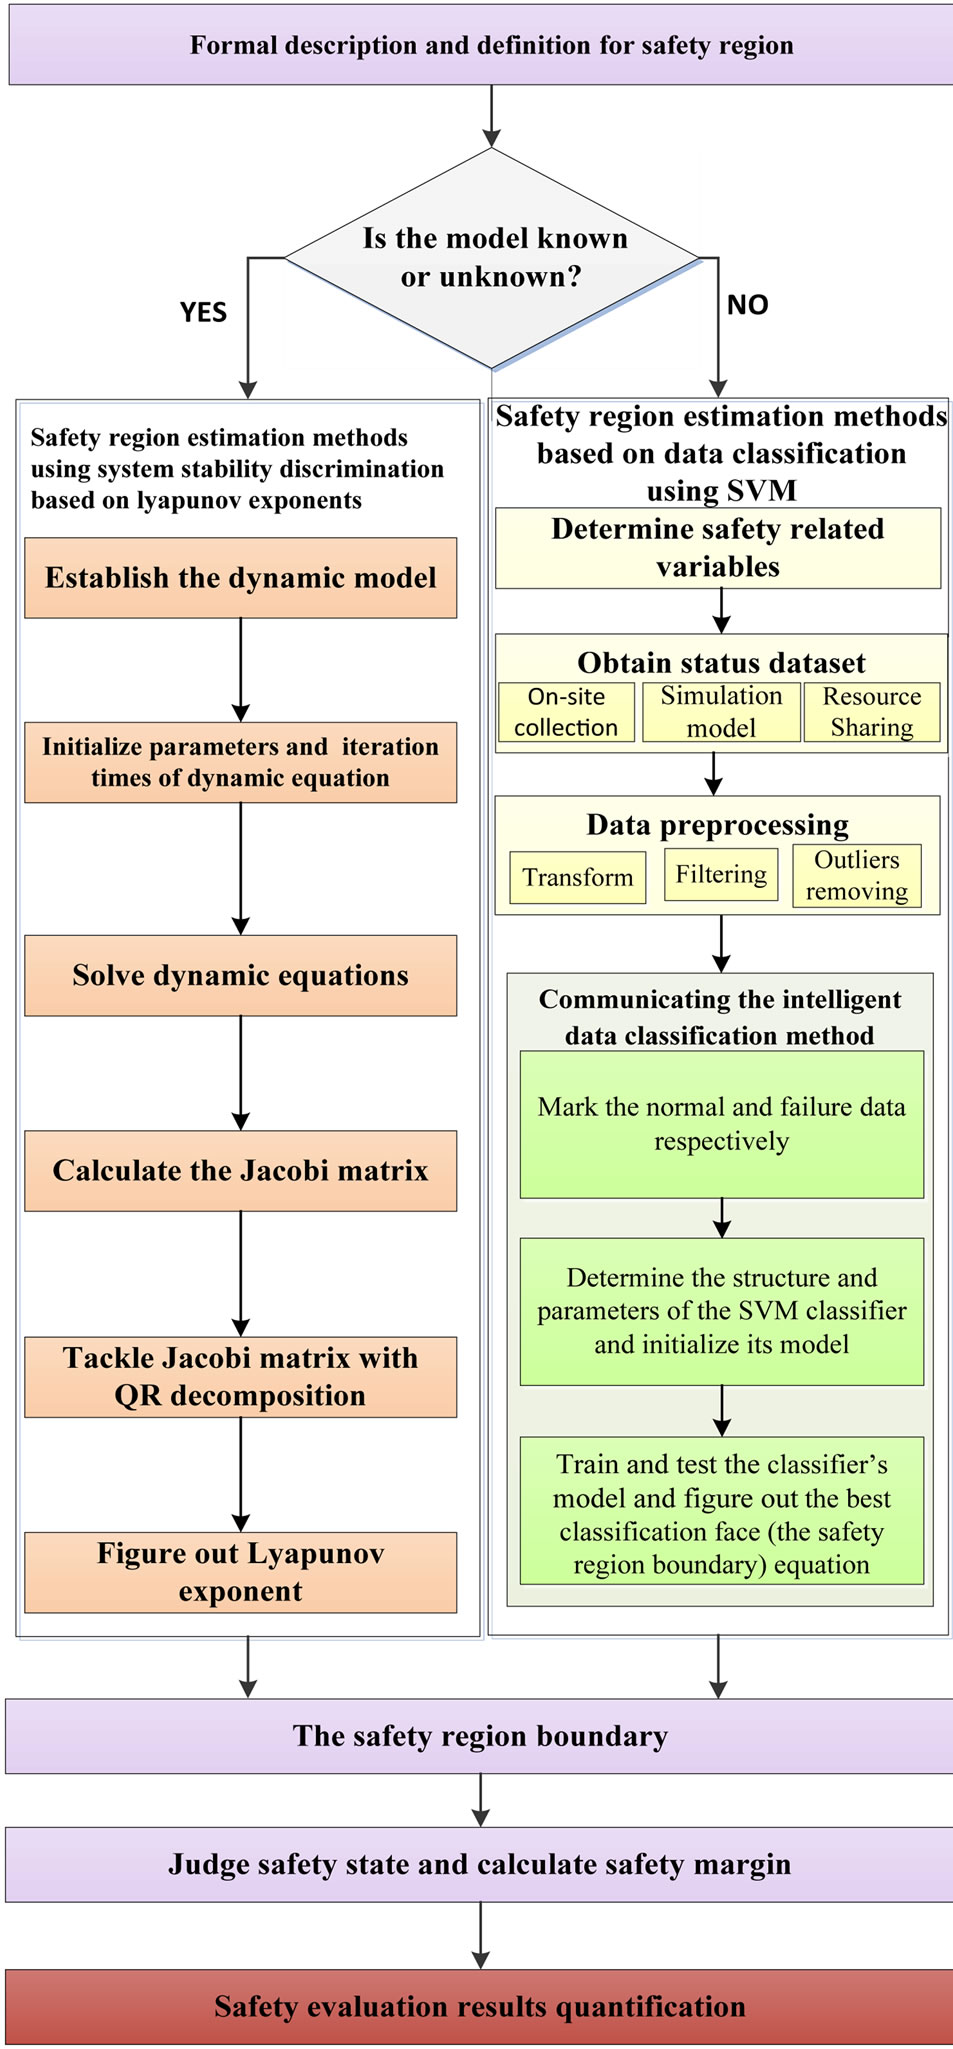
Figure 3. Security evaluation method of railway vehicles’ service status based on safety region assessment.
idea and steps of safety assessment of rail vehicle based on safety region estimation. Furthermore, for the object with known or unknown models, different algorithms of safety region estimation were introduced. Finally, the overall framework was summarized.
The safety assessment of rail vehicle based on safety region estimation proposed in this paper is on its debut and different objects should be further researched. Meanwhile study results should be used to design practical systems. In the foreseeable future, the study and application of this approach can provide theoretical foundation and scientific methods for online assessment of safety state and risk analysis in railway transportation, put an end to blind overdraft of key devices and greatly reduce risk and loss caused by failures. Last, but certainly not the least, this can offer the basic data and necessary support for scientific operation of rail transit vehicle and provide guidance for establishing scientific and effective repair according to condition.
6. Acknowledgements
The authors would like to express their thanks to the editor and anonymous reviewers for their help in revising the manuscript. This research is sponsored by National High-tech R&D Program of China (863 Program No. 2011AA110501) and the Specialized Research Fund for the Doctoral Program of Higher Education of China (Grant No. 20120009110035). The supports are gratefully acknowledged.
REFERENCES
- A. E. Mohamed and A. A. Essam, “Framework for Identification of Power System Operating Security Regions,” The Third International Conference on Network and System Security, Gold Coast, 19-21 October 2009, pp. 415- 419.
- Y. X. Yu, “Review of Study on Methodology of Security Regions of Power System,” Journal of Tianjin University, Vol. 41, No. 6, 2008, pp. 635-646 (Ch).
- Y. Zhang, Y. Qin, L. M. Jia, et al., “Research on Method Framework of Security Region Estimation in Rail Transit System Operation Safety Assessment,” Journal System Simulation Technology and Its Applications, Vol. 13, 2011, pp. 1018-1022.
- Y. Zhang, Y. Qin and L. M. Jia, “Research on Methodology of Security Region Estimation of Railway System Operation Safety Assessment,” Proceedings of World Congress on Engineering and Technology, Vol. 6, 2011, pp. 803-807.
- L. Q. Zhang, Y. Shi, T. W. Chen and B. Huang, “A New Method for Stabilization of Networked Control Systems with Random Delays,” Proceedings of the 2005 American Control Conference, Portland, 8-10 June 2005, pp. 633- 637. http://dx.doi.org/10.1109/ACC.2005.1470028
- N. Wang, Y. J. Zhi, J. H. Zhang, et al., “Identity-Based Secure Inter-Domain Routing Protoco1,” Journal of Software, Vol. 20, No. 12, 2009, pp. 3223-3239. http://dx.doi.org/10.3724/SP.J.1001.2009.03396
- L. Jin and G. Qian, “Info-Securitv of Expressway Network Collect Fees System,” Computer Engineering, Vol. 29, No. 10, 2006, pp. 124-126.
- M. Sabhnani and G. Serpen, “Application of Machine Learning Algorithms to KDD Intrusion Detection Dataset within Misuse Detection Contex,” Proceedings of the International Conferences on Machine Learning, Models, Technologies and Applications, 2003, pp. 209-215.
- R. J. Kaye and F. F. Wu, “Dynamic Security Regions of Power Systems,” IEEE Transactions on Circuit and System, Vol. 29, No. 9, 1982, pp. 612-623. http://dx.doi.org/10.1109/TCS.1982.1085203
- Y. X. Yu and F. Feng, “Active Power Steady—State Security Region of Power System,” Science in China: Series A, Vol. 33, No. 121, 1990, pp. 1488-1500.
- Y. Zeng, J. C. Fan, Y. X. Yu, et al., “Practical Dynamic Security Regions of Bulk Power Systems,” Automation of Electric Power Systems, Vol. 1, 2001, pp. 6-10.
- Y. Makarov, P. Du, S. Lu and T. B. Nguyen, “Pacific Northwest National Laboratory,” Wide Area Security Region Intermediate Report, 2009.
- X. M. Wu and Z. X. Han, “Steady Security Region Analysis of Power Systems Based on Fuzzy Set Theory,” Proceedings of the EPSA, Vol. 6, No. 3, 1994, pp. 15-20.
- A. Essam and A. Mohamed, “Application of Operating Security Regions in Power Systems,” IEEE PES Transmission and Distribution Conference and Exposition, New Orleans, 19-22 April 2010, pp. 1-6.
- Y. Zhang, Y. Qin and L. M. Jia, “Security Region Estimation of Peak Amplitudes of Track Irregularities Based on Danger Points Distribution Ratio and SVM,” Journal of Central South University (Science and Technology), Vol. 43, No. 11, 2012, pp. 4533-4541.
- X. S. Jin, L. Ling, X. B. Xiao, et al., “Dynamic Behaviour Numerical Simulation and Safety Boundary Analysis for High Speed Trains in Severe Environments,” Computer Aided Engineering, Vol. 20, No. 3, 2011, pp. 29-41, 59.
- J.-B. Guo, S.-P. Yang, G.-S. Gao and Q.-P. Zhu, “Stable Current-Collecting and Lyapunov Exponents for HighSpeed Train Pantograph-Catenary’s System,” China Safety Science Journal, Vol. 15, No. 3, 2005, pp. 61-64.
- T. X. Wu and M. J. Brennan, “Basic Analytical Study of Pantograph-Catenary System Dynamics,” Vehicle System Dynamics, Vol. 30, No. 6, 1998, pp. 443-456. http://dx.doi.org/10.1080/00423119808969460
- G. Poetsch, J. Evans, R. Meisinger, W. Kortüm, W. Baldauf, A. Veitl and J. Wallaschek, “Pantograph/Catenary Dynamics and Control,” Vehicle System Dynamics, Vol. 28, No. 2-3, 1997, pp. 159-195. http://dx.doi.org/10.1080/00423119708969353
- R. T. Hu, X. Z. Zhe and L. Y. Ren, “Faults Diagnosis Based on Lyapunov Exponent and Phase Trajectory for a Generator Sets,” Journal of Northeastern University (Natural Science), Vol. 25, No. 5, 2004, pp. 478-481.
- L. B. Zhang, C. H. Wang and L. Z. Tian, “Lyapunov Exponent Recognition for the Fault Signal of Mechanical Equipment,” Oil Field Equipment, Vol. 33, No. 2, 2004, p. 527.
- W. P. Yang, G. D. Chen and B. Q. Shi, “Application of Lyapunov Exponents to Fault Diagnosis of Diesel Engines,” Journal of Vibration Engineering, Vol. 15, No. 4, 2002, pp. 476-478.
- Y. T. Li, “Chaos and Lyapunov Characteristic Exponents,” Physics, Vol. 25, No. 5, 1996, pp. 282-286.
- D. Aniszewska and M. Rybaczuk, “Lyapunov Type Stability and Lyapunov Exponent for Exemplary Multiplicative Dynamical Systems,” Nonlinear Dynamics, Vol. 54, No. 4, 2008, pp. 345-354. http://dx.doi.org/10.1007/s11071-008-9333-7
- K. Geist, U. Parlitz and W. Lauterborn, “Comparison of Different Methods for Computing Lyapunov Exponents,” Progress of Theoretical Physics, Vol. 83, No. 5, 1990, pp. 875-893. http://dx.doi.org/10.1143/PTP.83.875
- A Wolf, J. B. Swift, H. L. Swinney, et al., “Determining Lyapunov Exponents from a Time Series,” Physica D, Vol. 16, No. 3, 1985, pp. 285-317. http://dx.doi.org/10.1016/0167-2789(85)90011-9
- K. H. Sun, G. Q. Tan, L. Y. Sheng and T. S. Zhang, “Design and Implementation of Lyapunov Exponents Calculating Algorithm,” Computer Engineering and Applications, Vol. 35, No. 2, 2004, pp. 12-14.
- J. H. Ma, Y. S. Chen and Z. R. Liu, “The Matric Algorithm of Lyapunov Exponent for the Experimental Date Obtained in Dynamic Analysis,” Applied Mathematics and Mechanics, Vol. 20, No. 9, 1999, pp. 919-927.
- B. G. Tian, “The Calculation of Lyapunov Exponents Based on the Neural Network,” Systems Engineering Theory & Practice, Vol. 8, 2001, pp. 9-13.
- H. F. Liu, Y. Y. Zhao and Z. H. Dai, “Calculation of the Largest Lyapunov Exponent in the Discrete Dynamical System with Wavelet Analysis,” Acta Physica Sinica, Vol. 50, No. 12, 2001, pp. 2311-2316.
- C. Cortes and V. Vapnik, “Support-Vector Networks,” Machine Learning, Vol. 20, No. 3, 1995, pp. 273-297. http://dx.doi.org/10.1007/BF00994018
- T. Pahikkala, S. Pyysalo, J. Boberg, et al., “Improving the Performance of Bayesian and Support Vector Classifiers in Word Sense Disambiguation using Positional Information,” Proceedings of the International and Interdisciplinary Conference on Adaptive Knowledge Representation and Reasoning, Espoo, 2005, pp. 90-97..
- C. X. Cui, “Intelligent Classification,” China Meteorological Press, Beijing, 2009.
- X. L. Li, A. H. Li and X. F. Bai, “Robust Face Recognition Using HM M and SVM,” Opto-Electronic Engineering, Vol. 37, No. 6, 2010, pp. 103-107.
- X. C. Shi and Z. T. Guo, “Mulit-Classification Method of GA-VM on Identifying Grade of Expansive Soils,” Journal of Civil, Architectural & Environmental Engineering, Vol. 31, No. 4, 2009, pp. 44-48, 59.
- C. F. Lin and S. D. Wang, “Fuzzy Support Vector Machines with Automatic Membership Setting,” Studies in Fuzziness and Soft Computing, No. 177, 2005, pp. 233- 254.
- R. Zhang, Y. C. Ma and X. B. Duan, “New Algorithm of Fuzzy Support Vector Machine for Classification with Outliers,” Journal of Xi’an Jiaotong University, Vol. 41, No. 12, 2007, pp. 1414-1417.
- H. K. Che, F. Z. Lu and Z. Q. Xiang, “Defects Identification by SVM-DS Fusion Decision-Making with Multiple Features,” Journal of Mechanical Engineering, Vol. 46, No. 16, 2010, pp. 101-105. http://dx.doi.org/10.3901/JME.2010.16.101