Paper Menu >>
Journal Menu >>
 J. Biomedical Science and Engineering, 2009, 2, 621-625 JBiSE doi: 10.4236/jbise.2009.28090 Published Online December 2009 (http://www.SciRP.org/journal/jbise/). Published Online December 2009 in SciRes. http://www.scirp.org/journal/jbise FastCluster: a graph theory based algorithm for removing redundant sequences Peng-Fei Liu2, Yu-Dong Cai1*, Zi-Liang Qian3,4, Sheng-Yu Ni5, Liu-Huan Dong5, Chang-Hong Lu6,7, Jin-Long Shu6 , Zhen-Bing Zeng2,5, Wen-Cong Lu8* 1Institute of Systems Biology, Shanghai University, Shanghai, China; 2Software Engineering Institute of East China Normal University, East China Normal University, Shanghai, China; 3 Bioinformatics Center, Key Lab of Systems Biology, Shanghai Institutes for Biological Sciences, Chinese Academy of Sciences, Shanghai, China; 4 Graduate School of the Chinese Academy of Sciences, Beijing, China; 5 CAS-MPG Partner Institute for Computational Biology, Shanghai Institutes for Biological Sciences, Chinese Academy of Sciences, Shanghai, China; 6 Department of Mathematics, East China Normal University, Shanghai, China; 7 Institute of Theoretical Computing, East China Normal University, Shanghai, China; 8 Department of Chemistry, Shanghai University, Shanghai, China. Email: perphyliu@gmail.com; *cai_yud@yahoo.com.cn; zl_qian@yahoo.com.cn; sendru@gmail.com; dlh@picb.ac.cn; chluclear@gmail.com; jlshu@math.ecnu.edu.cn; zbzeng@sei.ecnu.edu.cn; *wclu@shu.edu.cn Received 1 August 2009; revised 30 August 2009, accepted 3 September 2009. ABSTRACT In many cases, biological sequence databases contain redundant sequences that make it difficult to achieve reliable statistical analysis. Removing the redundant sequences to find all the real protein families and their representatives from a large sequences dataset is quite important in bioinformatics. The problem of removing redundant protein sequences can be mod- eled as finding the maximum independent set from a graph, which is a NP problem in Mathematics. This paper presents a novel program named FastCluster on the basis of mathematical graph theory. The algo- rithm makes an improvement to Hobohm and Sander’s algorithm to generate non-redundant pro- tein sequence sets. FastCluster uses BLAST to de- termine the similarity between two sequences in or- der to get better sequence similarity. The algorithm’s performance is compared with Hobohm and Sander’s algorithm and it shows that Fast- Cluster can produce a reasonable non-redundant pro- tein set and have a similarity cut-off from 0.0 to 1.0. The proposed algorithm shows its superiority in generat- ing a larger maximal non-redundant (independent) protein set which is closer to the real result (the maximum independent set of a graph) that means all the protein families are clustered. This makes Fast- Cluster a valuable tool for removing redundant pro- tein sequences. Keywords: Blast; Graph Theory; Redundant Sequences; CD-HIT 1. INTRODUCTION Recently, with the explosion of biological sequence data, many biological sequence databases have redundant se- quences which can cause problems for data analysis. These redundant sequences cannot provide valuable in- formation for analysis but detracts from the statistical significance of interesting hits. Moreover, processing these redundant sequences often requires more time and computational resources. Removing redundant sequen- ces is undoubtedly very helpful for performing statistical analysis and accelerating extensive database searching [1]. And it is also a way to obtain the real protein fami- lies and their representatives from a large sequences dataset. Therefore, it is necessary to develop an appro- priate algorithm to remove redundant sequences from a biological sequence database. Hobohm and Sander’s algorithm is a widely used al- gorithm in many redundant sequence removing pro- grams. Hobohm and Sander’s algorithm was firstly in- troduced by U.Hobohm et al. of EMBL laboratory in 1992. In 1998, Lissa Holm and Chris Sander developed a program based on this algorithm to generate a non- redundant protein database NRDB90 [2]. After that, other researchers developed some programs for remov- ing redundant sequences on the basis of Hobohm and Sander ’s algorithm, such as CD-HIT and PISCES. CD-HIT [3,4] is a well-known program for processing large sequence databases efficiently. It is fast and flexi- ble and can generate a representative set based on an incremental greedy algorithm introduced by Hobohm 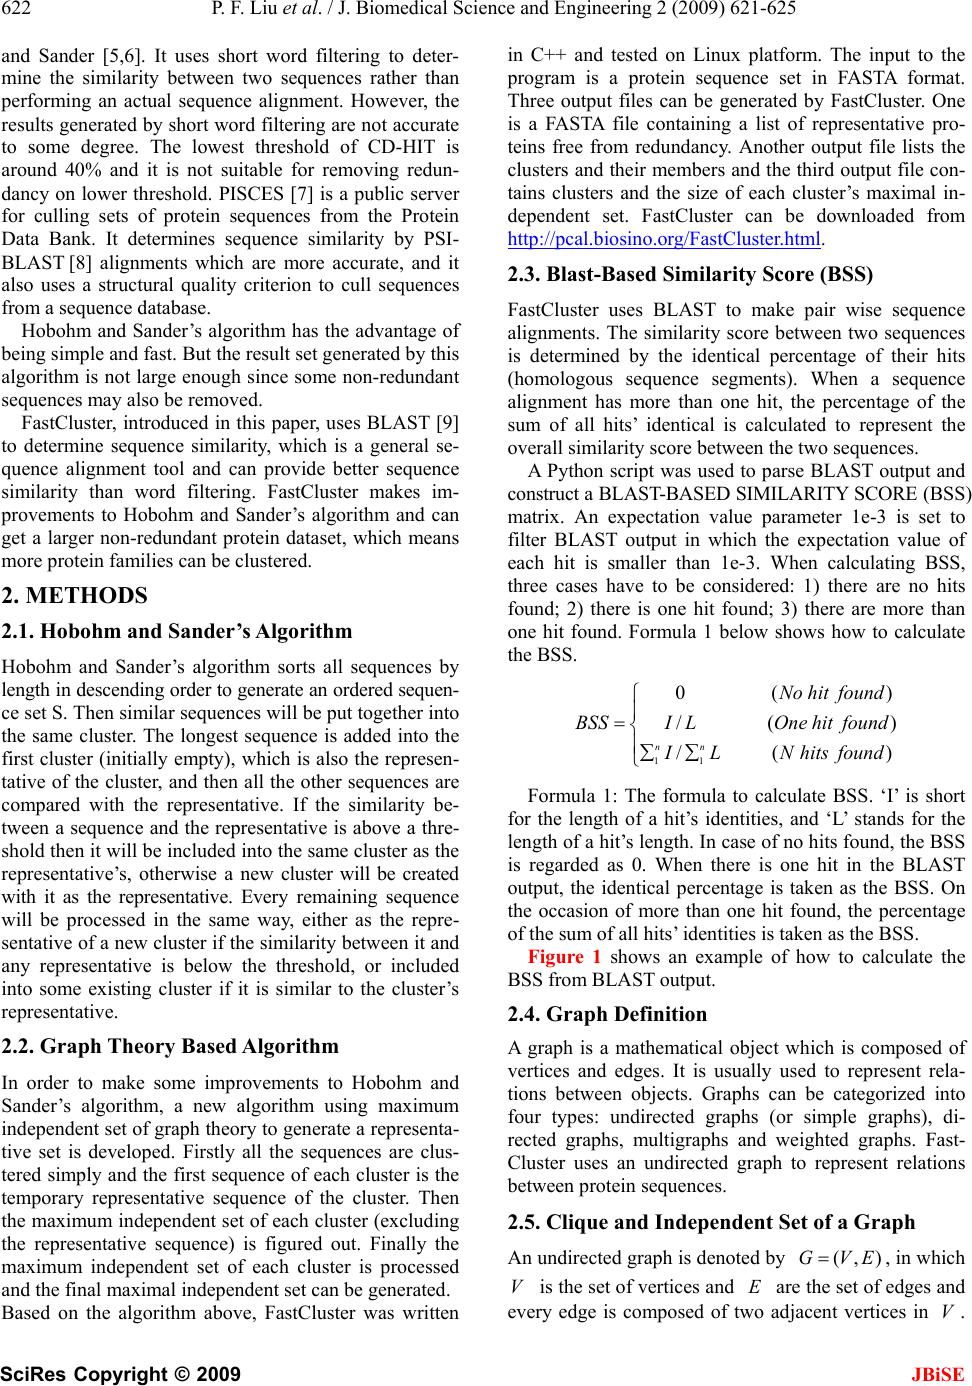 622 P. F. Liu et al. / J. Biomedical Science and Engineering 2 (2009) 621-625 SciRes Copyright © 2009 JBiSE and Sander [5,6]. It uses short word filtering to deter- mine the similarity between two sequences rather than performing an actual sequence alignment. However, the results generated by short word filtering are not accurate to some degree. The lowest threshold of CD-HIT is around 40% and it is not suitable for removing redun- dancy on lower threshold. PISCES [7] is a public server for culling sets of protein sequences from the Protein Data Bank. It determines sequence similarity by PSI- BLAST [8] alignments which are more accurate, and it also uses a structural quality criterion to cull sequences from a sequence database. Hobohm and Sander ’s algorithm has the advantage of being simple and fast. But the result set generated by this algorithm is not large enough since some non-redundant sequences may also be removed. FastCluster, introduced in this paper, uses BLAST [9] to determine sequence similarity, which is a general se- quence alignment tool and can provide better sequence similarity than word filtering. FastCluster makes im- provements to Hobohm and Sander’s algorithm and can get a larger non-redundant protein dataset, which means more protein families can be clustered. 2. METHODS 2.1. Hobohm and Sander’s Algorithm Hobohm and Sander’s algorithm sorts all sequences by length in descending order to generate an ordered sequen- ce set S. Then similar sequences will be put together into the same cluster. The longest sequence is added into the first cluster (initially empty), which is also the represen- tative of the cluster, and then all the other sequences are compared with the representative. If the similarity be- tween a sequence and the representative is above a thre- shold then it will be included into the same cluster as the representative’s, otherwise a new cluster will be created with it as the representative. Every remaining sequence will be processed in the same way, either as the repre- sentative of a new cluster if the similarity between it and any representative is below the threshold, or included into some existing cluster if it is similar to the cluster ’s representative. 2.2. Graph Theory Based Algorithm In order to make some improvements to Hobohm and Sander ’s algorithm, a new algorithm using maximum independent set of graph theory to generate a representa- tive set is developed. Firstly all the sequences are clus- tered simply and the first sequence of each cluster is the temporary representative sequence of the cluster. Then the maximum independent set of each cluster (excluding the representative sequence) is figured out. Finally the maximum independent set of each cluster is processed and the final maximal independent set can be generated. Based on the algorithm above, FastCluster was written in C++ and tested on Linux platform. The input to the program is a protein sequence set in FASTA format. Three output files can be generated by FastCluster. One is a FASTA file containing a list of representative pro- teins free from redundancy. Another output file lists the clusters and their members and the third output file con- tains clusters and the size of each cluster’s maximal in- dependent set. FastCluster can be downloaded from http://pcal.biosino.org/FastCluster.html. 2.3. Blast-Based Similarity Score (BSS) FastCluster uses BLAST to make pair wise sequence alignments. The similarity score between two sequences is determined by the identical percentage of their hits (homologous sequence segments). When a sequence alignment has more than one hit, the percentage of the sum of all hits’ identical is calculated to represent the overall similarity score between the two sequences. A Python script was used to parse BLAST output and construct a BLAST-BASED SIMILARITY SCORE (BSS) matrix. An expectation value parameter 1e-3 is set to filter BLAST output in which the expectation value of each hit is smaller than 1e-3. When calculating BSS, three cases have to be considered: 1) there are no hits found; 2) there is one hit found; 3) there are more than one hit found. Formula 1 below shows how to calculate the BSS. ∑∑ = )(/ )(/ )(0 11 foundhitsNLI foundhitOneLI foundhitNo BSS nn Formula 1: The formula to calculate BSS. ‘I’ is short for the length of a hit’s identities, and ‘L’ stands for the length of a hit’s length. In case of no hits found, the BSS is regarded as 0. When there is one hit in the BLAST output, the identical percentage is taken as the BSS. On the occasion of more than one hit found, the percentage of the sum of all hits’ identities is taken as the BSS. Figure 1 shows an example of how to calculate the BSS from BLAST output. 2.4. Graph Definition A graph is a mathematical object which is composed of vertices and edges. It is usually used to represent rela- tions between objects. Graphs can be categorized into four types: undirected graphs (or simple graphs), di- rected graphs, multigraphs and weighted graphs. Fast- Cluster uses an undirected graph to represent relations between protein sequences. 2.5. Clique and Independent Set of a Graph An undirected graph is denoted by ),( EVG = , in which V is the set of vertices and E are the set of edges and every edge is composed of two adjacent vertices in V. 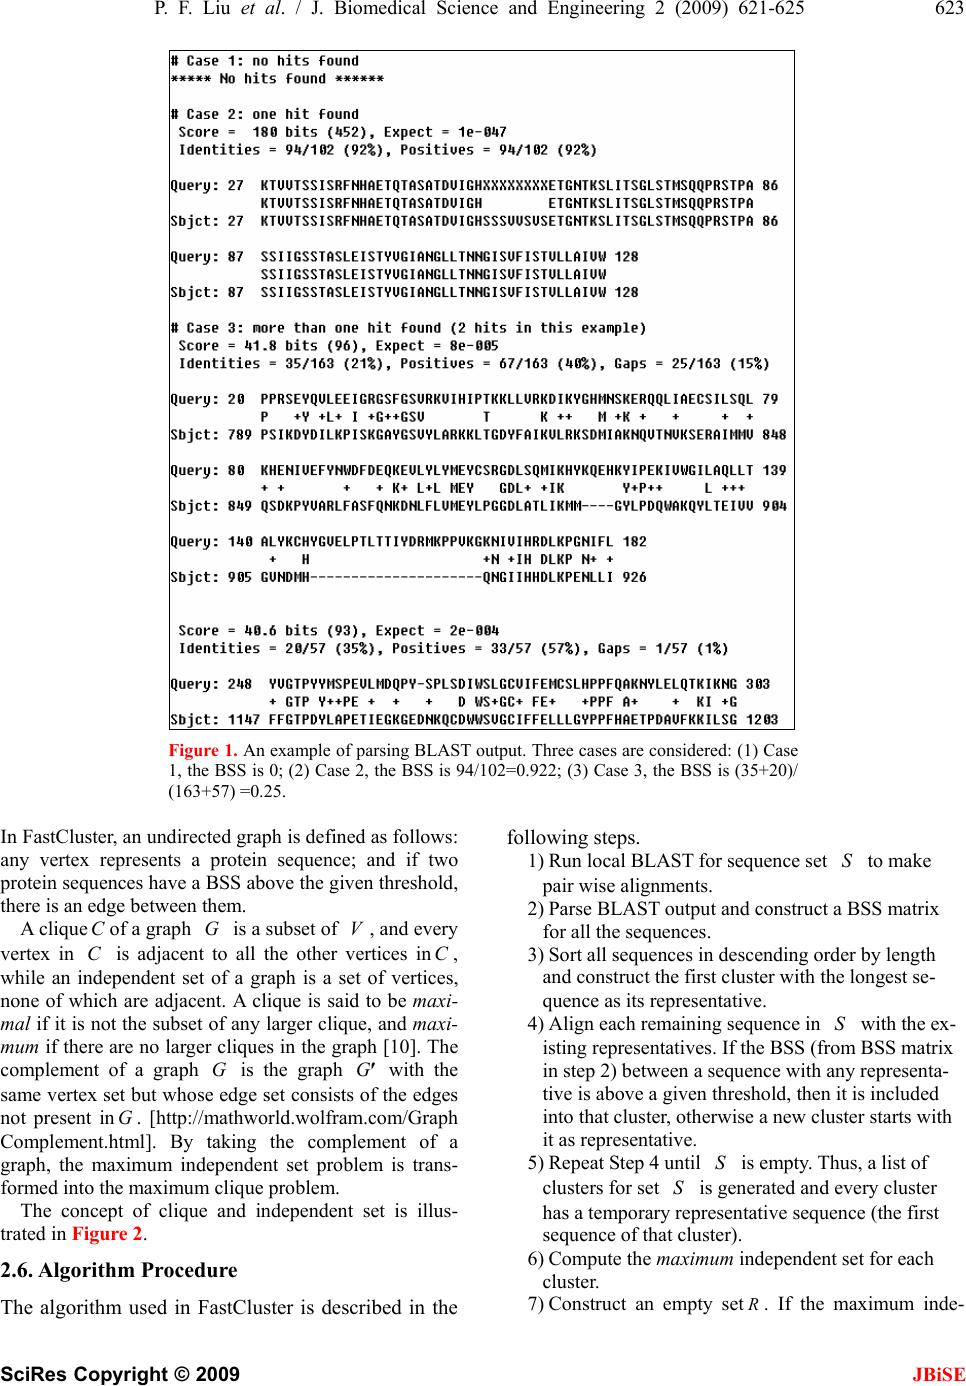 P. F. Liu et al. / J. Biomedical Science and Engineering 2 (2009) 621-625 623 SciRes Copyright © 2009 JBiSE Figure 1. An example of parsing BLAST output. Three cases are considered: (1) Case 1, the BSS is 0; (2) Case 2, the BSS is 94/102=0.922; (3) Case 3, the BSS is (35+20)/ (163+57) =0.25. In FastCluster, an undirected graph is defined as follows: any vertex represents a protein sequence; and if two protein sequences have a BSS above the given threshold, there is an edge between them. A clique Cof a graph G is a subset of V, and every vertex in C is adjacent to all the other vertices in C, while an independent set of a graph is a set of vertices, none of which are adjacent. A clique is said to be maxi- mal if it is not the subset of any larger clique, and maxi- mum if there are no larger cliques in the graph [10]. The complement of a graph G is the graph ' G with the same vertex set but whose edge set consists of the edges not present in G. [http://mathworld.wolfram.com/Graph Complement.html]. By taking the complement of a graph, the maximum independent set problem is trans- formed into the maximum clique problem. The concept of clique and independent set is illus- trated in Figure 2. 2.6. Algorithm Procedure The algorithm used in FastCluster is described in the following steps. 1) Run local BLAST for sequence set S to make pair wise alignments. 2) Parse BLAST output and construct a BSS matrix for all the sequences. 3) Sort all sequences in descending order by length and construct the first cluster with the longest se- quence as its representative. 4) Align each remaining sequence in S with the ex- isting representatives. If the BSS (from BSS matrix in step 2) between a sequence with any representa- tive is above a given threshold, then it is included into that cluster, otherwise a new cluster starts with it as representative. 5) Repeat Step 4 until S is empty. Thus, a list of clusters for set S is generated and every cluster has a temporary representative sequence (the first sequence of that cluster). 6) Compute the maximum independent set for each cluster. 7) Construct an empty set R . If the maximum inde- 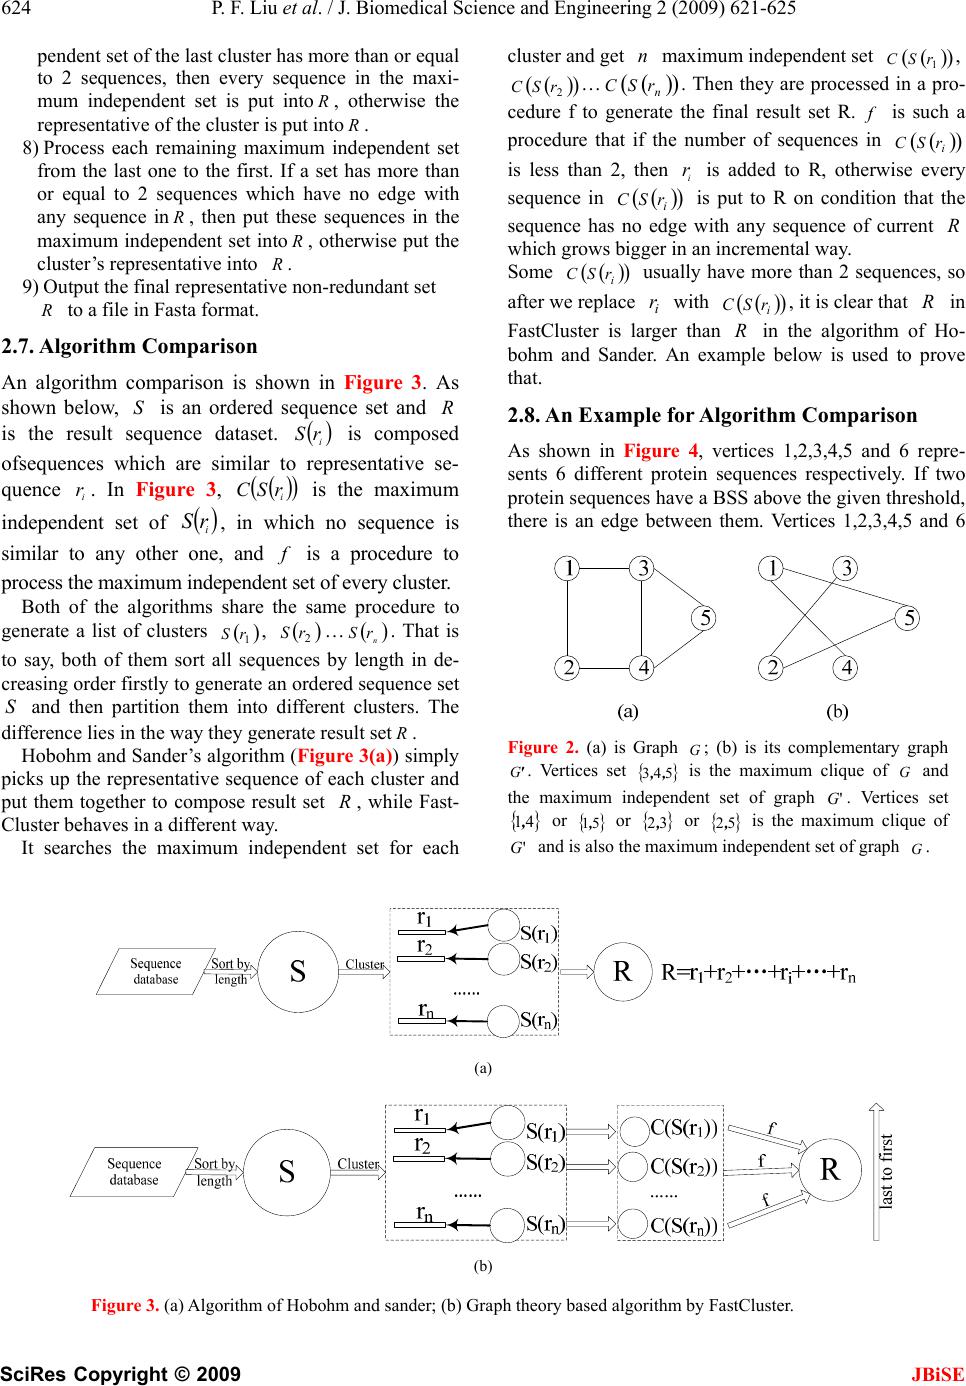 624 P. F. Liu et al. / J. Biomedical Science and Engineering 2 (2009) 621-625 SciRes Copyright © 2009 JBiSE pendent set of the last cluster has more than or equal to 2 sequences, then every sequence in the maxi- mum independent set is put into R , otherwise the representative of the cluster is put into R . 8) Process each remaining maximum independent set from the last one to the first. If a set has more than or equal to 2 sequences which have no edge with any sequence in R , then put these sequences in the maximum independent set into R , otherwise put the cluster ’s representative into R . 9) Output the final representative non-redundant set R to a file in Fasta format. 2.7. Algorithm Comparison An algorithm comparison is shown in Figure 3. As shown below, S is an ordered sequence set and R is the result sequence dataset. ( ) i rS is composed ofsequences which are similar to representative se- quence i r. In Figure 3, ( ) ( ) i rSC is the maximum independent set of ( ) i rS , in which no sequence is similar to any other one, and f is a procedure to process the maximum independent set of every cluster. Both of the algorithms share the same procedure to generate a list of clusters ( ) 1 rS , ( ) 2 rS … ( ) n rS . That is to say, both of them sort all sequences by length in de- creasing order firstly to generate an ordered sequence set S and then partition them into different clusters. The difference lies in the way they generate result set R . Hobohm and Sander’s algorithm (Figure 3(a)) simply picks up the representative sequence of each cluster and put them together to compose result set R , while Fast- Cluster behaves in a different way. It searches the maximum independent set for each cluster and get n maximum independent set ( ) ( ) 1 rSC , ( ) ( ) 2 rSC … ( ) ( ) n rSC. Then they are processed in a pro- cedure f to generate the final result set R. fis such a procedure that if the number of sequences in ( ) ( ) i rSC is less than 2, then i r is added to R, otherwise every sequence in ( ) ( ) i rSC is put to R on condition that the sequence has no edge with any sequence of current R which grows bigger in an incremental way. Some ( ) ( ) i rSC usually have more than 2 sequences, so after we replace i r with ( ) ( ) i rSC , it is clear that R in FastCluster is larger than R in the algorithm of Ho- bohm and Sander. An example below is used to prove that. 2.8. An Example for Algorithm Comparison As shown in Figure 4, vertices 1,2,3,4,5 and 6 repre- sents 6 different protein sequences respectively. If two protein sequences have a BSS above the given threshold, there is an edge between them. Vertices 1,2,3,4,5 and 6 Figure 2. (a) is Graph G; (b) is its complementary graph 'G. Vertices set { } 543 ,, is the maximum clique of G and the maximum independent set of graph 'G. Vertices set { } 41, or { } 51, or { } 32, or { } 52, is the maximum clique of 'G and is also the maximum independent set of graph G. (a) (b) Figure 3. (a) Algorithm of Hobohm and sander; (b) Graph theory based algorithm by FastCluster.  P. F. Liu et al. / J. Biomedical Science and Engineering 2 (2009) 621-625 625 SciRes Copyright © 2009 JBiSE Figure 4. A graph example. Table 1. Number of non-redundant sequences obtained using FastCluster and HSCluster. Database Threshold (%) Number (FastCluster) Number (HSCluster) 10 3167 2824 20 3185 2845 30 5256 4753 40 12940 10058 50 18177 17275 60 25854 25020 70 33400 32758 80 41049 40555 65718 En- zyme pro- teins 90 49986 49669 are assumed to be ordered in descending order by length. This example can be used to prove that FastCluster can produce more results than Hobohm and Sander’s algo- rithm. Hobohm and Sander’s algorithm and FastCluster share the same way to generate three clusters, and they are {} 1 , { } 2 and { } 6543 ,,, (Figure 4). But the way they generate the result set is different. According to Hobohm and Sander’s algorithm, the representative ver- tex from each cluster is picked up to compose the result vertices { } 3,2,1 . While FastCluster computes the maxi- mum independent set for each cluster and they are {} 1, { } 2 and { } 6,4 , and then it collects { } 6,4, { } 2 and {} 1 together to compose the final result vertices { } 6,4,2,1. Obviously, { } 6,4,2,1 is larger than { } 321 ,, . From this example, it is proved that FastCluster can produce more results than Hobohm and Sander ’s algorithm. 3. RESULTS AND DISCUSSION FastCluster introduces a graph theory algorithm to re- move redundant protein sequences and runs in a flexible and user-friendly way. It can also be changed to process other types of biological sequences easily. A protein sequence set (65718 enzymes, from http://expasy.org/sprot/) was selected to test the per- formance of FastCluster. Another program HSCluster which implements the algorithm of Hobohm and San- der is also developed. The results generated by these two algorithms are shown in Table 1. It is clear that FastCluster can produce more results than HSCluster. 4. CONCLUSIONS This paper makes an investigation on removing redun- dant biological sequences, which is modeled as a mathe- matical problem of finding a maximal independent set from a graph. Based on this model, FastCluster has made an improvement to Hobohm and Sander ’s algorithm in finding a larger independent set of a graph and thus gen- erate more result sequences, which mean that more pro- tein families can be clustered in a protein dataset. In a word, FastCluster provides an alternatively improved way to remove redundancy from a biological database and is also a computational tool to find more protein families and their representatives. 5. ACKNOWLEDGEMENTS This research was supported by the grants from Shanghai Commission for Science and Technology (KSCX2-YW-R-112), and Shanghai Leading Academic Discipline Project (J50101). REFERENCES [1] G. Grillo, M. Attimonelli, S. Liuni, G. Pesole. (1996) CLEANUP: a fast computer program for removing re- dundancies from nucleotide sequence databases. CABIOS, 12, 1–8. [2] L. Holm and C. Sander. (1998) Removing near- neighbour redundancy from llarge protein sequence col- lections. Bioinformatics, 14, 423–429. [3] W. Li and A. Godzik. (2006) Cd-Hit: a fast program for clustering and comparing large sets of protein or nucleo- tide sequences. Bioinformatics, 22, 1658–1659. [4] W. Li, J L. aroszewski, A. Godzik. (2001) Clustering of highly homologous sequences to reduce the size of large protein databases. Bioinformatics, 17, 282–283. [5] U. Hobohm, M. Scharf, R. Schneider, C. Sander. (1992) selection of representative protein data sets. Protein Sci, 1, 409–417. [6] U. Hobohm and C. Sander. (1994) Enlarged representa- tive set of protein structures. Protein Sci, 3, 522–524. [7] G. Wang and R. L. Jr. Dunbrack. (2003) PISCES: a pro- tein sequence culling server. Bioinformatics, 12, 1589– 1591. [8] S. F. Altschul, T. L. Madden, A. A. Schäffer, J. Zhang, Z. Zhang, W. Miller, D. J. Lipman. (1997) Gapped BLAST and PSI-BLAST: a new generation of protein database search programs. Nucleic Acids Research, 25, 3389– 3402. [9] S. F. Altschul, W. Gish, W. Miller, E. W. Myers, D. J. Lipman. (1990) Basic local alignment search tool. J. Mol. Biol., 215, 403–410. [10] S. Niskanen and P. R. J. Östergård. (2003) Cliquer user’s guide, Version 1.0, Communications Laboratory, Hel- sinki University of Technology, Espoo, Tech. Rep. T48. http://users.tkk.fi/~pat/cliquer.html. |