Paper Menu >>
Journal Menu >>
 J. Biomedical Science and Engineering, 2009, 2, 594-605 doi: 10.4236/jbise.2009.28086 Published Online December 2009 (http://www.SciRP.org/journal/jbise/ JBiSE ). Published Online December 2009 in SciRes. http://www.scirp.org/journal/jbise Water activity and glass transition temperatures of disaccharide based buffers for desiccation preservation of biologics Justin Reis1, Ranjan Sitaula2, Sankha Bhowmick1,2,3 1Department of Mechanical Engineering, University of Massachusetts Dartmouth, Massachusetts, USA; 2Biomedical Engineering and Biotechnology Program, University of Massachusetts Dartmouth, Massachusetts, USA; 3285 Old Westport Road Room # Textile 210 N. Dartmouth, MA 02747, USA. Email: sbhowmick@umassd.edu Received 22 August 2009, revised 27 September 2009; accepted 28 September 2009. ABSTRACT Studying the thermophysical properties of disaccha- ride based ternary solutions are gaining increasing importance because of their role as excepients in pres- ervation protocols for biologics in general and mam- malian cells in particular. Preservation strategies in- volve not only cryopreservation, but novel approaches like room temperature vitrification and lyophilization. In this study we investigate the water activity and glass transition temperature of citrate and tris buffers (widely used in the gamete preservation industry) with trehalose or sucrose after partial desiccation. After obtaining the water activity (aw) through equilibration at different relative humidity environments, we measured the glass transition temperature (Tg) of these partially desiccated solutions using a differential scanning calorimetry (DSC). The experimental data was used in conjunction with the Gordon-Taylor equation to obtain 3-D contours of Tg as a function of water content and relative salt/sugar concentration. Results indicate that the glass transition behavior is a strong function of the excepient combination. Overall, that trehalose solutions yielded larger values for Tg than sucrose counterparts at low moisture contents in combination with the same buffer. We also saw that citrate solutions yielded larger glass transitions than their tris counterparts. Based on these results, a tre- halose-citrate mixture can be picked as the preferred composition for storage applications. The 3-D contours which show a wide variation in slope depending on the salt-sugar concentration constitute important infor- mation for the desiccation preservation of biologics. Keywords: Trehalose; Sucrose; TRIS; Citrate; DSC; Glass; Transition; Tenperature 1. INTRODUCTION Desiccation preservation offers an attractive alternative to cryopreservation for the long term storage of mam- malian cells and gametes. While cryopreservation has a stringent requirement of storage in liquid nitrogen at a temperature in the vicinity of-196°C, desiccation pres- ervation offers the ability to store cells at or near ambi- ent conditions. At the same time it eliminates the usage of toxic cryoprotectants such as glycerol and DMSO which require removal upon returning cells to ambient temperatures, severely affecting cell survival in the process [1]. One of the hypotheses behind the mechanism of des- iccation preservation is the formation of glassy structure, a highly viscous state that minimizes molecular mobility of the matrix thereby suspending metabolic activities in the cells. Sugars, particularly disaccharides, have been effective in imparting cellular protection in the desic- cated state. A number of studies have demonstrated the ability of different sugars such as trehalose, sucrose, raffinose and maltose to sustain a stable glassy state at low moisture content [2,3,4,5,6,8]. Such sugars form glasses at ambient temperature, thereby reducing mo- lecular mobility and allowing a prolonged stable storage of biomaterials and cellular components [3,8,9,10,11]. The survival of mammalian cells in vitro requires a buffer or culture media generally consisting of various salt mixtures. In our study we chose to study ternary sugar-salt-water solutions. The interactions of ternary solutions can often be extremely difficult to predict without proper experimental studies of their thermo- physics [6]. These interactions can produce results that may vary significantly even from similar studies of bi- nary solutions [1,12]. Two key thermophysical parameters that will deter- mine a desiccation preservation protocol include water activity (aw) and glass transition temperature (Tg) [6,8,9,13,14]. Water activity (aw) is defined as the ratio of the vapor pressure of water in a material (p) to the vapor pressure of pure water (po) at the same tem- perature [15]. It is an equilibrium state that is greatly responsible for a solution’s ability to participate in physical, chemical and microbiological reactions [2,  J. Reis et al. / J. Biomedical Science and Engineering 2 (2009) 594-605 595 SciRes Copyright © 2009 JBiSE 16]. The glassy state is a non-equilibrium state at which substances exhibit an amorphous glass structure. Glass transition (Tg) is the temperature at which amorphous solids transition from solid to a less vis- cous state. The glass transition temperature is a func- tion of the solution constituents and the moisture con- tent, as well as a function of the water activity of the storage condition [17]. The objective of the current experimental study was to investigate the effect of water activity (given by the equilibrium relative humidity of the storage environ- ment for room temperature conditions) on moisture contents and the subsequent effect of moisture content on Tg of various sugar-buffer-water ternary system. The particular buffers chosen for this study were the Tris and Citrate buffers whose composition can be seen in Table 1. These buffers are widely used bovine sperm extenders under a wide range of temperatures [18,19,20,21,22]. These buffers have an excellent buffering characteristics for biochemical studies, are non-toxic to living cells, and effective for maintaining osmotic pressure in cells. Trehalose and sucrose were chosen as the excipient sugars owing to their superior glass forming ability and their effective role in desic- cation preservation which have been well documented in the studies of various biologics [4,5,8,11,23,24, 25]. The goal of our study was to create water activity ta- bles for different concentrations of the sugars in each of the buffers. The Tg of samples were then plotted in as a 3D surface plot as a function of sugar concentra- tion as well as moisture content. These 3D plots are extremely important for references in future work in determining which solutions will produce glass transi- tions at appropriate temperature levels. 2. MATERIALS AND METHODS 2.1. Sample Preparation Trehalose dihydrate (Sigma Aldrich assay > 99%) and sucrose (Sigma Aldrich assay > 99.5%) were both pur- chased from Sigma Aldrich. The tris and citrate buffers were obtained from ABS global, Deforest, WI in con- centrated forms and diluted with distilled water to 1X concentrations, which corresponds to an isotonic solu- tion of 325 mosm. The composition of the tris and cit- rate buffers are presented in Table 1. Molar calcula- tions were carried out to determine the appropriate quantity of trehalose or sucrose to be added to each individual volume of the buffer. Vials were then mixed thoroughly to ensure homogeneity. The range of each sugar in combination with respect to the buffer for the tris buffer were 0.713, 1.426, 2.139, 2.85, 5.705, 11.41 g sugar/g tris while solutions utilizing the citrate buffer used the range of 1.485, 2.97, 4.455, 5.94, 11.72, 23.76 g sugar/g citrate. 2.2. Generation of Humidity Environment and Drying Kinetics Curves Stable relative humidity (RH) environments were gener- ated by equilibrating samples in humidity boxes at room temperature (20C). Humidity boxes consisted of a sealed plastic food container with a chosen desiccant inside, that was placed inside larger stackable desicca- tion cabinets (Sanplatec Polystyrene Mini Desiccator, Osaka, Japan) [26,27]. Our chosen desiccants were su- persaturated solutions of magnesium nitrate, potassium acetate, lithium chloride, and lithium bromide that pro- vided us with 53%, 21%, 11%, and 6% RH respectively. Drierite salts (Drierite Aldrich Chemical Company, St Louis, MO) was used to obtain 1.5% RH environment. A digital hygrometer (Oakton Thermohygrometer, Vernon Hills, IL) was used to determine the equilibrium RH values generated by the various desiccants. Dry samples (0% RH) were obtained by baking in a natural convec- tive drying oven (Quincy Labs Model 10 Lab Oven, Chicago, IL) at 75°C for a minimum of 14 days or till no detectable variation in weight was observed. A 30μL volume of sample solution was carefully placed in a standard aluminum Differential Scanning Calorimeter (DSC) pan from TA Instruments (New Castle, DE). Pan weight and the sample weight measured using a digital scale (Mettler Toledo AB265S FACT, Columbus, OH) and recorded for gravimetric analysis and for the DSC experiment to determine the glass transition temperature (Tg). Pans were then carefully transported with tweezers to the appropriate relative humidity (RH) box where they were allowed to equilibrate. The samples were weighed periodically after they had been placed into the humidity box. Based on these weight measurements, a drying ki- netics chart was generated. These charts were used to ascertain the time at which the samples had reached equilibrium moisture content. 2.3. DSC Experiments After equilibration, the samples in the DSC pans were promptly hermetically crimped and sealed using a crimp from TA instruments to reduce any exposure to the room RH conditions. Samples were then ready for appropriate DSC experiments. Table 1. Shows a breakdown of components of both the par- ticular tris and citrate buffers which were used in this study. gm %=grams/100mL water. Tris Buffer Citrate buffer 2.42 gm % tris (hydroxymethyl aminomethane) 2.12 gm % sodium citrate dihydrate 1.38 gm % citric acid mono-hydrate 0.183 gm % citric acid monohydrate 1.0 gm % fructose 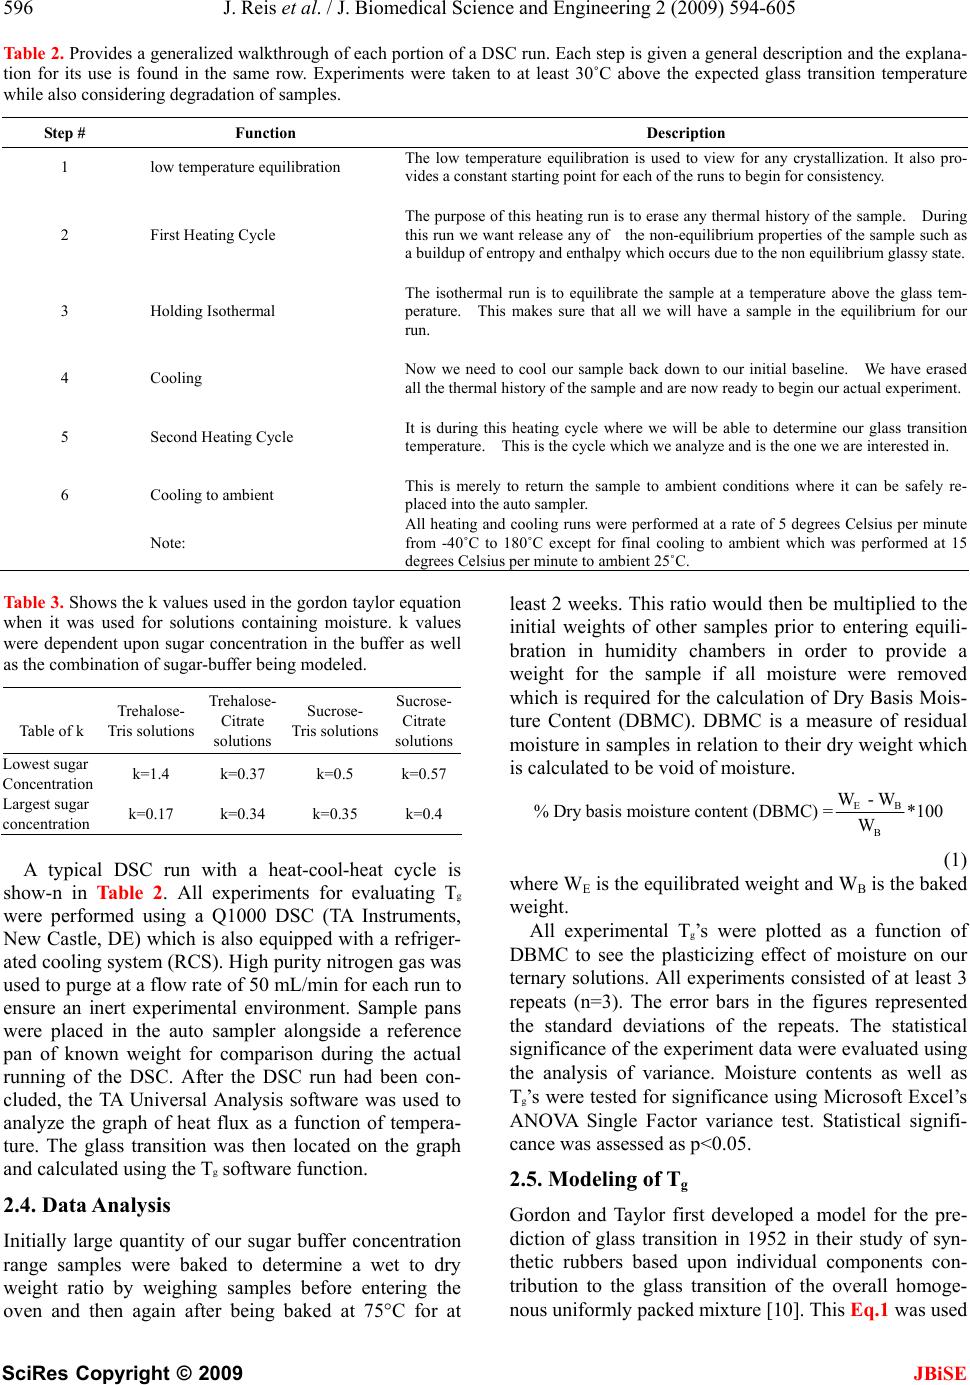 596 J. Reis et al. / J. Biomedical Science and Engineering 2 (2009) 594-605 SciRes Copyright © 2009 JBiSE Table 2. Provides a generalized walkthrough of each portion of a DSC run. Each step is given a general description and the explana- tion for its use is found in the same row. Experiments were taken to at least 30˚C above the expected glass transition temperature while also considering degradation of samples. Step # Function Description 1 low temperature equilibration The low temperature equilibration is used to view for any crystallization. It also pro- vides a constant starting point for each of the runs to begin for consistency. 2 First Heating Cycle The purpose of this heating run is to erase any thermal history of the sample. During this run we want release any of the non-equilibrium properties of the sample such as a buildup of entropy and enthalpy which occurs due to the non equilibrium glassy state. 3 Holding Isothermal The isothermal run is to equilibrate the sample at a temperature above the glass tem- perature. This makes sure that all we will have a sample in the equilibrium for our run. 4 Cooling Now we need to cool our sample back down to our initial baseline. We have erased all the thermal history of the sample and are now ready to begin our actual experiment. 5 Second Heating Cycle It is during this heating cycle where we will be able to determine our glass transition temperature. This is the cycle which we analyze and is the one we are interested in. 6 Cooling to ambient This is merely to return the sample to ambient conditions where it can be safely re- placed into the auto sampler. Note: All heating and cooling runs were performed at a rate of 5 degrees Celsius per minute from -40˚C to 180˚C except for final cooling to ambient which was performed at 15 degrees Celsius per minute to ambient 25˚C. Table 3. Shows the k values used in the gordon taylor equation when it was used for solutions containing moisture. k values were dependent upon sugar concentration in the buffer as well as the combination of sugar-buffer being modeled. Table of k Trehalose- Tris solutions Trehalose- Citrate solutions Sucrose- Tris solutions Sucrose- Citrate solutions Lowest sugar Concentration k=1.4 k=0.37 k=0.5 k=0.57 Largest sugar concentration k=0.17 k=0.34 k=0.35 k=0.4 A typical DSC run with a heat-cool-heat cycle is show-n in Table 2. All experiments for evaluating Tg were performed using a Q1000 DSC (TA Instruments, New Castle, DE) which is also equipped with a refriger- ated cooling system (RCS). High purity nitrogen gas was used to purge at a flow rate of 50 mL/min for each run to ensure an inert experimental environment. Sample pans were placed in the auto sampler alongside a reference pan of known weight for comparison during the actual running of the DSC. After the DSC run had been con- cluded, the TA Universal Analysis software was used to analyze the graph of heat flux as a function of tempera- ture. The glass transition was then located on the graph and calculated using the Tg software function. 2.4. Data Analysis Initially large quantity of our sugar buffer concentration range samples were baked to determine a wet to dry weight ratio by weighing samples before entering the oven and then again after being baked at 75°C for at least 2 weeks. This ratio would then be multiplied to the initial weights of other samples prior to entering equili- bration in humidity chambers in order to provide a weight for the sample if all moisture were removed which is required for the calculation of Dry Basis Mois- ture Content (DBMC). DBMC is a measure of residual moisture in samples in relation to their dry weight which is calculated to be void of moisture. EB B W - W % Dry basis moisture content (DBMC) =*100 W (1) where WE is the equilibrated weight and WB is the baked weight. All experimental Tg’s were plotted as a function of DBMC to see the plasticizing effect of moisture on our ternary solutions. All experiments consisted of at least 3 repeats (n=3). The error bars in the figures represented the standard deviations of the repeats. The statistical significance of the experiment data were evaluated using the analysis of variance. Moisture contents as well as Tg’s were tested for significance using Microsoft Excel’s ANOVA Single Factor variance test. Statistical signifi- cance was assessed as p<0.05. 2.5. Modeling of Tg Gordon and Taylor first developed a model for the pre- diction of glass transition in 1952 in their study of syn- thetic rubbers based upon individual components con- tribution to the glass transition of the overall homoge- nous uniformly packed mixture [10]. This Eq.1 was used 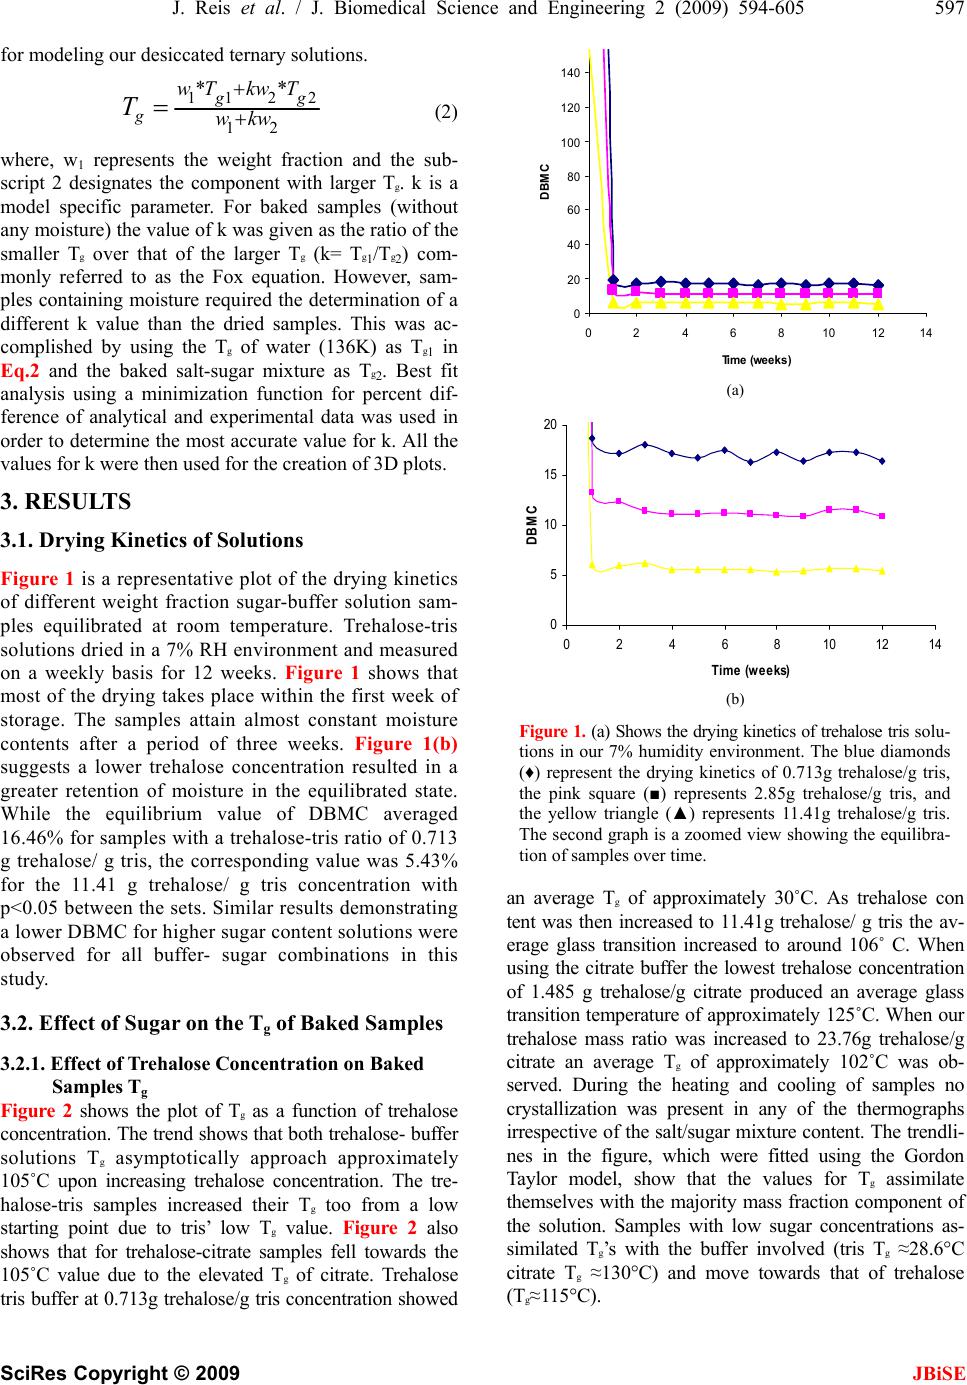 J. Reis et al. / J. Biomedical Science and Engineering 2 (2009) 594-605 597 SciRes Copyright © 2009 JBiSE for modeling our desiccated ternary solutions. 112 2 12 ** g g g wTkw T wkw T (2) where, w1 represents the weight fraction and the sub- script 2 designates the component with larger Tg. k is a model specific parameter. For baked samples (without any moisture) the value of k was given as the ratio of the smaller Tg over that of the larger Tg (k= Tg1/Tg2) com- monly referred to as the Fox equation. However, sam- ples containing moisture required the determination of a different k value than the dried samples. This was ac- complished by using the Tg of water (136K) as Tg1 in Eq.2 and the baked salt-sugar mixture as Tg2. Best fit analysis using a minimization function for percent dif- ference of analytical and experimental data was used in order to determine the most accurate value for k. All the values for k were then used for the creation of 3D plots. 3. RESULTS 3.1. Drying Kinetics of Solutions Figure 1 is a representative plot of the drying kinetics of different weight fraction sugar-buffer solution sam- ples equilibrated at room temperature. Trehalose-tris solutions dried in a 7% RH environment and measured on a weekly basis for 12 weeks. Figure 1 shows that most of the drying takes place within the first week of storage. The samples attain almost constant moisture contents after a period of three weeks. Figure 1(b) suggests a lower trehalose concentration resulted in a greater retention of moisture in the equilibrated state. While the equilibrium value of DBMC averaged 16.46% for samples with a trehalose-tris ratio of 0.713 g trehalose/ g tris, the corresponding value was 5.43% for the 11.41 g trehalose/ g tris concentration with p<0.05 between the sets. Similar results demonstrating a lower DBMC for higher sugar content solutions were observed for all buffer- sugar combinations in this study. 3.2. Effect of Sugar on the Tg of Baked Samples 3.2.1. Effect of Trehalose Concentration on Baked Samples Tg Figure 2 shows the plot of Tg as a function of trehalose concentration. The trend shows that both trehalose- buffer solutions Tg asymptotically approach approximately 105˚C upon increasing trehalose concentration. The tre- halose-tris samples increased their Tg too from a low starting point due to tris’ low Tg value. Figure 2 also shows that for trehalose-citrate samples fell towards the 105˚C value due to the elevated Tg of citrate. Trehalose tris buffer at 0.713g trehalose/g tris concentration showed 0 20 0 24 6 8101214 Time (weeks) 40 60 80 100 120 140 DBMC (a) 0 0246810121 Time (weeks) 5 10 15 20 4 DBMC (b) Figure 1. (a) Shows the drying kinetics of trehalose tris solu- tions in our 7% humidity environment. The blue diamonds (♦) represent the drying kinetics of 0.713g trehalose/g tris, the pink square (■) represents 2.85g trehalose/g tris, and the yellow triangle (▲) represents 11.41g trehalose/g tris. The second graph is a zoomed view showing the equilibra- tion of samples over time. an average Tg of approximately 30˚C. As trehalose con tent was then increased to 11.41g trehalose/ g tris the av- erage glass transition increased to around 106˚ C. When using the citrate buffer the lowest trehalose concentration of 1.485 g trehalose/g citrate produced an average glass transition temperature of approximately 125˚C. When our trehalose mass ratio was increased to 23.76g trehalose/g citrate an average Tg of approximately 102˚C was ob- served. During the heating and cooling of samples no crystallization was present in any of the thermographs irrespective of the salt/sugar mixture content. The trendli- nes in the figure, which were fitted using the Gordon Taylor model, show that the values for Tg assimilate themselves with the majority mass fraction component of the solution. Samples with low sugar concentrations as- similated Tg’s with the buffer involved (tris Tg ≈28.6°C citrate Tg ≈130°C) and move towards that of trehalose (Tg≈115°C).  598 J. Reis et al. / J. Biomedical Science and Engineering 2 (2009) 594-605 SciRes Copyright © 2009 JBiSE 0 20 0510 1520 25 g trehalose / g buffer 40 60 80 100 120 140 160 Tg (˚C) Figure 2. Shows glass transition as a function of treha- lose concentration. The square blocks (■) represent the trehalose with citrate buffer while the diamond symbol (♦) show trehalose combined with tris buffer. The figure also depicts the Gordon Taylor depicted by the black dashed lines. 3.2.2. Effect of Sucrose Content on Baked Samples Tg Figure 3 suggests the Tg of sucrose glasses as a function of sucrose concentration. Sucrose glasses demonstrated a similar asymptotic behavior with increasing sucrose content. Sucrose-tris samples showed an increase in their glass transition as sucrose concentration increased be- cause pure sucrose has a larger Tg than tris. Sucrose- citrate samples showed a decrease in Tg as sucrose con- centration was increased as the Tg of sucrose is below that of what we found for citrate. At mass ratio 0.713g sucrose/g tris, the average Tg was 45˚C. When sucrose concentration was increased 11.41 g sucrose/g tris the samples produced and average Tg of 48˚ C. The 1.485 g sucrose/g citrate concentration samples average glass transition temperature was approximately 103˚ C. As our mass ratio of sucrose increased all the way to a concen- tration of 23.76 g sucrose/g citrate the glass transition fell to approximately 46˚C. The trendlines fitted to the experiment data show that the samples follow the Gordon Taylor model of the two component models. Similar to the trehalose results, Tg assimilates itself with the majority fraction of the samples. The data sets ex- hibit a trend of approaching a Tg slightly below that of pure sucrose (Tg≈60˚C) as the concentration of sucrose increases. 3.3. Role of Moisture in Modulating Thermophysical Behavior of Sugar Based Buffers First, water activity curves were generated from sample weight measurements taken after equilibration under different relative humidity environments used in the calculation of DBMC. These curves allowed us to de- termine effect of both sugars and buffers to retain mois- ture at equilibrium, and determine the Tg of the solution. In the corresponding sections we show sample plots of 0 0510 15 20 25 g sucrose / g buffer 20 40 60 80 100 120 140 Tg (°C) Figure 3. Shows glass transition as a function of sucrose concentration. The diamond symbol (♦) represents the su- crose with tris buffer while the square blocks (■) show su- crose combined with citrate buffer. Gordon Taylor model- ing is depicted by the black dashed lines. DBMC vs. aw and Tg vs. DBMC for a high and low sugar-buffer combination. Finally, we show the 3-D sur- face contour of Tg as a function of moisture and sugar content by using the Gordon Taylor equation. 3.3.1. Effect of Moisture on Trehalose Tris Solutions Figure 4 shows that over the range of relative humidity environments trehalose tris samples tended to equilibrate to specific moisture contents and then hold this in the range. The lower concentration of 0.713g trehalose / g tris show an initial jump in residual moisture content followed by a leveling in the 0.07 to 0.21 aw where points are statistically the same (p>0.05). We then show a significant increase in moisture from aw of 0.21 to 0.53 (p<0.05). The 11.41 g. trehalose/g. tris concentration solution shows a similar trend however after the initial jump in moisture the next successive four points are sta- tistically the same (p>0.05). The figure also shows that residual moisture content was affected by trehalose con- centration in the solution. Under similar equilibration environment, solutions containing higher concentrations 0 5 10 15 20 25 30 35 00.1 0.20.30.40.50.6 Aw DBMC Figure 4. Shows trehalose tris solutions DBMC as a function of water activity. The diamond symbol (♦) represents 0.713g trehalose/g tris, while the square blocks (■) show 11.41 g trehalose/g tris. 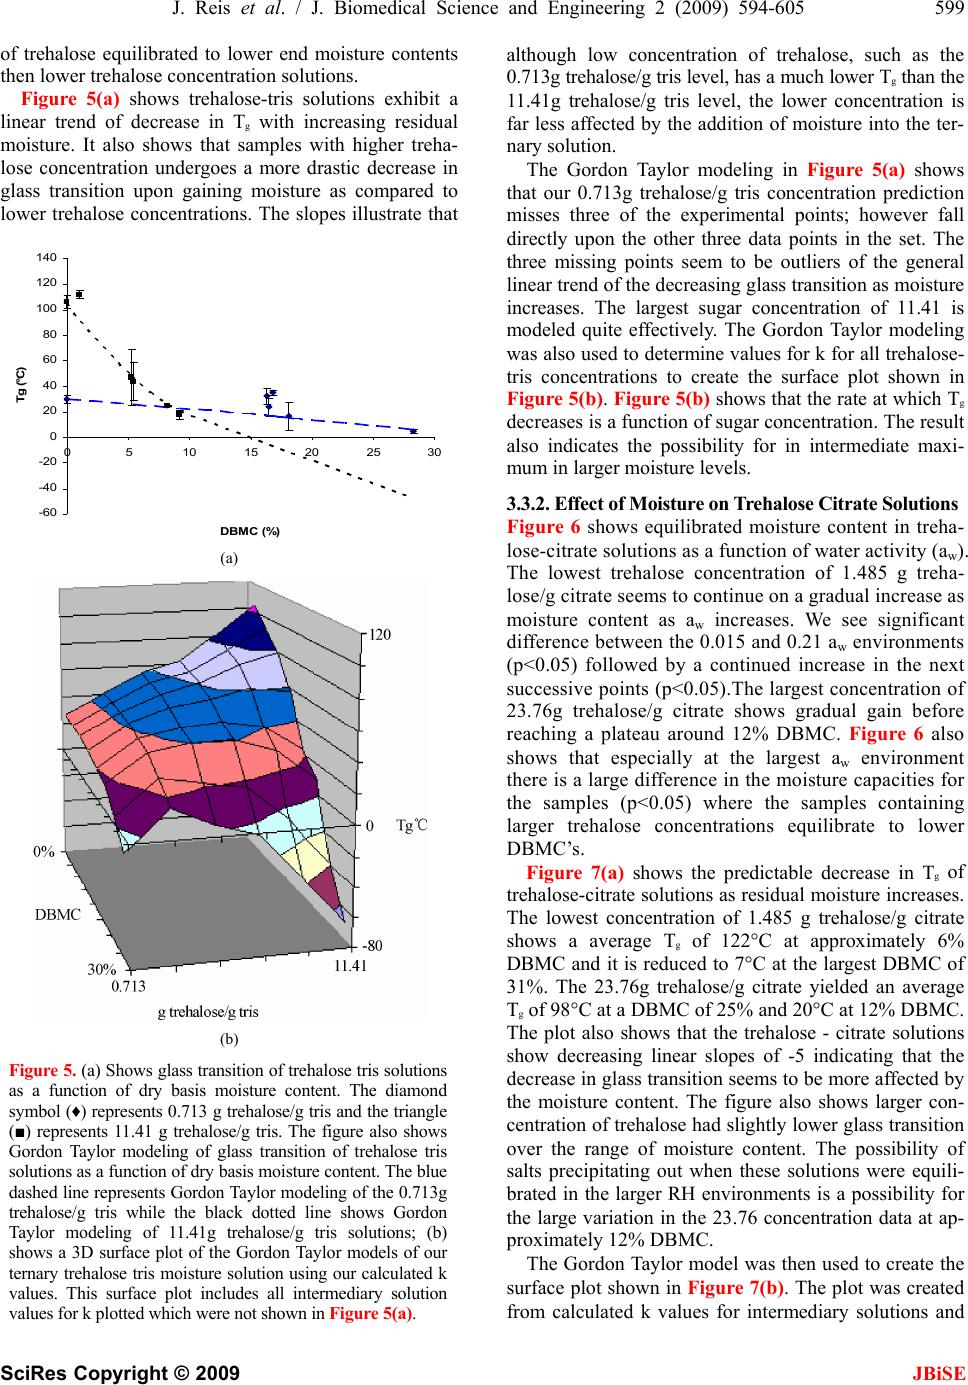 J. Reis et al. / J. Biomedical Science and Engineering 2 (2009) 594-605 599 SciRes Copyright © 2009 of trehalose equilibrated to lower end moisture contents then lower trehalose concentration solutions. although low concentration of trehalose, such as the 0.713g trehalose/g tris level, has a much lower Tg than the 11.41g trehalose/g tris level, the lower concentration is far less affected by the addition of moisture into the ter- nary solution. Figure 5(a) shows trehalose-tris solutions exhibit a linear trend of decrease in Tg with increasing residual moisture. It also shows that samples with higher treha- lose concentration undergoes a more drastic decrease in glass transition upon gaining moisture as compared to lower trehalose concentrations. The slopes illustrate that The Gordon Taylor modeling in Figure 5(a) shows that our 0.713g trehalose/g tris concentration prediction misses three of the experimental points; however fall directly upon the other three data points in the set. The three missing points seem to be outliers of the general linear trend of the decreasing glass transition as moisture increases. The largest sugar concentration of 11.41 is modeled quite effectively. The Gordon Taylor modeling was also used to determine values for k for all trehalose- tris concentrations to create the surface plot shown in Figure 5(b). Figure 5(b) shows that the rate at which Tg decreases is a function of sugar concentration. The result also indicates the possibility for in intermediate maxi- mum in larger moisture levels. -60 -40 -20 0 20 40 60 80 100 120 140 051015 2025 30 DBMC (%) Tg (°C) 3.3.2. Effect of Moisture on Trehalose Citrate Solutions Figure 6 shows equilibrated moisture content in treha- lose-citrate solutions as a function of water activity (aw). The lowest trehalose concentration of 1.485 g treha- lose/g citrate seems to continue on a gradual increase as (a) moisture content as aw increases. We see significant difference between the 0.015 and 0.21 aw environments (p<0.05) followed by a continued increase in the next successive points (p<0.05).The largest concentration of 23.76g trehalose/g citrate shows gradual gain before reaching a plateau around 12% DBMC. Figure 6 also shows that especially at the largest aw environment there is a large difference in the moisture capacities for the samples (p<0.05) where the samples containing larger trehalose concentrations equilibrate to lower DBMC’s. Figure 7(a) shows the predictable decrease in Tg of trehalose-citrate solutions as residual moisture increases. The lowest concentration of 1.485 g trehalose/g citrate shows a average Tg of 122°C at approximately 6% DBMC and it is reduced to 7°C at the largest DBMC of 31%. The 23.76g trehalose/g citrate yielded an average Tg of 98°C at a DBMC of 25% and 20°C at 12% DBMC. The plot also shows that the trehalose - citrate solutions show decreasing linear slopes of -5 indicating that the decrease in glass transition seems to be more affected by the moisture content. The figure also shows larger con- centration of trehalose had slightly lower glass transition over the range of moisture content. The possibility of salts precipitating out when these solutions were equili- brated in the larger RH environments is a possibility for the large variation in the 23.76 concentration data at ap- proximately 12% DBMC. (b) Figure 5. (a) Shows glass transition of trehalose tris solutions as a function of dry basis moisture content. The diamond symbol (♦) represents 0.713 g trehalose/g tris and the triangle (■) represents 11.41 g trehalose/g tris. The figure also shows Gordon Taylor modeling of glass transition of trehalose tris solutions as a function of dry basis moisture content. The blue dashed line represents Gordon Taylor modeling of the 0.713g trehalose/g tris while the black dotted line shows Gordon Taylor modeling of 11.41g trehalose/g tris solutions; (b) shows a 3D surface plot of the Gordon Taylor models of our ternary trehalose tris moisture solution using our calculated k values. This surface plot includes all intermediary solution values for k plotted which were not shown in Figure 5(a). The Gordon Taylor model was then used to create the surface plot shown in Figure 7(b). The plot was created from calculated k values for intermediary solutions and JBiSE 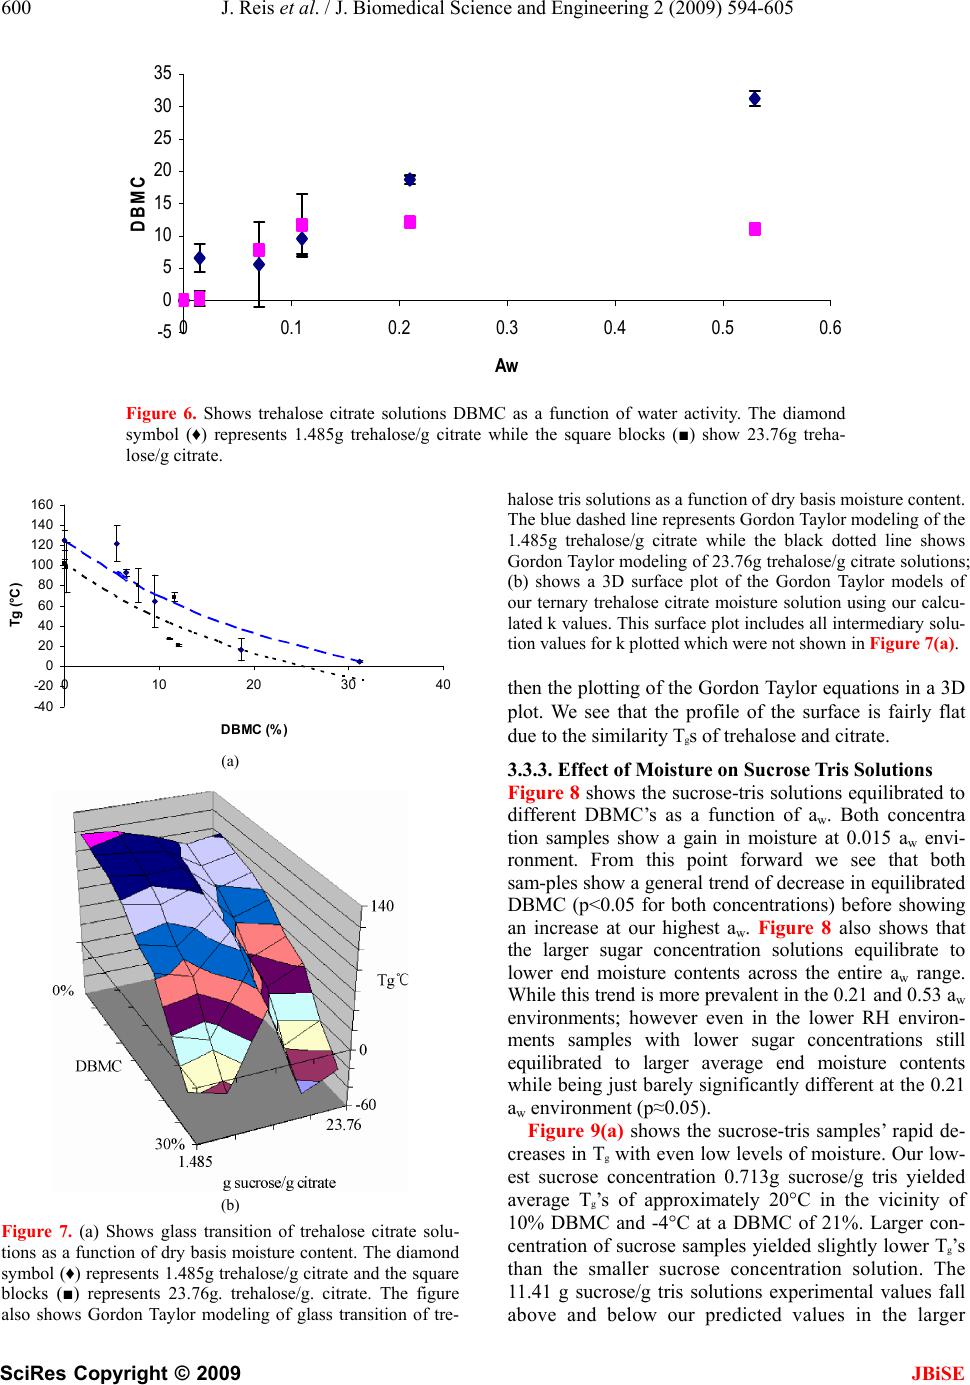 600 J. Reis et al. / J. Biomedical Science and Engineering 2 (2009) 594-605 SciRes Copyright © 2009 JBiSE -5 0 5 10 15 20 25 30 35 00.1 0.2 0.3 0.4 0.5 0.6 Aw DBMC Figure 6. Shows trehalose citrate solutions DBMC as a function of water activity. The diamond symbol (♦) represents 1.485g trehalose/g citrate while the square blocks (■) show 23.76g treha- lose/g citrate. -40 -20 0 20 40 60 80 100 120 140 160 Tg (°C) 010203040 DBMC (%) (a) (b) Figure 7. (a) Shows glass transition of trehalose citrate solu- tions as a function of dry basis moisture content. The diamond symbol (♦) represents 1.485g trehalose/g citrate and the square blocks (■) represents 23.76g. trehalose/g. citrate. The figure also shows Gordon Taylor modeling of glass transition of tre- halose tris solutions as a function of dry basis moisture content. The blue dashed line represents Gordon Taylor modeling of the 1.485g trehalose/g citrate while the black dotted line shows Gordon Taylor modeling of 23.76g trehalose/g citrate solutions; (b) shows a 3D surface plot of the Gordon Taylor models of our ternary trehalose citrate moisture solution using our calcu- lated k values. This surface plot includes all intermediary solu- tion values for k plotted which were not shown in Figure 7(a). then the plotting of the Gordon Taylor equations in a 3D plot. We see that the profile of the surface is fairly flat due to the similarity Tgs of trehalose and citrate. 3.3.3. Effect of Moisture on Sucrose Tris Solutions Figure 8 shows the sucrose-tris solutions equilibrated to different DBMC’s as a function of aw. Both concentra tion samples show a gain in moisture at 0.015 aw envi- ronment. From this point forward we see that both sam-ples show a general trend of decrease in equilibrated DBMC (p<0.05 for both concentrations) before showing an increase at our highest aw. Figure 8 also shows that the larger sugar concentration solutions equilibrate to lower end moisture contents across the entire aw range. While this trend is more prevalent in the 0.21 and 0.53 aw environments; however even in the lower RH environ- ments samples with lower sugar concentrations still equilibrated to larger average end moisture contents while being just barely significantly different at the 0.21 aw environment (p≈0.05). Figure 9(a) shows the sucrose-tris samples’ rapid de- creases in Tg with even low levels of moisture. Our low- est sucrose concentration 0.713g sucrose/g tris yielded average Tg’s of approximately 20°C in the vicinity of 10% DBMC and -4°C at a DBMC of 21%. Larger con- centration of sucrose samples yielded slightly lower Tg’s than the smaller sucrose concentration solution. The 11.41 g sucrose/g tris solutions experimental values fall above and below our predicted values in the larger 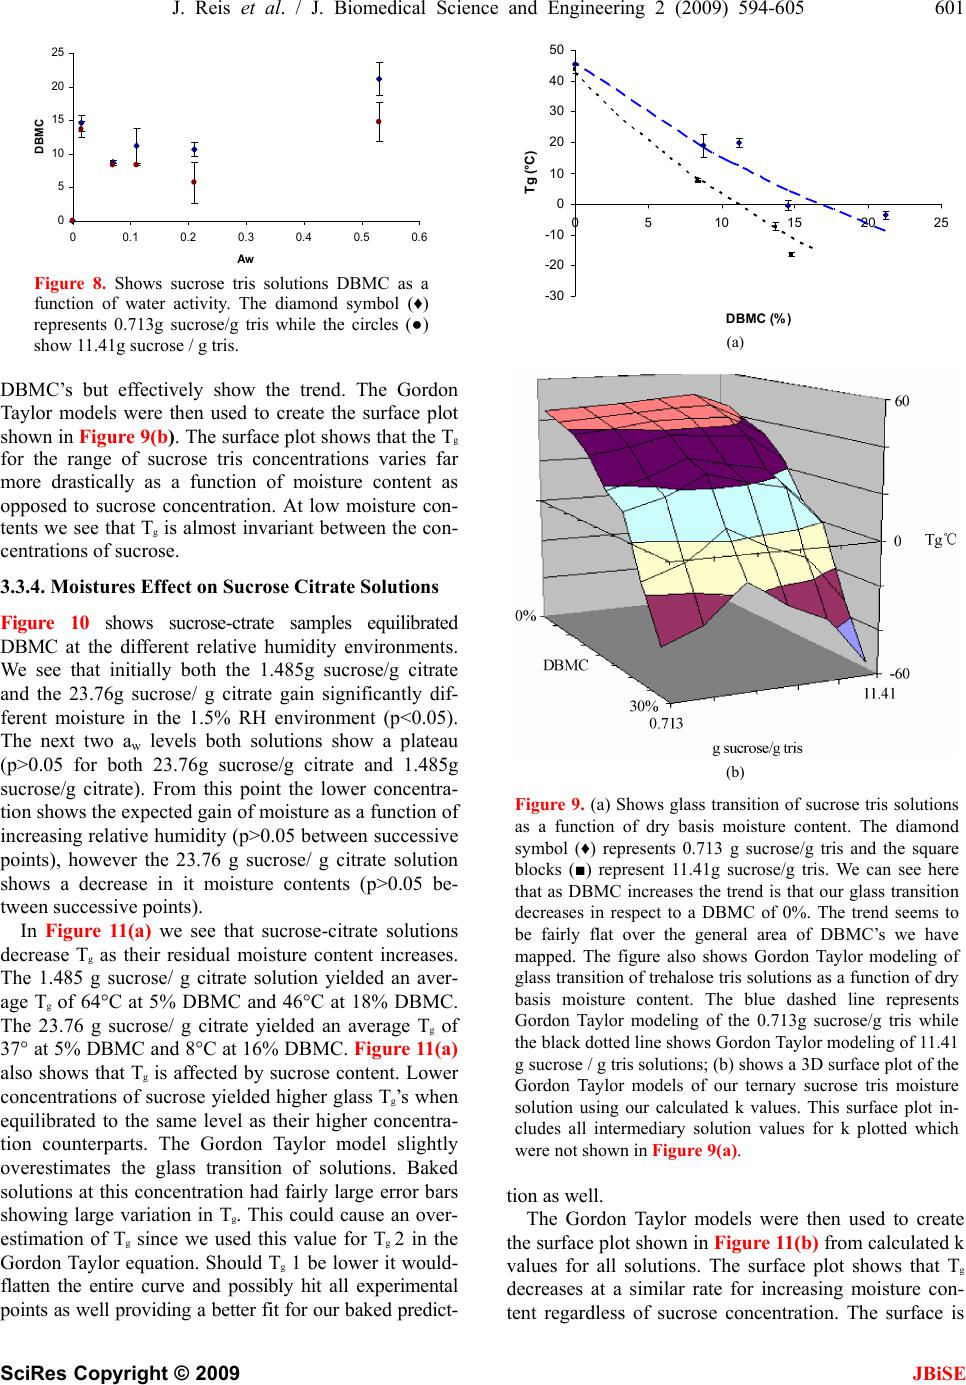 J. Reis et al. / J. Biomedical Science and Engineering 2 (2009) 594-605 601 SciRes Copyright © 2009 JBiSE -30 -20 -10 0 10 20 30 40 50 05101520 25 DBMC 0 5 10 15 20 25 00.1 0.2 0.3 0.4 0.5 0.6 Aw DBM C Tg (°C) Figure 8. Shows sucrose tris solutions DBMC as a function of water activity. The diamond symbol (♦) represents 0.713g sucrose/g tris while the circles (●) show 11.41g sucrose / g tris. DBMC’s but effectively show the trend. The Gordon Taylor models were then used to create the surface plot shown in Figure 9(b). The surface plot shows that the Tg for the range of sucrose tris concentrations varies far more drastically as a function of moisture content as opposed to sucrose concentration. At low moisture con- tents we see that Tg is almost invariant between the con- centrations of sucrose. 3.3.4. Moistures Effect on Sucrose Citrate Solutions Figure 10 shows sucrose-ctrate samples equilibrated DBMC at the different relative humidity environments. We see that initially both the 1.485g sucrose/g citrate and the 23.76g sucrose/ g citrate gain significantly dif- ferent moisture in the 1.5% RH environment (p<0.05). The next two aw levels both solutions show a plateau (p>0.05 for both 23.76g sucrose/g citrate and 1.485g sucrose/g citrate). From this point the lower concentra- tion shows the expected gain of moisture as a function of increasing relative humidity (p>0.05 between successive points), however the 23.76 g sucrose/ g citrate solution shows a decrease in it moisture contents (p>0.05 be- tween successive points). In Figure 11(a) we see that sucrose-citrate solutions decrease Tg as their residual moisture content increases. The 1.485 g sucrose/ g citrate solution yielded an aver- age Tg of 64°C at 5% DBMC and 46°C at 18% DBMC. The 23.76 g sucrose/ g citrate yielded an average Tg of 37° at 5% DBMC and 8°C at 16% DBMC. Figure 11(a) also shows that Tg is affected by sucrose content. Lower concentrations of sucrose yielded higher glass Tg’s when equilibrated to the same level as their higher concentra- tion counterparts. The Gordon Taylor model slightly overestimates the glass transition of solutions. Baked solutions at this concentration had fairly large error bars showing large variation in Tg. This could cause an over- estimation of Tg since we used this value for Tg 2 in the Gordon Taylor equation. Should Tg 1 be lower it would- flatten the entire curve and possibly hit all experimental points as well providing a better fit for our baked predict- ( % ) (a) (b) Figure 9. (a) Shows glass transition of sucrose tris solutions as a function of dry basis moisture content. The diamond symbol (♦) represents 0.713 g sucrose/g tris and the square blocks (■) represent 11.41g sucrose/g tris. We can see here that as DBMC increases the trend is that our glass transition decreases in respect to a DBMC of 0%. The trend seems to be fairly flat over the general area of DBMC’s we have mapped. The figure also shows Gordon Taylor modeling of glass transition of trehalose tris solutions as a function of dry basis moisture content. The blue dashed line represents Gordon Taylor modeling of the 0.713g sucrose/g tris while the black dotted line shows Gordon Taylor modeling of 11.41 g sucrose / g tris solutions; (b) shows a 3D surface plot of the Gordon Taylor models of our ternary sucrose tris moisture solution using our calculated k values. This surface plot in- cludes all intermediary solution values for k plotted which were not shown in Figure 9(a). tion as well. The Gordon Taylor models were then used to create the surface plot shown in Figure 11(b) from calculated k values for all solutions. The surface plot shows that Tg decreases at a similar rate for increasing moisture con- tent regardless of sucrose concentration. The surface is  602 J. Reis et al. / J. Biomedical Science and Engineering 2 (2009) 594-605 SciRes Copyright © 2009 JBiSE similar to a plane in which all solutions undergo the same rate of decreasing Tg with residual moisture with the difference in levels being a function of baked solu- tions Tg. 0 5 10 15 20 25 00.1 0.2 0.30.4 0.5 0.6 Aw DBMC 4. DISCUSSION The current thermophysical study of the ternary solu- tions was driven by a larger goal of obtaining optimal excipient conditions for desiccation preservation of mammalian cells. Majority of studies showing the sugar stabilization effects are derived from the food preserva- tion or pharmaceutical literature [28,29,30,31,32]. Di- saccharides, particularly trehalose and sucrose, have shown to be important in the preservation of cells and biologics [2,3,4,5,6,7,9,10,11]. These sugars exhibit lar- ger glass transition temperatures and possess excellent water replacement abilities. In combination with these sugars, tris and citrate salts were chosen for being indus- try standards for bovine sperm preservation [18,19,20, 33]. The complicated ternary solutions in this study were chosen based upon previous research showing their abil- ity to sustain cellular life. The thermophysical properties of preservation medium were important in understanding which would be applicable as a desiccation medium. Solutions which undergo glass transition at less than ambient are clearly not appropriate since stability of me- dium is essential. 4.1. Baked Samples The completely dried samples behaved exactly as the Gordon Taylor (Fox equation) two-component model predicted [12]. The variation in Tg of a given sugar- buffer mixture was a function of the glass transition of each component and its weight fraction. Similar trend for other mixtures have been observed in varying de- grees by several studies [6,12]. The Tg of trehalose-tris and Trehalose-citrate mixtures converged to a limit of 105°C as trehalose concentration increased. The limit was approached both from above and below as the tris and citrate buffer were found to have a Tg at approximately 28.6°C and 133°C respec- tively. Though we would expect Tg to reach that of the pure sugar, extrapolation out to the pure limit may not be accurate for complex materials containing salts as de- scribed by Mazzobre et al [34]. Since we approach this limit from very different starting points, we assume that the lowered limit for Tg is caused by a common sub- stance found in both biological buffers, in our case the citric acid monohydrate. This commonality between the buffers could be the most logical reason for both solu- tions to approach a common Tg roughly 10°C below that of pure trehalose. The deviation from the expected limit of the pure substance has been shown in previous studies in the literature. Jeong-Ah Seo and coworkers demon- strated that when different monosaccharides are com- bined with disaccharides, glass transition deviated from Figure 10. Shows sucrose citrate solutions DBMC as a function of water activity. The diamond symbol (♦) repre- sents 1.485g sucrose/g citrate while the circles (●) show 23.76g sucrose/g citrate. -40 -20 0 20 40 60 80 100 120 140 0510 15 20 DBMC (%) Tg (°C) (a) (b) Figure 11. (a) Shows glass transition of sucrose citrate so- lutions as a function of dry basis moisture content. The diamond symbol (♦) represents 1.485g sucrose / g citrate and the square blocks (■) represent 23.76g sucrose/g citrate; (b) shows a 3D surface plot of the Gordon Taylor models of our ternary sucrose citrate moisture solution using our cal- culated k values. This surface plot includes all intermediary solution values for k plotted which were not shown in Fig- ure 11(a). 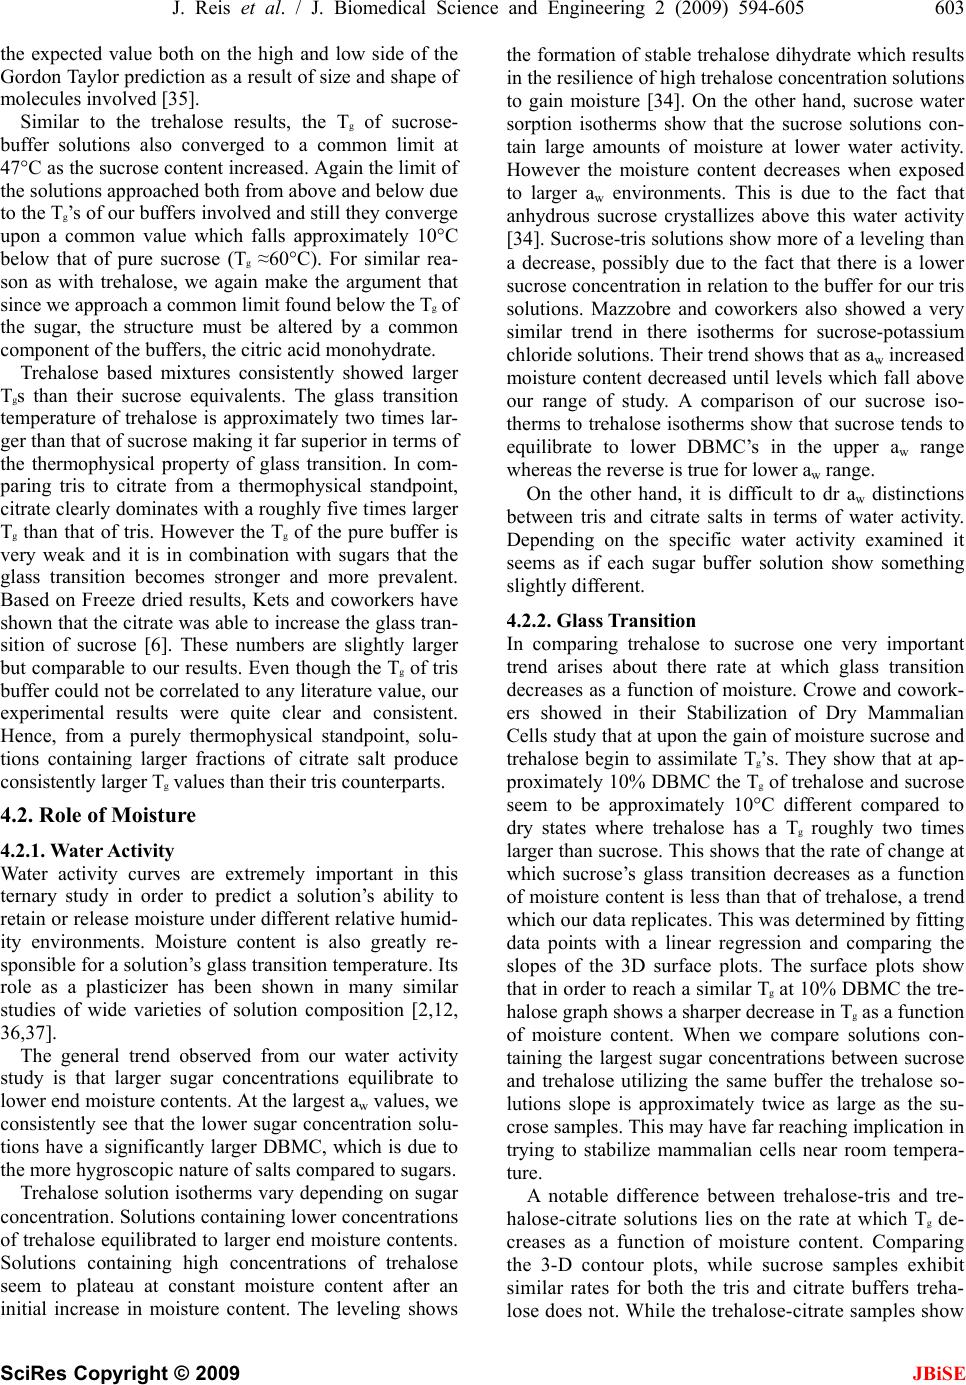 J. Reis et al. / J. Biomedical Science and Engineering 2 (2009) 594-605 603 SciRes Copyright © 2009 JBiSE the expected value both on the high and low side of the Gordon Taylor prediction as a result of size and shape of molecules involved [35]. Similar to the trehalose results, the Tg of sucrose- buffer solutions also converged to a common limit at 47°C as the sucrose content increased. Again the limit of the solutions approached both from above and below due to the Tg’s of our buffers involved and still they converge upon a common value which falls approximately 10°C below that of pure sucrose (Tg ≈60°C). For similar rea- son as with trehalose, we again make the argument that since we approach a common limit found below the Tg of the sugar, the structure must be altered by a common component of the buffers, the citric acid monohydrate. Trehalose based mixtures consistently showed larger Tgs than their sucrose equivalents. The glass transition temperature of trehalose is approximately two times lar- ger than that of sucrose making it far superior in terms of the thermophysical property of glass transition. In com- paring tris to citrate from a thermophysical standpoint, citrate clearly dominates with a roughly five times larger Tg than that of tris. However the Tg of the pure buffer is very weak and it is in combination with sugars that the glass transition becomes stronger and more prevalent. Based on Freeze dried results, Kets and coworkers have shown that the citrate was able to increase the glass tran- sition of sucrose [6]. These numbers are slightly larger but comparable to our results. Even though the Tg of tris buffer could not be correlated to any literature value, our experimental results were quite clear and consistent. Hence, from a purely thermophysical standpoint, solu- tions containing larger fractions of citrate salt produce consistently larger Tg values than their tris counterparts. 4.2. Role of Moisture 4.2.1. Water Activity Water activity curves are extremely important in this ternary study in order to predict a solution’s ability to retain or release moisture under different relative humid- ity environments. Moisture content is also greatly re- sponsible for a solution’s glass transition temperature. Its role as a plasticizer has been shown in many similar studies of wide varieties of solution composition [2,12, 36,37]. The general trend observed from our water activity study is that larger sugar concentrations equilibrate to lower end moisture contents. At the largest aw values, we consistently see that the lower sugar concentration solu- tions have a significantly larger DBMC, which is due to the more hygroscopic nature of salts compared to sugars. Trehalose solution isotherms vary depending on sugar concentration. Solutions containing lower concentrations of trehalose equilibrated to larger end moisture contents. Solutions containing high concentrations of trehalose seem to plateau at constant moisture content after an initial increase in moisture content. The leveling shows the formation of stable trehalose dihydrate which results in the resilience of high trehalose concentration solutions to gain moisture [34]. On the other hand, sucrose water sorption isotherms show that the sucrose solutions con- tain large amounts of moisture at lower water activity. However the moisture content decreases when exposed to larger aw environments. This is due to the fact that anhydrous sucrose crystallizes above this water activity [34]. Sucrose-tris solutions show more of a leveling than a decrease, possibly due to the fact that there is a lower sucrose concentration in relation to the buffer for our tris solutions. Mazzobre and coworkers also showed a very similar trend in there isotherms for sucrose-potassium chloride solutions. Their trend shows that as aw increased moisture content decreased until levels which fall above our range of study. A comparison of our sucrose iso- therms to trehalose isotherms show that sucrose tends to equilibrate to lower DBMC’s in the upper aw range whereas the reverse is true for lower aw range. On the other hand, it is difficult to dr aw distinctions between tris and citrate salts in terms of water activity. Depending on the specific water activity examined it seems as if each sugar buffer solution show something slightly different. 4.2.2. Glass Transition In comparing trehalose to sucrose one very important trend arises about there rate at which glass transition decreases as a function of moisture. Crowe and cowork- ers showed in their Stabilization of Dry Mammalian Cells study that at upon the gain of moisture sucrose and trehalose begin to assimilate Tg’s. They show that at ap- proximately 10% DBMC the Tg of trehalose and sucrose seem to be approximately 10°C different compared to dry states where trehalose has a Tg roughly two times larger than sucrose. This shows that the rate of change at which sucrose’s glass transition decreases as a function of moisture content is less than that of trehalose, a trend which our data replicates. This was determined by fitting data points with a linear regression and comparing the slopes of the 3D surface plots. The surface plots show that in order to reach a similar Tg at 10% DBMC the tre- halose graph shows a sharper decrease in Tg as a function of moisture content. When we compare solutions con- taining the largest sugar concentrations between sucrose and trehalose utilizing the same buffer the trehalose so- lutions slope is approximately twice as large as the su- crose samples. This may have far reaching implication in trying to stabilize mammalian cells near room tempera- ture. A notable difference between trehalose-tris and tre- halose-citrate solutions lies on the rate at which Tg de- creases as a function of moisture content. Comparing the 3-D contour plots, while sucrose samples exhibit similar rates for both the tris and citrate buffers treha- lose does not. While the trehalose-citrate samples show  604 J. Reis et al. / J. Biomedical Science and Engineering 2 (2009) 594-605 SciRes Copyright © 2009 JBiSE a rapid decrease in their glass transition upon the arri- val of moisture, the trehalose tris-samples are far less affected. When comparing tris and citrate buffers samples, the major difference is that the rate at which Tg decreases as a function of moisture content varies between the buffers. Comparing the 3D plots 7b and 11b, both sugars in combination with the citrate buffer show fairly constant rates of decreasing glass transition within that particular sugar buffer solutions range of sugar concentration. Tris samples on the other hand show a more varied rate which seems to increase as a function of sugar concen- tration. While sucrose-tris samples seem to present a very slight increase in the rate at which Tg decreases with increasing moisture, trehalose-tris samples show large variation in their slope of their 3D surface contour. The lowest concentration of trehalose exhibits a slope of ap- proximately -1 in as a function of moisture content while our largest trehalose concentration produces a signifi- cantly larger slope of approximately -10 almost identical rates for Tg of trehalose water solutions. This is a clear difference between the tris and citrate buffer. 4.2.3. Modeling of Glass Transition The use of the Gordon Taylor was chosen for its accu- racy and overall simplicity. Other far more complex equations such as Millers equation and the Miller-Fox equation include specific component parameters such as excess thermal expansion coefficient and excess volume coefficients. Our buffer solution in itself is a complicated solution making these coefficients difficult to determine. Shah and Schall compared the Fox, Miller, and Miller Fox’s equations ability to predict Tg [12]. When we look at the percent differences of the data which they compare to the experimental data we see that even for the least precise Fox equation the percent differences all fall be- low 9%. Without any given standard deviations of their experimental data it is difficult to even further comment on deviations between experimental and model data. When we examined the average percent difference for Shah and Schall work, we see that the Miller Fox equa- tion is the most accurate with an average 1.86% percent difference while the least accurate Fox equation falls in at an average 2.98%. The additional 1% average accu- racy hardly seems to warrant the usage of the far more complex equation. 5. OVERALL CONCLUSIONS Increasing sugar concentration allows solutions to equilibrate at lower moisture contents. Trehalose solutions yielded larger values for Tg at lower moisture contents than their sucrose counterparts. Citrate solutions yielded larger glass transitions than their tris counterparts. The rate of change of Tg with moisture content, d Tg /d (moisture content), had very different behavior depend- ing on which sugar was present as the excepient. While sucrose content did not change that behavior, the pres- ence of trehalose had a strong influence-an increasing trehalose concentration caused solutions to increase d Tg /d (moisture content) when compared to lower trehalose solutions. Based on the current results, a combination of treha- lose and citrate would be the preferred composition for storage applications. REFERENCES [1] M. Jochem and C. H. Kỡrber. (1987) Extended phase diagrams for the ternary solutions H2O-NaCl-glycerol and H2O-NaCl-hydroxyethylstarch (HES) determined by DSC. Cryobiology, 24, 513–536. [2] A. H. Al-Muhtaseb, W. A. M. McMinn, and T. R. A. Magee (2004) Water sorption isotherms of starch pow- ders Part 1: mathematical description of experimental data. Journal of Food Engineering, 61, 297–307. [3] J. H. Crowe, K. H. Nguyen, F. A. Hoekstra and L. M. Crowe. (1996) Is vitrification involved in depression of the phase transition temperature in dry phospholipids? Biochimica et Biophysica Acta, 1280, 187–196. [4] I. S. Davis, R. W. Bratton and R. H. Foote. (1993) Livability of bovine spermatozoa at 5, -25, and -85°C in tris-buffered and citrate-buffered yolk glycerol extenders. Journal of Dairy Scence, 46, 333–336. [5] Gordon and J. S. Taylor (1952) Ideal co-polymers and the second order transitions of synthetic rubbers. Journal of Applied Chemistry, 2, 493–500. [6] E. P. W. Kets, P. J. IJpelaar, F. A. Hoekstra and H. Vro- mans. (2004) Citrate increases glass transition tempera- ture of vitrified sucrose preparations. Cryobiology, 48, 46–54. [7] S. B. Leslie, E. Israeli, B. Lighthart, L. M. Crowe and J. H. Crowe. (1995) Trehalose and sucrose protect both membranes and proteins in intact bacteria during drying. Applied and Environmental Microbiology, 61, 3592– 3597. [8] T. Chen, S. Bhowmick, A. Sputtek, A. Fowler and M. Toner. (2002) The glass transition temperature of mix- tures of trehalose and hydroxyethyl starch. Cryobiology, 44, 301–306. [9] L. M. Crowe, D. S. Reid and J. H. Crowe. (1996) Is tre- halose special for preserving dry biomaterials? Bio- physical Journal, 71, 2087–2093. [10] M. E. Elias and A. M. Elias. (1999) Trehalose and water fragile system: properties and glass transition. Journal of Molecular Liquids, 83, 303–310. [11] A. Eroglu, M. Russo, R. Bieganski, A. Fowler, S. Cheley, H. Bayley and M. Toner, (2000) Intracellular trehalose improves the survival of cryopreserved mammalian cells. Nature Biotechnology, 18, 163–167. [12] B. Shah and C. A. Schall. (2006) Measurement and mod- eling of the glass transition temperatures of multi-com- ponent solutions. Thermochimica Acta, 443, 78–86. [13] J. H. Crowe and L. M. Crowe. (2000) Preservation of mammalian cells-learning nature’s tricks. Nature Bio- technology, 18, 145.  J. Reis et al. / J. Biomedical Science and Engineering 2 (2009) 594-605 605 SciRes Copyright © 2009 JBiSE [14] C. J. Roberts and F. Franks. (1996) Crystalline and amorphous phases in the binary system water-beta, beta- trehalose. Journal of Chemical Society, 92, 1337–1343. [15] H. A. Tajmir-Riahi, M. Naoui and S. Diamantoglou. (1994) DNA-carbohydreate interaction. The effects of mono-and disaccharides on the solution structure of calf thymus DNA. Journal of Biomolecular Structure and Dynamics, 12, 217–234. [16] S. L. Shamblin and G. Zografi. (1999) The effects of absorbed water on the properties of amorphous mixtures containing sucrose. Pharmaceutical Research, 16, 1119– 1124. [17] W. F. Wolkers, H. Oldenhof, M. Alberda and F. A. Hoek- stra. (1998) A fourier transform microspectroscopy study of sugar glasses: Application to anhydrobiotic higher plant cells. Biochimica et Biophysica Acta, 1379, 83–96. [18] J. H. Crowe, L. M. Crowe, W. E. Wolkers, A. E. Oliver, X. Ma, J. H. Auh, M. Tang, S. Zhu, J. Norris and F. Tablin. (2005) Stabilization of dry mammalian cells: lessons from nature. Integrative and Comparative Biology 45, 810–820. [19] R. H. Foote. (2002) The History of Artificial Insemina- tion; Selected Notes and Notables. Journal Animal Scence, 80, 1–10. [20] R. H. Foote, I. S. Davis and R. W. Bratton. (1962) Sur- vival of bovine spermatozoa at room temperature in cit- rate and cornell university and tris extenders containing whole and fractionated coconut milk. Journal of Dairy Science. 45, 1383–1391. [21] L. Ijaz, A. G. Hunter and E. F. Graham. (1989) Identifica- tion of the capacitating agent for bovine sperm in egg- yolk TEST semen extenders. Journal of Dairy Science, 72, 2700–2706. [22] L. S. Taylor and P. York. (1998) Characterization of the phase transitions of trehalose dihydrate on heating and subsequent dehydration. Journal of Pharmaceutical Sci- ences, 87, 347–355. [23] J. H. Crowe, J. F. Carpenter and L. M. Crowe. (1998) The role of vitrification in anhydrobiosis. Annual Review of Physiology, 60, 73–103. [24] W. Q. Sun, A. C. Leopold, L. M. Crowe and J. H. Crowe. (1996) Stability of dry liposomes in sugar glasses. Bio- physical Journal, 70, 1769–1776. [25] F. Sussich, C. Skopec, J. Brady and A. Cesaro. (2001) Reversible dehydration of trehalose and anhydrobiosis: from solution state to an exotic crystal? Carbohydrate Research, 334, 165–176. [26] J. R. Green. (2005) Isothermal desiccation and thermo- physical properties of trehalose-water mixtures, A thesis in mechanical engineering, University of Masachusetts at Dartmouth. [27] R. Sitaula and S. Bhowmick. (2006) A study of the thermophysical properties and moisture sorption chara- cteristics of trehalose-PBS glasses. Cryobiology, 52, 369–385. [28] T. P. Labuza, A. Kaanane and J. Y. Chen. (1985) Effect of temperature on the moisture sorption isotherms and water activity shift of two dehydrated foods, Journal of Food Science, 50, 385–391. [29] A. M. Lammart, S. J. Schmidt and G. A. Day. (1998) Water activity and solubility of trehalose. Food Chemis- try, 61, 139–144. [30] D. P. Miller, J. J. de Pablo and H. R. Corti. (1997) Ther- mophysical properties of trehalose and its concentrated aqueous solutions. Pharmaceutical Research, 14, 578– 590. [31] S. L. Shamblin and G. Zografi. (1998) Enthalpy relaxa- tion in binary amorphous mixtures containing sucrose. Pharmaceutical Research, 15, 1828–1834. [32] S. L. Shamblin and G. Zografi. (1999) The effects of absorbed water on the properties of amorphous mixtures containing sucrose. Pharmaceutical Research, 16, 1119– 1124. [33] R. W. Bratton and R. H. Foote. (1999) Fertility of bull sperm frozen and stored in clarified egg yolk-tris- glyc- erol extender. Journal of Dairy Science, 82, 817–821. [34] M. F. Mazzobre, M. P. Longinotti, H. R. Corti and M. P. Buera. (2001) Effect of salts on the properties of aqueous sugar systems, in relation to biomaterial stabilization. 1. water sorption behavior and ice crystallization/melting. Cryobiology, 43, 199–210. [35] J. A. Seo, S. J. Kim, H. J. Kwon, Y. S. Yang, H. K. Kim and Y. H. Hwang. (2006) The glass transition tempera- tures of sugar mixtures. Carbohydrate Research, 341, 2516–2520. [36] J. H. Crowe, L. M. Crowe, A. E. Oliver, N. Tsvetkova, W. Wolkers and F. Tablin. (2001) The trehalose myth revis- ited: Introduction to a symposium on stabilization of cells in the dry state. Cryobiology, 43, 89–105. [37] A. Simperler, A. Kornherr, R. Chopra, W. Jones, W. D. S. Motherwell and G. Zifferer. (2007) The glass tran- sition temperatures of amorphous trehalose-water mixtures and the mobility of water: an experimental and in silico study. Carbohydrate Research, 342, 1470–1479. |

