Paper Menu >>
Journal Menu >>
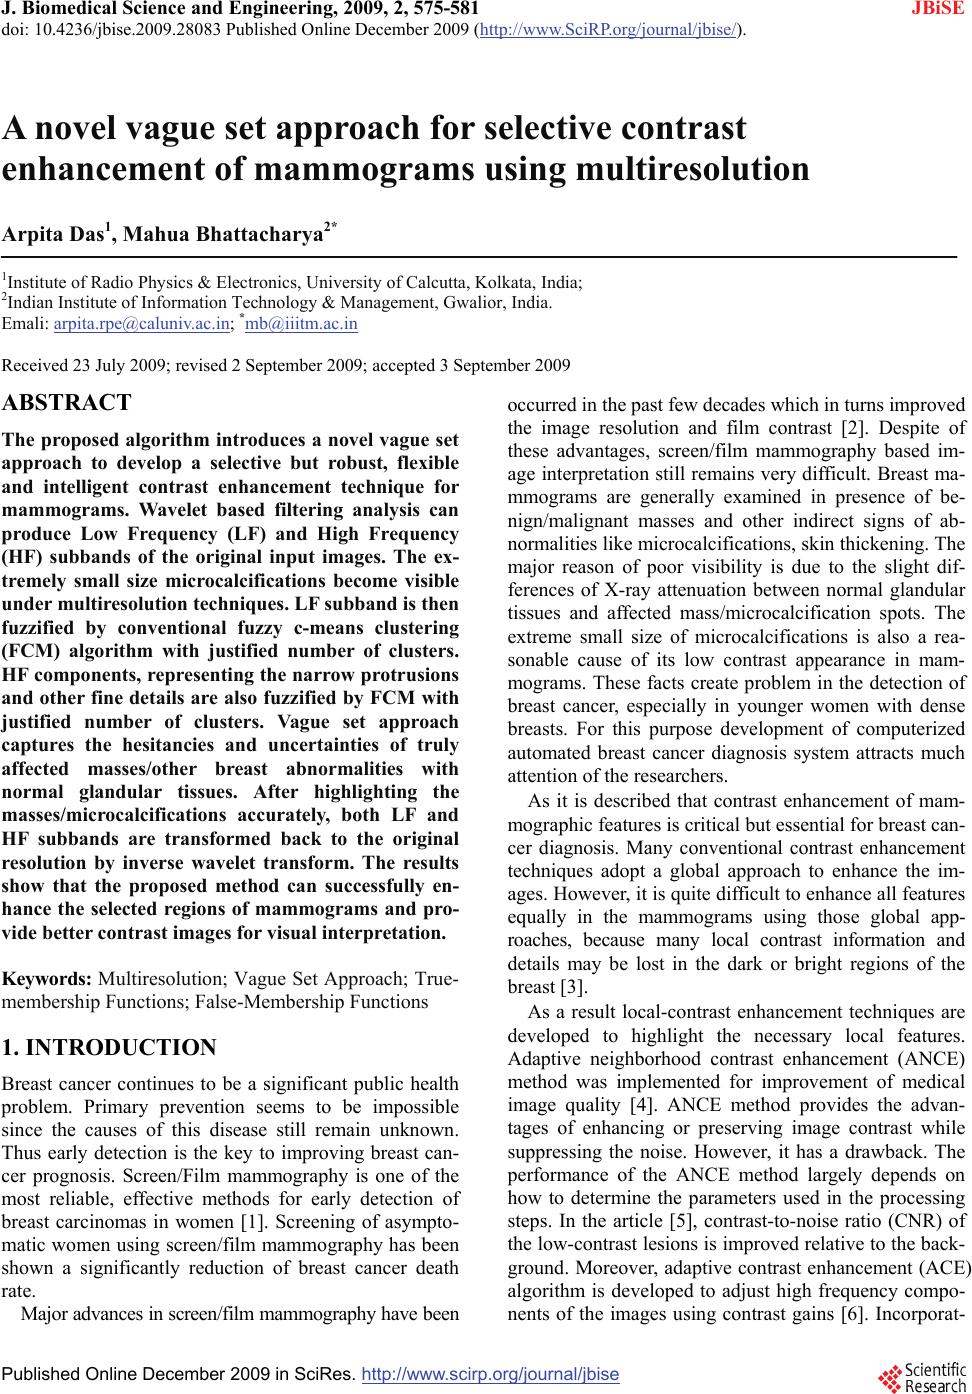 J. Biomedical Science and Engineering, 2009, 2, 575-581 doi: 10.4236/jbise.2009.28083 Published Online December 2009 (http://www.SciRP.org/journal/jbise/ JBiSE ). Published Online December 2009 in SciRes. http://www.scirp.org/journal/jbise A novel vague set approach for selective contrast enhancement of mammograms using multiresolution Arpita Das1, Mahua Bhattacharya2* 1Institute of Radio Physics & Electronics, University of Calcutta, Kolkata, India; 2Indian Institute of Information Technology & Management, Gwalior, India. Emali: arpita.rpe@caluniv.ac.in; *mb@iiitm.ac.in Received 23 July 2009; revised 2 September 2009; accepted 3 September 2009 ABSTRACT The proposed algorithm introduces a novel vague set approach to develop a selective but robust, flexible and intelligent contrast enhancement technique for mammograms. Wavelet based filtering analysis can produce Low Frequency (LF) and High Frequency (HF) subbands of the original input images. The ex- tremely small size microcalcifications become visible under multiresolution techniques. LF subband is then fuzzified by conventional fuzzy c-means clustering (FCM) algorithm with justified number of clusters. HF components, representing the narrow protrusions and other fine details are also fuzzified by FCM with justified number of clusters. Vague set approach captures the hesitancies and uncertainties of truly affected masses/other breast abnormalities with normal glandular tissues. After highlighting the masses/microcalcifications accurately, both LF and HF subbands are transformed back to the original resolution by inverse wavelet transform. The results show that the proposed method can successfully en- hance the selected regions of mammograms and pro- vide better contrast images for visual interpretation. Keywords: Multiresolution; Vague Set Approach; True- membership Functions; False-Membership Functions 1. INTRODUCTION Breast cancer continues to be a significant public health problem. Primary prevention seems to be impossible since the causes of this disease still remain unknown. Thus early detection is the key to improving breast can- cer prognosis. Screen/Film mammography is one of the most reliable, effective methods for early detection of breast carcinomas in women [1]. Screening of asympto- matic women using screen/film mammography has been shown a significantly reduction of breast cancer death rate. Major advances in screen/film mammography have been occurred in the past few decades which in turns improved the image resolution and film contrast [2]. Despite of these advantages, screen/film mammography based im- age interpretation still remains very difficult. Breast ma- mmograms are generally examined in presence of be- nign/malignant masses and other indirect signs of ab- normalities like microcalcifications, skin thickening. The major reason of poor visibility is due to the slight dif- ferences of X-ray attenuation between normal glandular tissues and affected mass/microcalcification spots. The extreme small size of microcalcifications is also a rea- sonable cause of its low contrast appearance in mam- mograms. These facts create problem in the detection of breast cancer, especially in younger women with dense breasts. For this purpose development of computerized automated breast cancer diagnosis system attracts much attention of the researchers. As it is described that contrast enhancement of mam- mographic features is critical but essential for breast can- cer diagnosis. Many conventional contrast enhancement techniques adopt a global approach to enhance the im- ages. However, it is quite difficult to enhance all features equally in the mammograms using those global app- roaches, because many local contrast information and details may be lost in the dark or bright regions of the breast [3]. As a result local-contrast enhancement techniques are developed to highlight the necessary local features. Adaptive neighborhood contrast enhancement (ANCE) method was implemented for improvement of medical image quality [4]. ANCE method provides the advan- tages of enhancing or preserving image contrast while suppressing the noise. However, it has a drawback. The performance of the ANCE method largely depends on how to determine the parameters used in the processing steps. In the article [5], contrast-to-noise ratio (CNR) of the low-contrast lesions is improved relative to the back- ground. Moreover, adaptive contrast enhancement (ACE) algorithm is developed to adjust high frequency compo- nents of the images using contrast gains [6]. Incorporat- 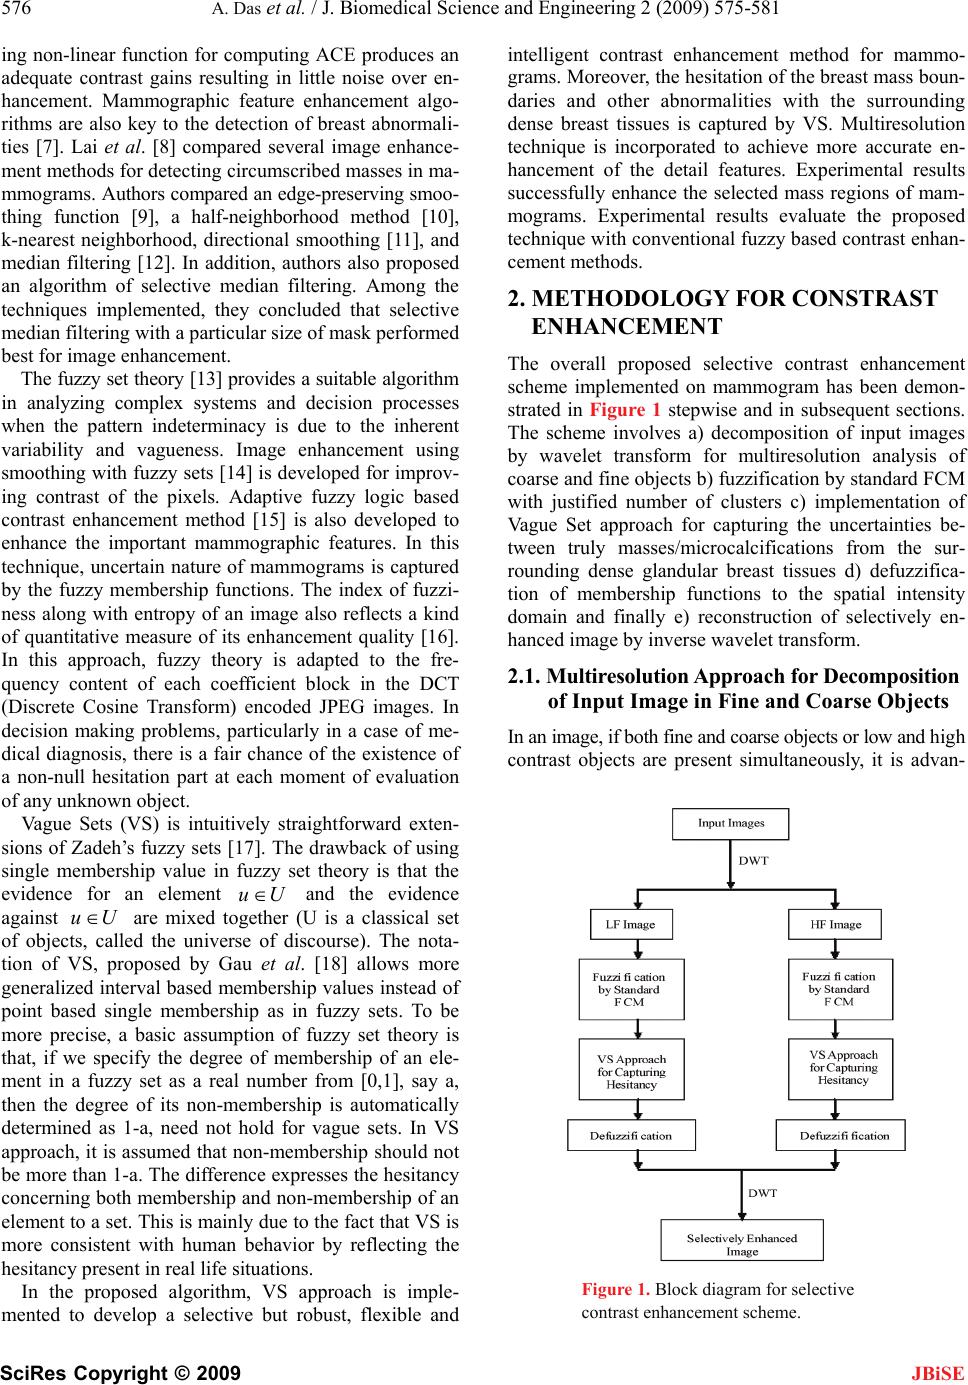 576 A. Das et al. / J. Biomedical Science and Engineering 2 (2009) 575-581 SciRes Copyright © 2009 JBiSE ing non-linear function for computing ACE produces an adequate contrast gains resulting in little noise over en- hancement. Mammographic feature enhancement algo- rithms are also key to the detection of breast abnormali- ties [7]. Lai et al. [8] compared several image enhance- ment methods for detecting circumscribed masses in ma- mmograms. Authors compared an edge-preserving smoo- thing function [9], a half-neighborhood method [10], k-nearest neighborhood, directional smoothing [11], and median filtering [12]. In addition, authors also proposed an algorithm of selective median filtering. Among the techniques implemented, they concluded that selective median filtering with a particular size of mask performed best for image enhancement. The fuzzy set theory [13] provides a suitable algorithm in analyzing complex systems and decision processes when the pattern indeterminacy is due to the inherent variability and vagueness. Image enhancement using smoothing with fuzzy sets [14] is developed for improv- ing contrast of the pixels. Adaptive fuzzy logic based contrast enhancement method [15] is also developed to enhance the important mammographic features. In this technique, uncertain nature of mammograms is captured by the fuzzy membership functions. The index of fuzzi- ness along with entropy of an image also reflects a kind of quantitative measure of its enhancement quality [16]. In this approach, fuzzy theory is adapted to the fre- quency content of each coefficient block in the DCT (Discrete Cosine Transform) encoded JPEG images. In decision making problems, particularly in a case of me- dical diagnosis, there is a fair chance of the existence of a non-null hesitation part at each moment of evaluation of any unknown object. Vague Sets (VS) is intuitively straightforward exten- sions of Zadeh’s fuzzy sets [17]. The drawback of using single membership value in fuzzy set theory is that the evidence for an element Uu and the evidence against are mixed together (U is a classical set of objects, called the universe of discourse). The nota- tion of VS, proposed by Gau et al. [18] allows more generalized interval based membership values instead of point based single membership as in fuzzy sets. To be more precise, a basic assumption of fuzzy set theory is that, if we specify the degree of membership of an ele- ment in a fuzzy set as a real number from [0,1], say a, then the degree of its non-membership is automatically determined as 1-a, need not hold for vague sets. In VS approach, it is assumed that non-membership should not be more than 1-a. The difference expresses the hesitancy concerning both membership and non-membership of an element to a set. This is mainly due to the fact that VS is more consistent with human behavior by reflecting the hesitancy present in real life situations. Uu In the proposed algorithm, VS approach is imple- mented to develop a selective but robust, flexible and intelligent contrast enhancement method for mammo- grams. Moreover, the hesitation of the breast mass boun- daries and other abnormalities with the surrounding dense breast tissues is captured by VS. Multiresolution technique is incorporated to achieve more accurate en- hancement of the detail features. Experimental results successfully enhance the selected mass regions of mam- mograms. Experimental results evaluate the proposed technique with conventional fuzzy based contrast enhan- cement methods. 2. METHODOLOGY FOR CONSTRAST ENHANCEMENT The overall proposed selective contrast enhancement scheme implemented on mammogram has been demon- strated in Figure 1 stepwise and in subsequent sections. The scheme involves a) decomposition of input images by wavelet transform for multiresolution analysis of coarse and fine objects b) fuzzification by standard FCM with justified number of clusters c) implementation of Vague Set approach for capturing the uncertainties be- tween truly masses/microcalcifications from the sur- rounding dense glandular breast tissues d) defuzzifica- tion of membership functions to the spatial intensity domain and finally e) reconstruction of selectively en- hanced image by inverse wavelet transform. 2.1. Multiresolution Approach for Decomposition of Input Image in Fine and Coarse Objects In an image, if both fine and coarse objects or low and high contrast objects are present simultaneously, it is advan- Figure 1. Block diagram for selective contrast enhancement scheme. 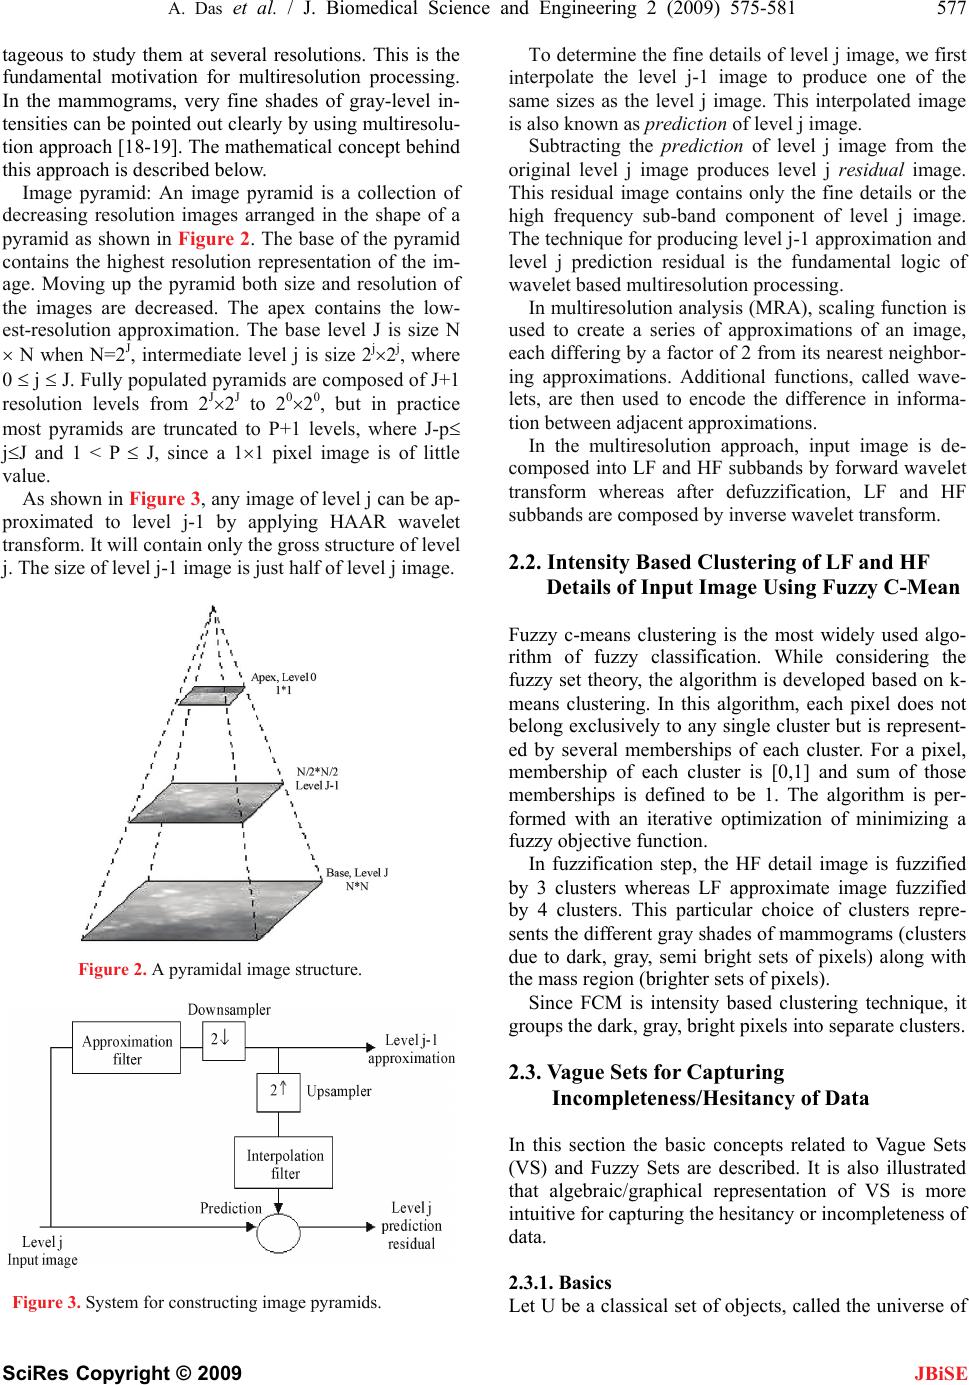 A. Das et al. / J. Biomedical Science and Engineering 2 (2009) 575-581 577 SciRes Copyright © 2009 JBiSE tageous to study them at several resolutions. This is the fundamental motivation for multiresolution processing. In the mammograms, very fine shades of gray-level in- tensities can be pointed out clearly by using multiresolu- tion approach [18-19]. The mathematical concept behind this approach is described below. To determine the fine details of level j image, we first interpolate the level j-1 image to produce one of the same sizes as the level j image. This interpolated image is also known as prediction of level j image. Subtracting the prediction of level j image from the original level j image produces level j residual image. This residual image contains only the fine details or the high frequency sub-band component of level j image. The technique for producing level j-1 approximation and level j prediction residual is the fundamental logic of wavelet based multiresolution processing. Image pyramid: An image pyramid is a collection of decreasing resolution images arranged in the shape of a pyramid as shown in Figure 2. The base of the pyramid contains the highest resolution representation of the im- age. Moving up the pyramid both size and resolution of the images are decreased. The apex contains the low- est-resolution approximation. The base level J is size N N when N=2J, intermediate level j is size 2j2j, where 0 j J. Fully populated pyramids are composed of J+1 resolution levels from 2J2J to 2020, but in practice most pyramids are truncated to P+1 levels, where J-p jJ and 1 < P J, since a 11 pixel image is of little value. In multiresolution analysis (MRA), scaling function is used to create a series of approximations of an image, each differing by a factor of 2 from its nearest neighbor- ing approximations. Additional functions, called wave- lets, are then used to encode the difference in informa- tion between adjacent approximations. In the multiresolution approach, input image is de- composed into LF and HF subbands by forward wavelet transform whereas after defuzzification, LF and HF subbands are composed by inverse wavelet transform. As shown in Figure 3, any image of level j can be ap- proximated to level j-1 by applying HAAR wavelet transform. It will contain only the gross structure of level j. The size of level j-1 image is just half of level j image. Figure 2. A pyramidal image structure. Figure 3. System for constructing image pyramids. 2.2. Intensity Based Clustering of LF and HF Details of Input Image Using Fuzzy C-Mean Fuzzy c-means clustering is the most widely used algo- rithm of fuzzy classification. While considering the fuzzy set theory, the algorithm is developed based on k- means clustering. In this algorithm, each pixel does not belong exclusively to any single cluster but is represent- ed by several memberships of each cluster. For a pixel, membership of each cluster is [0,1] and sum of those memberships is defined to be 1. The algorithm is per- formed with an iterative optimization of minimizing a fuzzy objective function. In fuzzification step, the HF detail image is fuzzified by 3 clusters whereas LF approximate image fuzzified by 4 clusters. This particular choice of clusters repre- sents the different gray shades of mammograms (clusters due to dark, gray, semi bright sets of pixels) along with the mass region (brighter sets of pixels). Since FCM is intensity based clustering technique, it groups the dark, gray, bright pixels into separate clusters. 2.3. Vague Sets for Capturing Incompleteness/Hesitancy of Data In this section the basic concepts related to Vague Sets (VS) and Fuzzy Sets are described. It is also illustrated that algebraic/graphical representation of VS is more intuitive for capturing the hesitancy or incompleteness of data. 2.3.1. Basics Let U be a classical set of objects, called the universe of 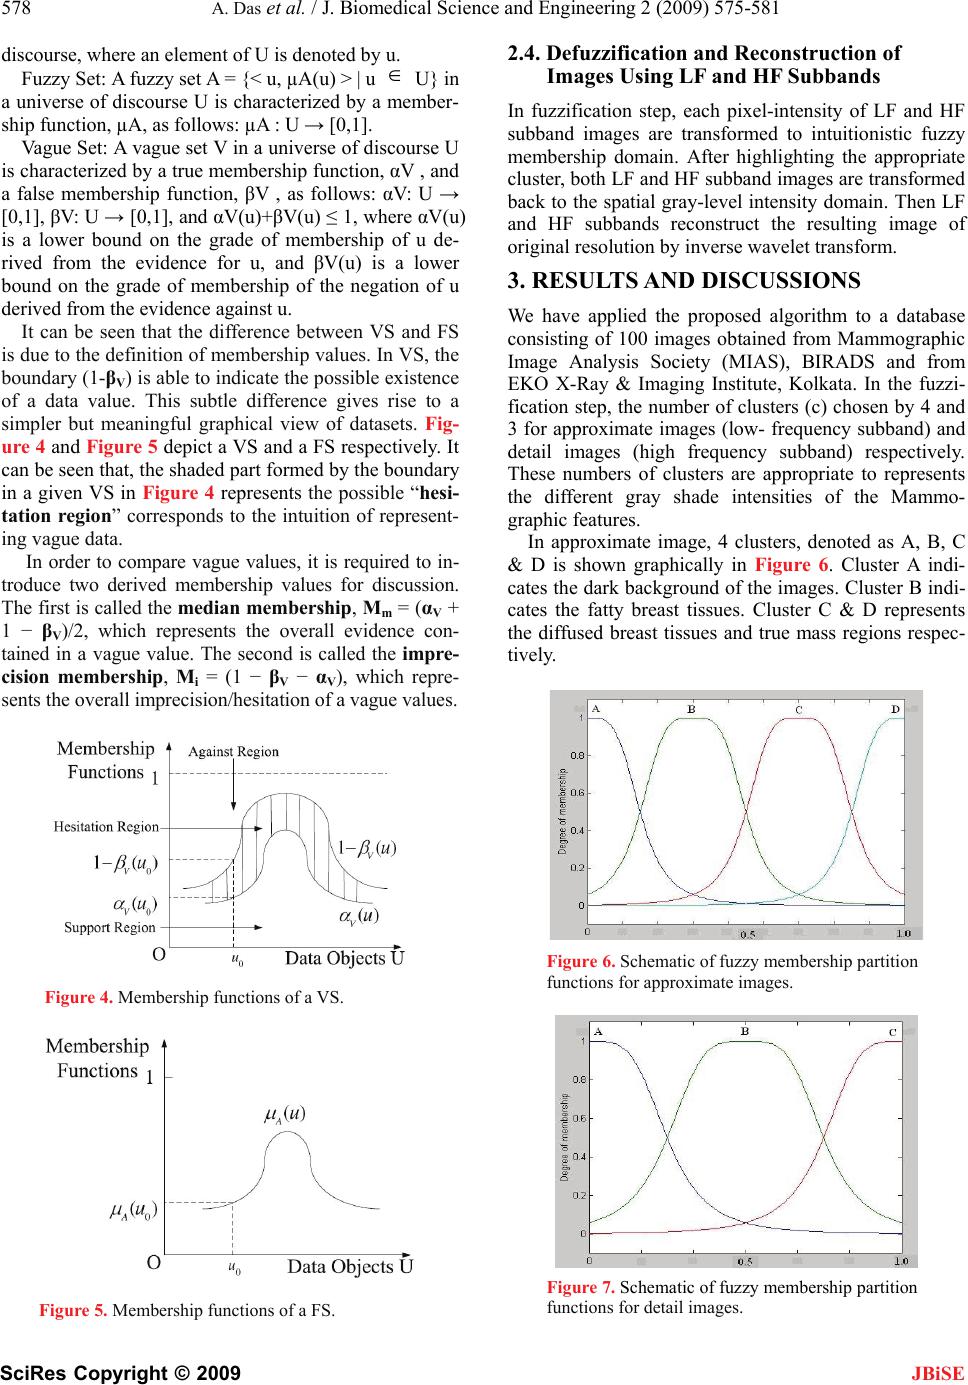 578 A. Das et al. / J. Biomedical Science and Engineering 2 (2009) 575-581 SciRes Copyright © 2009 JBiSE discourse, where an element of U is denoted by u. Fuzzy Set: A fuzzy set A = {< u, µA(u) > | u U} in a universe of discourse U is characterized by a member- ship function, µA, as follows: µA : U → [0,1]. Vague Set: A vague set V in a universe of discourse U is characterized by a true membership function, αV , and a false membership function, βV , as follows: αV: U → [0,1], βV: U → [0,1], and αV(u)+βV(u) ≤ 1, where αV(u) is a lower bound on the grade of membership of u de- rived from the evidence for u, and βV(u) is a lower bound on the grade of membership of the negation of u derived from the evidence against u. It can be seen that the difference between VS and FS is due to the definition of membership values. In VS, the boundary (1-βV) is able to indicate the possible existence of a data value. This subtle difference gives rise to a simpler but meaningful graphical view of datasets. Fig- ure 4 and Figure 5 depict a VS and a FS respectively. It can be seen that, the shaded part formed by the boundary in a given VS in Figure 4 represents the possible “hesi- tation region” corresponds to the intuition of represent- ing vague data. In order to compare vague values, it is required to in- troduce two derived membership values for discussion. The first is called the median membership, Mm = (αV + 1 − βV)/2, which represents the overall evidence con- tained in a vague value. The second is called the impre- cision membership, Mi = (1 − βV − αV), which repre- sents the overall imprecision/hesitation of a vague values. Figure 4. Membership functions of a VS. Figure 5. Membership functions of a FS. 2.4. Defuzzification and Reconstruction of Images Using LF and HF Subbands In fuzzification step, each pixel-intensity of LF and HF subband images are transformed to intuitionistic fuzzy membership domain. After highlighting the appropriate cluster, both LF and HF subband images are transformed back to the spatial gray-level intensity domain. Then LF and HF subbands reconstruct the resulting image of original resolution by inverse wavelet transform. 3. RESULTS AND DISCUSSIONS We have applied the proposed algorithm to a database consisting of 100 images obtained from Mammographic Image Analysis Society (MIAS), BIRADS and from EKO X-Ray & Imaging Institute, Kolkata. In the fuzzi- fication step, the number of clusters (c) chosen by 4 and 3 for approximate images (low- frequency subband) and detail images (high frequency subband) respectively. These numbers of clusters are appropriate to represents the different gray shade intensities of the Mammo- graphic features. In approximate image, 4 clusters, denoted as A, B, C & D is shown graphically in Figure 6. Cluster A indi- cates the dark background of the images. Cluster B indi- cates the fatty breast tissues. Cluster C & D represents the diffused breast tissues and true mass regions respec- tively. Figure 6. Schematic of fuzzy membership partition functions for approximate images. Figure 7. Schematic of fuzzy membership partition functions for detail images.  A. Das et al. / J. Biomedical Science and Engineering 2 (2009) 575-581 579 SciRes Copyright © 2009 In detail image, 3 clusters, denoted as A, B & C is presented graphically in Figure 7. Cluster A indicates the drk background of the images. Cluster B indicates the irregular shades of breast due to dense parencymal tissues and Cluster C represents the fine boundaries of masses present in the mammograms. JBiSE After fuzzification with proper number of clusters, the vague set approach has been introduced for cap- turing the hesitancy and incompleteness of mammo- graphic features. In the case of approximate images, only cluster D represents the membership function in evidence to true mass region (αV), and clusters A, B, C represent the evidence against the true mass region Thus the average membership function in evidence to false mass region (βV) is calculated by (A+B+C)/3. Similarly cluster C of detail images, represents the evidence of true mass boundaries (αV) whereas cluster A and B indicate the evidence against the true mass regions. The average membership function in evidence to false mass region (βV) is calculated by (A+B)/2. The median membership value Mm = (αV+1−βV)/2, is set for the boundary value between the membership functions αV and 1−βV. In the present article, median membership value is considered as the limit of affected mass or other type of breast abnormalities. The following mammograms are used to demonstrate the improved contrast of masses/microcalfications using VS approach in compare to the standard fuzzy set theory. Figure 8(a) is the original mammogram to be en- hanced. Figure 8(b) indicates the improved contrast between true mass region and normal breast tissues us- ing the proposed algorithm, whereas Figure 8(c) high- light the same region using standard FCM. It is noted that Figure 8(b) obtained by VS approach, is capable of highlighting the true masses properly because of its effi- ciency to handle the uncertainty /hesitancy between true and false membership functions. On the contrary, the enhanced result obtained by FCM skips to highlight some of the true mass regions that ef- fect severely in proper diagnosis. Figure 9(b) and Fig- ure 10(b) also represent improved contrast mammo- grams with circumscribed masses using the proposed methodology. (a) (b) (c) Figure 8. (a) Original Mammographic Image; (b) Enhanced image by VS; (c) Enhanced image by FCM. (a) (b) (a) (b) Figure 9. (a) Original Mammographic Image; (b) Enhanced image by proposed method. Figure 10. (a) Original Mammographic Image; (b) Enhanced image by proposed method.  580 A. Das et al. / J. Biomedical Science and Engineering 2 (2009) 575-581 SciRes Copyright © 2009 JBiSE Figure 11(b) also shows the enhanced indistinct shap- ed mass region properly. In Figure 12(b) the proposed algorithm highlights comparatively large shaped mass boundary clearly along with the presence of few micro- calcification spots surrounding the mass. Table 1 exhibits the median and imprecision mem- bership values of VS approach for a particular mammo- gram. The single membership grade of conventional fuzzy set theory for same mammographic image also list- ed in right most column. The larger values of median membership function, obtained from VS approach is capable of highlighting the true masses /microcalci fica- tions with allowable hesitation margins (Mm-μA) in com- pare to ordinary fuzzy set theory. (a) (b) Figure 11. (a) Original Mammographic Image; (b) Enhanced image by proposed method. 4. CONCLUSIONS During the past two decades, interval based intuitionistic fuzzy sets have been used increasingly in the research areas focused on fuzzy sets and fuzzy logic. Goal of this paper is not to develop an interval based fuzzy set ap- proach for handling the imprecise data but to apply more (a) (b) Figure 12. (a) Original Mammographic Image; (b) Enhanced image by proposed method. Table 1. Membership values of vague set theory and fuzzy set approach. Elements of clusters in Approx image Median Membership Value (Mm) according to VS Approach Imprecision /hesitation membership Value(Mi) according to VS Approach Membership Value μA according to Fuzzy Set Approach 1st element of cluster D 1.0000 0.0000 1.0000 2nd element of cluster D 0.9999 0.0000 0.9999 3rd element of cluster D 0.9995 0.0004 0.9991 4th element of cluster D 0.9993 0.0013 0.9980 5th element of cluster D 0.9984 0.0006 0.9978 6th element of cluster D 0.9982 0.0023 0.9959 7th element of cluster D 0.9967 0.0032 0.9935 8th element of cluster D 0.9948 0.0019 0.9929 9th element of cluster D. 0.9942 0.0036 0.9906 10th element of cluster D 0.9926 0.0036 0.9890 11th element of cluster D 0.9910 0.0037 0.9873 12th element of cluster D 0.9901 0.0059 0.9842 13th element of cluster D 0.9874 0.0038 0.9836 14th element of cluster D 0.9869 0.0056 0.9813 15th element of cluster D 0.9844 0.0050 0.9794  A. Das et al. / J. Biomedical Science and Engineering 2 (2009) 575-581 581 SciRes Copyright © 2009 JBiSE robust Vague Set approach for uncer tainty management. Introducing two parameters, like median and impreci- sion membership values, VS approach becomes much easier to interpret and to visualize the vague data objects. Since medical diagnosis deals with the imprecise and incomplete information, accurate detection of truly af- fected region as well as degree of prognosis of the dis- eases is a difficult task. VS approach is then appropriate for the area concerning medical diagnosis. The authors have presented VS approach, which is efficient than the ordinary fuzzy sets for this purpose. The major advan- tage of VS over conventional fuzzy sets is that, VS in- cludes both positive and negative evidences of an ele- ment in the universal set. As a result, the proposed method has the advantages of modelling and analyzing the uncertainties and hesitancies which are present in the diagnostic system in a more flexible and intelligent man- ner. Measurement of impreciseness in practice, it is found from the experimental results that VS is more natural than the conventional FS, especially for overlap- ping membership function domain. Introduction of mul- tiresolution analysis makes the methodology more robust in that sense it is capable of enhancing very fine detail features by processing the high frequency subband components. For Mammographic images, ordinary con- trast enhancement algorithms are unable to provide good contrast information in the selected region of interests. The concept of VS is found to be applied successfully to the problems of selective contrast enhancement. The resulted performance of the proposed algorithm shows improvements over the ordinary fuzzy based operations. 5. ACKNOWLEDGEMENMTS The authors would like to thank to Dr. S. K. Sharma, Director, EKO Imaging and X-Ray Institute, Kolkata. REFERENCES [1] A. G. Haus and M. J. Yaffe, Eds (1993) A categorical course in physics, technical aspects of breast imaging, radiological society of North America, Presented at the 79 Scientific Assembly and Annual Meeting of RSNA. [2] G. T. Barnes and G. D. Frey, Eds (1991) Screen film mammography, imaging considerations and medical physics responsibilities, Madison, WI: Medical Physics Publishing. [3] R. C. Gonzalez and R. Woods, Digital image processing, Second Edition, Pearson Education. [4] D-Y. Tsai, and Y. Lee, (2004) Improved adaptive neigh- borhood pre-processing for medical image enhancement, LNCS-3314, 576–581. [5] P. F. Stetson, F. G. Sommer, and A. Macovski, (1997) Lesion contrast enhancement in medical ultrasound im- aging, IEEE Trans. Medical Imaging, 16(4), 416–425. [6] D-C. Chang and W-R Wu, (1998) Image contrast enhan- cement based on a histogram transformation of local standard deviation, IEEE Trans. Medical Imaging, 17(4), 518–531. [7] A. F. Laine, S. Schuler, J. Fan, and W. Huda, (1994) Mammographic feature enhancement by multiscale analysis, IEEE Trans. Medical Imaging, 13(4), 725–740. [8] S. Lai, X. Li, and W. F. Bischof, (1989) On techniques for detecting circumscribed masses in mammograms, IEEE Trans. Med. Imag., 8(4), 377–386. [9] M. Nagao and T. Matsuyama, (1979) Edge preserving smoothing, computer graphics and image processing, 9 (4), 394–407. [10] A. Scheer, F. R. D. Velasco, and A. Rosenfield, (1980) Some new image smoothing techniques, IEEE Trans. Syst., Man, Cyber., SMC-IO, 3, 153–158. [11] L. S. Davis and A. Rosenfield, (1978) Noise cleaning by iterated local averaging, IEEE Trans. Syst., Man, Cyber., SMC, 8, 705–710. [12] A. C. Bovik, T. S. Huang, and D. C. Munson, Jr., (1987) The effect of median filtering on edge estimation and de- tection, IEEE Trans. Pattern Anal. Machine Intell., PAMI, 9(2), 181–194. [13] S. K. Pal and R. A. King, (1981) Image enhancement using smoothing with fuzzy set, IEEE Trans. Syst., Man, Cybern., SMC, 11 , 494–501. [14] H. D. Cheng and H. Xu, (2002) A novel fuzzy logic ap- proach to mammogram contrast enhancement, An Int. Journal on Information Sciences-Applications, 148(1-4), 167–184. [15] S. K. Pal, (1982) A note on the quantitative measure of image enhancement through fuzziness, IEEE Trans. Pattern Analysis and Machine Intelligence, PAMI, 4(2). [16] C. Popa, A. Vlaicu, M. Gordan and B. Orza, (2007) Fuzzy contrast enhancement for images in the com- pressed domain, Proc. of the Int. Multiconference on Computer Science and Information Technology, 161– 170. [17] L. A. Zadeh, (1965) Fuzzy sets, information and control, 8, 338–353. [18] W. L. Gau, D. J. Buehrer, (1993) Vague sets, IEEE Trans. Systems, Man, and Cybernetics, 23, 610–614. |