Paper Menu >>
Journal Menu >>
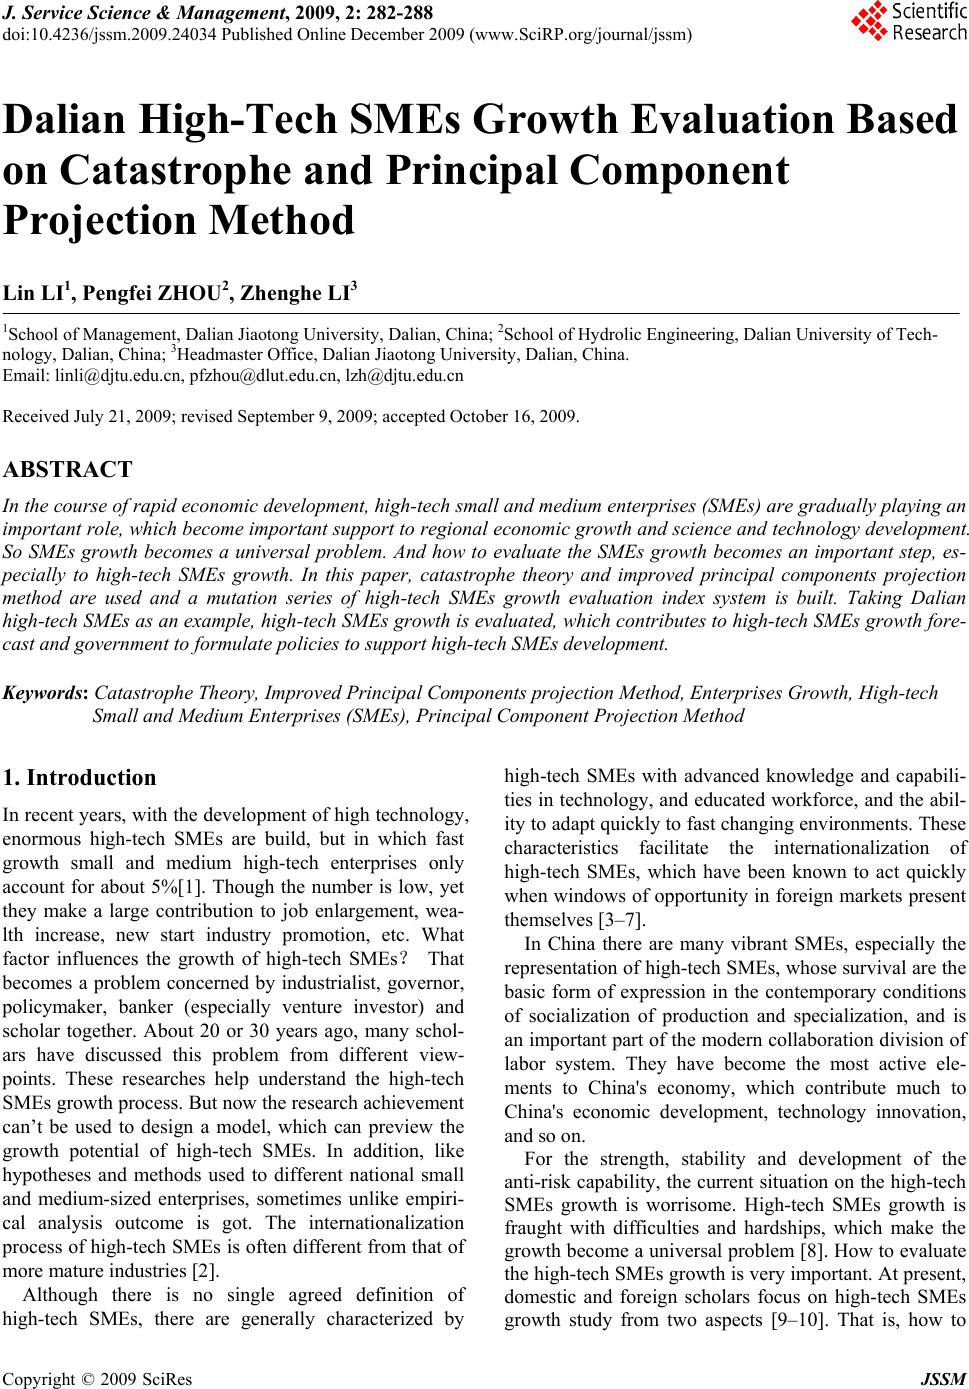 J. Service Science & Management, 2009, 2: 282-288 doi:10.4236/jssm.2009.24034 Published Online December 2009 (www.SciRP.org/journal/jssm) Copyright © 2009 SciRes JSSM Dalian High-Tech SMEs Growth Evaluation Based on Catastrophe and Principal Component Projection Method Lin LI1, Pengfei ZHOU2, Zhenghe LI3 1School of Management, Dalian Jiaotong University, Dalian, China; 2School of Hydrolic Engineering, Dalian University of Tech- nology, Dalian, China; 3Headmaster Office, Dalian Jiaotong University, Dalian, China. Email: linli@djtu.edu.cn, pfzhou@dlut.edu.cn, lzh@djtu.edu.cn Received July 21, 2009; revised September 9, 2009; accepted October 16, 2009. ABSTRACT In the course of rapid economic development, high-tech small and medium enterprises (SMEs) are gradually playing an important role, which become important support to regional economic growth and science and technology development. So SMEs growth becomes a universal problem. And how to evaluate the SMEs growth becomes an important step, es- pecially to high-tech SMEs growth. In this paper, catastrophe theory and improved principal components projection method are used and a mutation series of high-tech SMEs growth evaluation index system is built. Taking Dalian high-tech SMEs as an example, high-tech SMEs growth is evaluated, which contributes to high-tech SMEs growth fore- cast and government to formulate policies to support high-tech SMEs devel opment. Keywords: Catastrophe Theory, Improved Principal Components projection Method, Enterprises Growth, High-tech Small and Medium Enterprises (SMEs), Principal Component Projection Method 1. Introduction In recent years, with the development of high technology, enormous high-tech SMEs are build, but in which fast growth small and medium high-tech enterprises only account for about 5%[1]. Though the number is low, yet they make a large contribution to job enlargement, wea- lth increase, new start industry promotion, etc. What factor influences the growth of high-tech SMEs? That becomes a problem concerned by industrialist, governor, policymaker, banker (especially venture investor) and scholar together. About 20 or 30 years ago, many schol- ars have discussed this problem from different view- points. These researches help understand the high-tech SMEs growth process. But now the research achievement can’t be used to design a model, which can preview the growth potential of high-tech SMEs. In addition, like hypotheses and methods used to different national small and medium-sized enterprises, sometimes unlike empiri- cal analysis outcome is got. The internationalization process of high-tech SMEs is often different from that of more mature industries [2]. Although there is no single agreed definition of high-tech SMEs, there are generally characterized by high-tech SMEs with advanced knowledge and capabili- ties in technology, and educated workforce, and the abil- ity to adapt quickly to fast changing environments. These characteristics facilitate the internationalization of high-tech SMEs, which have been known to act quickly when window s of opportunity in fore ign markets present themselves [3–7]. In China there are many vibrant SMEs, especially the representation of high-tech SMEs, whose survival are the basic form of expression in the contemporary conditions of socialization of production and specialization, and is an important part of the modern collaboration division of labor system. They have become the most active ele- ments to China's economy, which contribute much to China's economic development, technology innovation, and so on. For the strength, stability and development of the anti-risk capability, the curren t situation on the high-tech SMEs growth is worrisome. High-tech SMEs growth is fraught with difficulties and hardships, which make the growth become a univ ersal problem [8]. How to evaluate the high-tech SMEs growth is very important. At presen t, domestic and foreign scholars focus on high-tech SMEs growth study from two aspects [9–10]. That is, how to 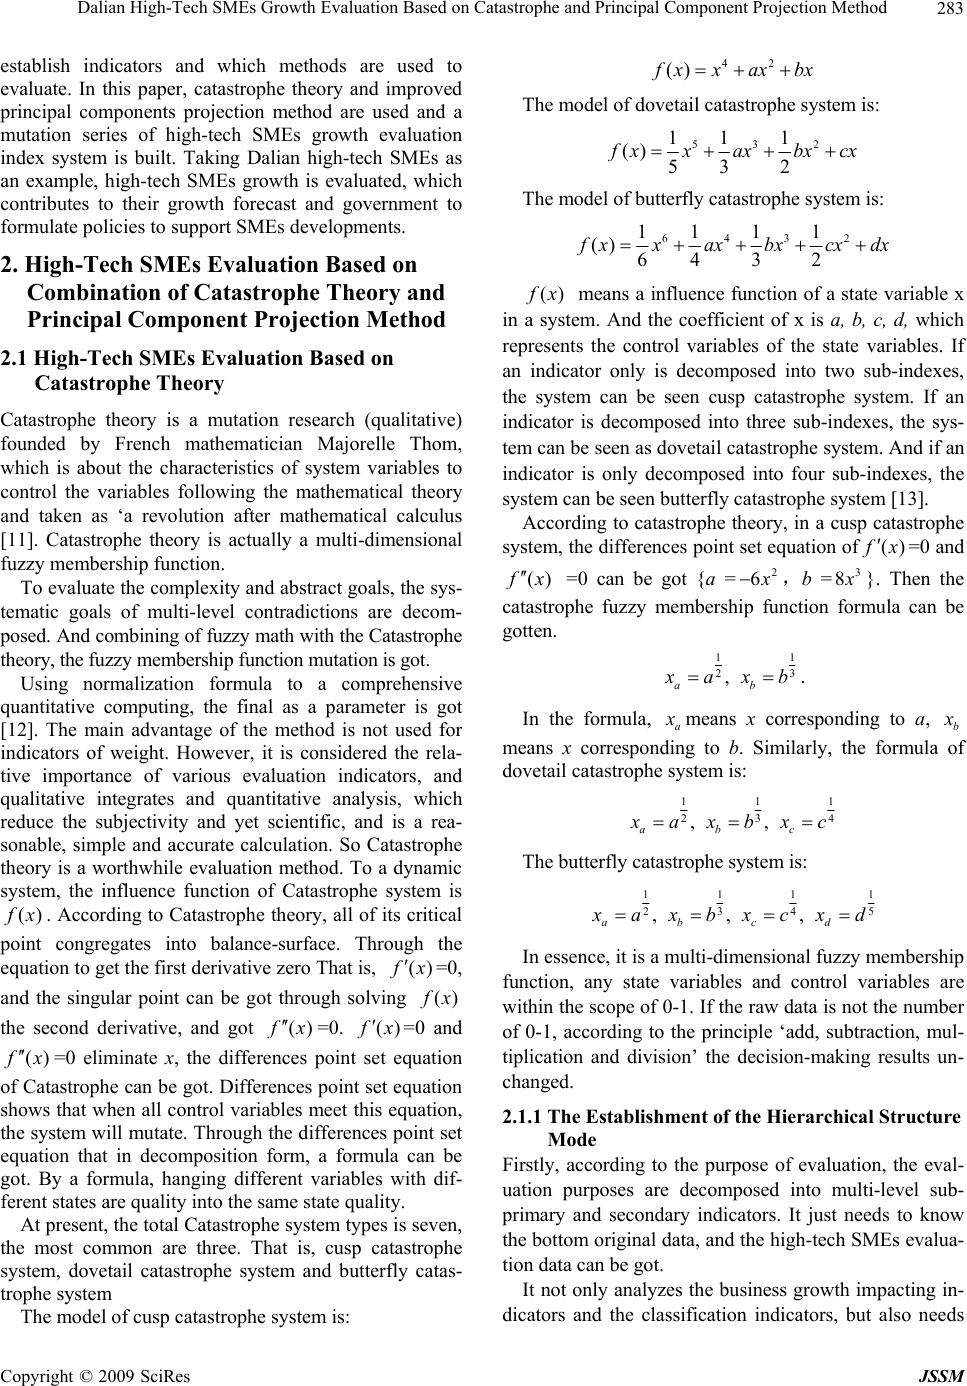 Dalian High-Tech SMEs Growth Evaluation Based on Catastrophe and Principal Component Projection Method283 establish indicators and which methods are used to evaluate. In this paper, catastrophe theory and improved principal components projection method are used and a mutation series of high-tech SMEs growth evaluation index system is built. Taking Dalian high-tech SMEs as an example, high-tech SMEs growth is evaluated, which contributes to their growth forecast and government to formulate policies to support SMEs developments. 2. High-Tech SMEs Evaluation Based on Combination of Catastrophe Theory and Principal Component Projection Method 2.1 High-Tech SMEs Evaluation Based on Catastrophe Theory Catastrophe theory is a mutation research (qualitative) founded by French mathematician Majorelle Thom, which is about the characteristics of system variables to control the variables following the mathematical theory and taken as ‘a revolution after mathematical calculus [11]. Catastrophe theory is actually a multi-dimensional fuzzy membership function. To evaluate the complexity an d abstract goals, the sys- tematic goals of multi-level contradictions are decom- posed. And combining of fuzzy math with the Catastrophe theory, the fuzzy membership functi on mutation is got. Using normalization formula to a comprehensive quantitative computing, the final as a parameter is got [12]. The main advantage of the method is not used for indicators of weight. However, it is considered the rela- tive importance of various evaluation indicators, and qualitative integrates and quantitative analysis, which reduce the subjectivity and yet scientific, and is a rea- sonable, simple and accurate calculation. So Catastrophe theory is a worthwhile evaluation method. To a dynamic system, the influence function of Catastrophe system is () f x. According to Catastrophe theory, all of its critical point congregates into balance-surface. Through the equation to get the first derivative zero That is, () f x =0, and the singular point can be got through solving () f x the second derivative, and got () f x =0. () f x =0 and () f x =0 eliminate x, the differences point set equation of Catastrophe can b e got. Differences point set equation shows that when all control variab les meet this equation , the system will mutate. Through the differences point set equation that in decomposition form, a formula can be got. By a formula, hanging different variables with dif- ferent states are quality into the same state quality. At present, the total Catastrophe system types is sev en, the most common are three. That is, cusp catastrophe system, dovetail catastrophe system and butterfly catas- trophe system The model of cusp catastrophe system is: 42 () f xxaxbx The model of dovetail catastrophe system is: 532 11 1 () 532 f xxaxbx cx The model of butterfly catastrophe system is: 6432 111 1 () 6432 f xxaxbxcx dx () f x means a influence function of a state variable x in a system. And the coefficient of x is a, b, c, d, which represents the control variables of the state variables. If an indicator only is decomposed into two sub-indexes, the system can be seen cusp catastrophe system. If an indicator is decomposed into three sub-indexes, the sys- tem can be seen as dovetail catastrophe system. And if an indicator is only decomposed into four sub-indexes, the system can be seen butterfly catastrop he sy stem [13]. According to catastrophe theory, in a cusp catastr ophe system, the differences point set equation of() f x =0 and () f x =0 can be got {a =2 6 x ,b =83 x }. Then the catastrophe fuzzy membership function formula can be gotten. 1 1 3 2, ab x axb . In the formula, a x means x corresponding to a, b x means x corresponding to b. Similarly, the formula of dovetail catastrophe system is: 1 11 3 24 ,, abc x ax bxc The butterfly catastrophe system is: 11 11 35 24 ,,, abcd x ax bxcxd In essence, it is a multi-dimensional fuzzy membership function, any state variables and control variables are within the scope of 0-1. If the raw data is not the number of 0-1, according to the principle ‘add, subtraction, mul- tiplication and division’ the decision-making results un- changed. 2.1.1 The Establishment of the Hierarchical Structure Mode Firstly, according to the purpose of evaluation, the eval- uation purposes are decomposed into multi-level sub- primary and secondary indicators. It just needs to know the bottom original data, and the high-tech SMEs evalua- tion data can be got. It not only analyzes the business growth impacting in- dicators and the classification indicators, but also needs Copyright © 2009 SciRes JSSM 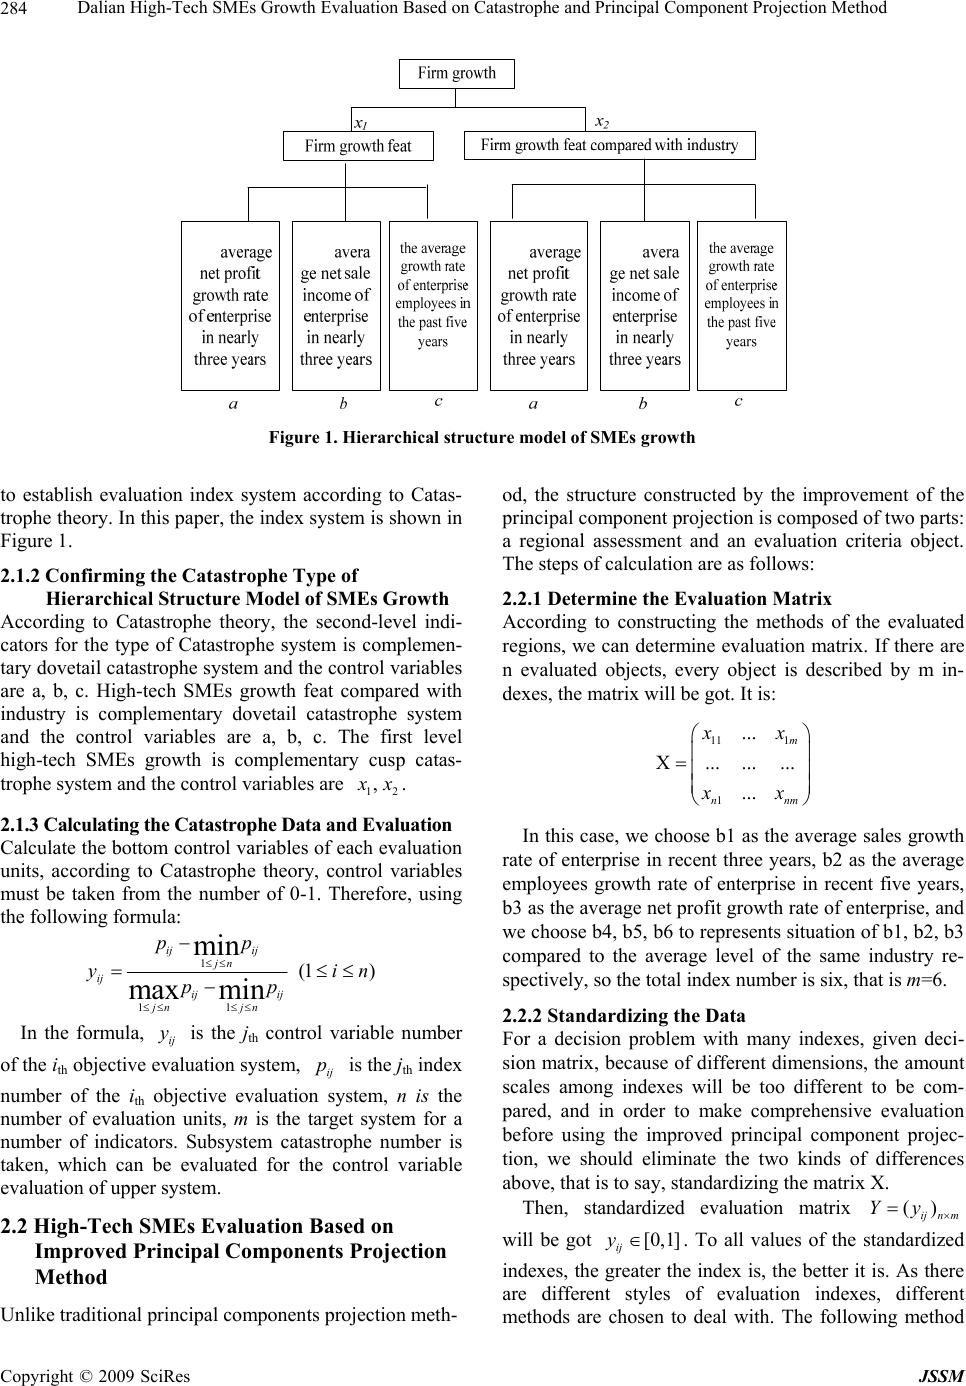 Dalian High-Tech SMEs Growth Evaluation Based on Catastrophe and Principal Component Projection Method 284 Figure 1. Hierarchical structure model of SMEs growth to establish evaluation index system according to Catas- trophe theory. In this paper, the index system is shown in Figure 1. 2.1.2 Confirming the Catastrophe Type of Hierarchical Structure Model of SMEs Growth According to Catastrophe theory, the second-level indi- cators for the type of Catastrophe system is complemen- tary dovetail catastrophe system and the control variables are a, b, c. High-tech SMEs growth feat compared with industry is complementary dovetail catastrophe system and the control variables are a, b, c. The first level high-tech SMEs growth is complementary cusp catas- trophe system and the control variables are 12 , x x. 2.1.3 Calculating the Catastrophe Data and Evaluation Calculate the bottom control variables of each evaluation units, according to Catastrophe theory, control variables must be taken from the number of 0-1. Therefore, using the following formula: 1 1 1 (1 ) min max min ij ij jn ij ij ij jn jn pp y pp in m In the formula, is the jth control variable number of the ith objective evaluation system, is the jth index number of the ith objective evaluation system, n is the number of evaluation units, m is the target system for a number of indicators. Subsystem catastrophe number is taken, which can be evaluated for the control variable evaluation of upper system. ij y ij p 2.2 High-Tech SMEs Evaluation Based on Improved Principal Components Projection Method Unlike traditional principal components projection meth- od, the structure constructed by the improvement of the principal component projection is composed of two parts: a regional assessment and an evaluation criteria object. The steps of calculation are as follows: 2.2.1 Determine the Evaluation Matrix According to constructing the methods of the evaluated regions, we can determine evaluation matrix. If there are n evaluated objects, every object is described by m in- dexes, the matrix will be got. It is: 11 1 1 ... X... ...... ... m nn x x x x In this case, we choose b1 as the averag e sales growth rate of enterprise in recent three years, b2 as the average employees growth rate of enterprise in recent five years, b3 as th e aver age net profit gro wth r ate of enterpri se, and we choose b4, b5, b6 to represents situation o f b1, b2, b3 compared to the average level of the same industry re- spectively, so the total index number is six, that is m=6. 2.2.2 Standardizing the Data For a decision problem with many indexes, given deci- sion matrix, because of different dimensions, the amount scales among indexes will be too different to be com- pared, and in order to make comprehensive evaluation before using the improved principal component projec- tion, we should eliminate the two kinds of differences above, that is to say, standardizing the matrix X. Then, standardized evaluation matrix () ijn m Yy will be got [0,1] ij y . To all values of the standardized indexes, the greater the index is, the better it is. As there are different styles of evaluation indexes, different methods are chosen to deal with. The following method Copyright © 2009 SciRes JSSM 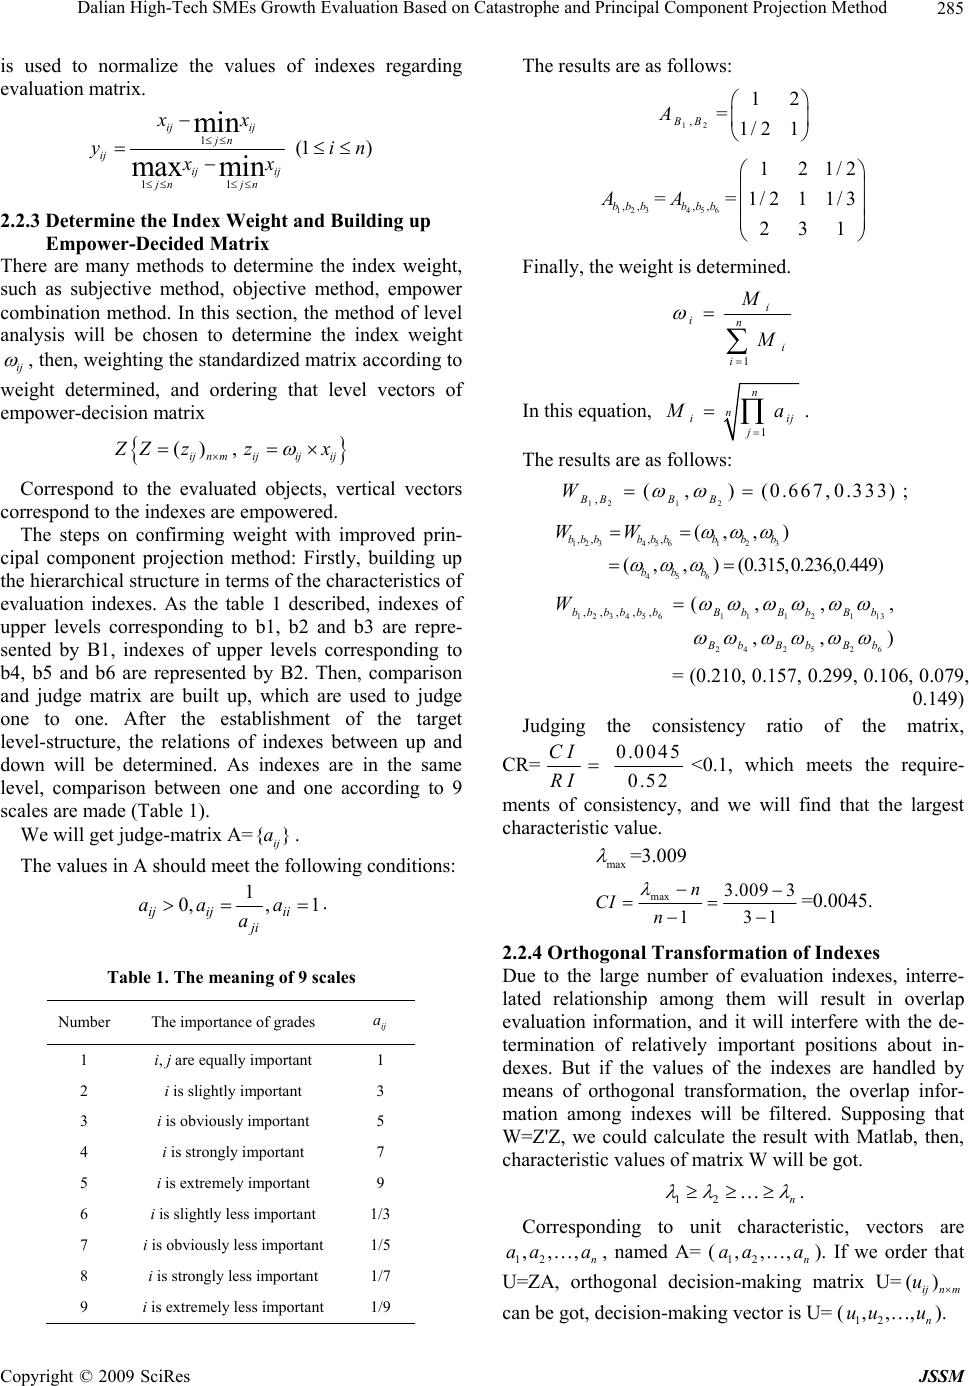 Dalian High-Tech SMEs Growth Evaluation Based on Catastrophe and Principal Component Projection Method285 is used to normalize the values of indexes regarding evaluation matrix. 1 1 1 (1 ) min max min ij ij jn ij ij ij jn jn xx yi xx n 2.2.3 Determine the Index Weight and Building up Empower-Decided Matrix There are many methods to determine the index weight, such as subjective method, objective method, empower combination method. In this section, the method of level analysis will be chosen to determine the index weight ij , then, weighting the standardized matrix according to weight determined, and ordering that level vectors of empower-decision matrix () , ijn mijijij Z Zz zx Correspond to the evaluated objects, vertical vectors correspond to the indexes are empowered. The steps on confirming weight with improved prin- cipal component projection method: Firstly, building up the hierarchical structure in terms of the characteristics of evaluation indexes. As the table 1 described, indexes of upper levels corresponding to b1, b2 and b3 are repre- sented by B1, indexes of upper levels corresponding to b4, b5 and b6 are represented by B2. Then, comparison and judge matrix are built up, which are used to judge one to one. After the establishment of the target level-structure, the relations of indexes between up and down will be determined. As indexes are in the same level, comparison between one and one according to 9 scales are made (Table 1). We will get judge-matrix A={. } ij a The values in A should meet the following conditions: 1, 1 0, ii ji ijija a aa . Table 1. The meaning of 9 scales Number The importance of grades ij a 1 i, j are equally important 1 2 i is slightly important 3 3 i is obviously important 5 4 i is strongly important 7 5 i is extremely important 9 6 i is slightly less important 1/3 7 i is obviously less important 1/5 8 i is strongly less i mportant 1/7 9 i is extremely less important 1/9 The results are as follows: 12 , B B A= 12 1/21 123 ,,bbb AA== 456 ,,bbb 121/2 1/2 1 1/3 231 Finally, the weight is determined. 1 i in i i M M In this equation, 1 n n ii jj M a . The results are as follows: 121 2 ,(,) (0.667,0.333) BBB B W ; 1234561 2 3 456 ,,,, (,,) (,,) (0.315,0.236,0.449) bbbbbbb bb bbb WW 1234561 1121 13 24 25 26 ,,,,, (, , ,, bbbbbbBb BbBb Bb Bb Bb W, ) = (0.210, 0.157, 0.299, 0.106, 0.079, 0.149) Judging the consistency ratio of the matrix, CR= CI RI 0.0045 0.52<0.1, which meets the require- ments of consistency, and we will find that the largest characteristic value. max =3.009 max 3.009 3 131 n CI n =0.0045. 2.2.4 Orthogonal Transformation of Indexes Due to the large number of evaluation indexes, interre- lated relationship among them will result in overlap evaluation information, and it will interfere with the de- termination of relatively important positions about in- dexes. But if the values of the indexes are handled by means of orthogonal transformation, the overlap infor- mation among indexes will be filtered. Supposing that W=Z'Z, we could calculate the result with Matlab, then, characteristic values of matrix W will be got. 12 n . Corresponding to unit characteristic, vectors are , named A= (). If we order that U=ZA, orthogonal decision-making matrix U= 12 ,,, n aa a12 ,,, n aa a () ijnm u can be got, decision-making vector is U= (12 ,,uu , n u). Copyright © 2009 SciRes JSSM  Dalian High-Tech SMEs Growth Evaluation Based on Catastrophe and Principal Component Projection Method 286 2.2.5 Constructing an Ideal Decision-Makct ing Obje Treat nal Then uniting wi and Calculating t h e Values ab o ut Projec tion ing each decision-making object as a dimensio vector and constructing an ideal decision-making object * d=12 ( ,,...,) m ddd * dth j d=() 1 max ij u in, we could get the result as follows: * *d d * 0*22 2 12 ... m d ddd d represents the ideal decision-making object, calcu- * 0 d lating projection values of every evaluated vector about ideal decision-making object: 1 * 022 2 12 ... m jij j ii m du Dud dd d 2.2.6 Ordering the Projection Values and By thn values calculated with Determining the Level e magnitude of projectio the equation above, we can judge the closing degree be- tween every evaluated object and ideal object, projection values 01 i D, and to Di, the greater, the better. The greater esents that the evaluated object value repri u is better. If we choose Di as comprehensive evaluation values of th it th Evaluation of High-Tech SMEs Thealuate the growth of the using …to deal with the two kinds of results, se e n evaluated objects, according to the greater-better principle, the final results of evaluation order could be got . The lastly new k objects also have k projection results, is that the values of the endpoints about evaluation criteria intervals also have projection values, these k val- ues form k-1 intervals, every interval corresponds to one kind of evaluation criteria level. And n-k projection val- ues of evaluated objects must fall into these k-1 intervals, that is to say, projection values of evaluated objects fall on projection values intervals of endpoints about evalua- tion criteria intervals. Eventually, the interval fell on in- dicates that evaluated objects are in the corresponding situation. 2.3 Grow Based on Combination re are many methods to ev enterprise, such as Catastrophe Theory, Principal Com- ponent Projection Method. If we combine the evaluate results of two methods just mentioned to play their own strengths, it is clear that the effect of the evaluation will be improved. And we combine the two kinds of results to make the weighted evaluation. The basic processes are as follows. Firstly, condly, using the formula 12 (1 )yy y to get the results of combined evaluati: 1 y rep- resents evaluation results which are dealt with Catastro- phe Theory after normalization, 2 y represents evalu- ation results which are dealt with ncipal Component Projection Method after normalization, on, in the formula Pri represents the weighted factor. Due to a number of exrt advisory, and the specific circumstances of data collection, we se- lect 0.5 as the reasonable value of pe . 3. Empirical Analysis on Daanli High-Tech 3.1 All result from surveying enterprises. we get the O oriented en- te Befnd reli- SMEs Growth Evaluation Source of the Data and Description of the Data Structure data of this study The region where questionnaires are released is Dalian, the person in charge of the business or senior managers knowing about the enterprise very well are chose to fill in the questionnaires. The number of the questionnaires released is 167, among them, 112 recovered are valid, recovery rate is 67.1%. The enterprises selected in this time meet the needs of the research basically. By analyzing the data of 112 valid sample, wnership situation: Collective enterprises account for 2.66%, private enterprises account for 50.67%, stock companies limited account for 5.33%, limited liability companies account for 21.33%, joint-stock cooperative enterprises accoun t for 1.33%, for eign-fund ed enterprises account for 5.33%, equity joint venture companies ac- count fo r 1 0.67%, o thers account for 2.67%. Situation of the business type: Produ ction- rprises account for 24%. Trade Enterprises account for 20%; Consulting, service-oriented en terprises account for 29.33%. Financial investment companies account for 1.33%. Outsourcing service accounts for 5.33%. Other types account for 14.67%; others account for 5.33%. 3.2 The Effectiveness and Reliability of High-Tech SMEs Growth Evaluation ore data analysis, to test the effectiveness a ability of data, data reliability test is needed. Cronbath is a major test of the inherent reliability, through which the of six grow feat is got, that is 0.910. That means the results of the questionnaire have high internal consistency coefficient. And the performance of the overall business growth correlation coefficient shows in Table 2. Before a large sample investigation, 20 high-tech SMEs are randomly selected to be interviewed and pre- investigated in Dalian high-tech park. Table 3 lists the evaluation results of 20 SMEs based on Catastrophe the- Copyright © 2009 SciRes JSSM 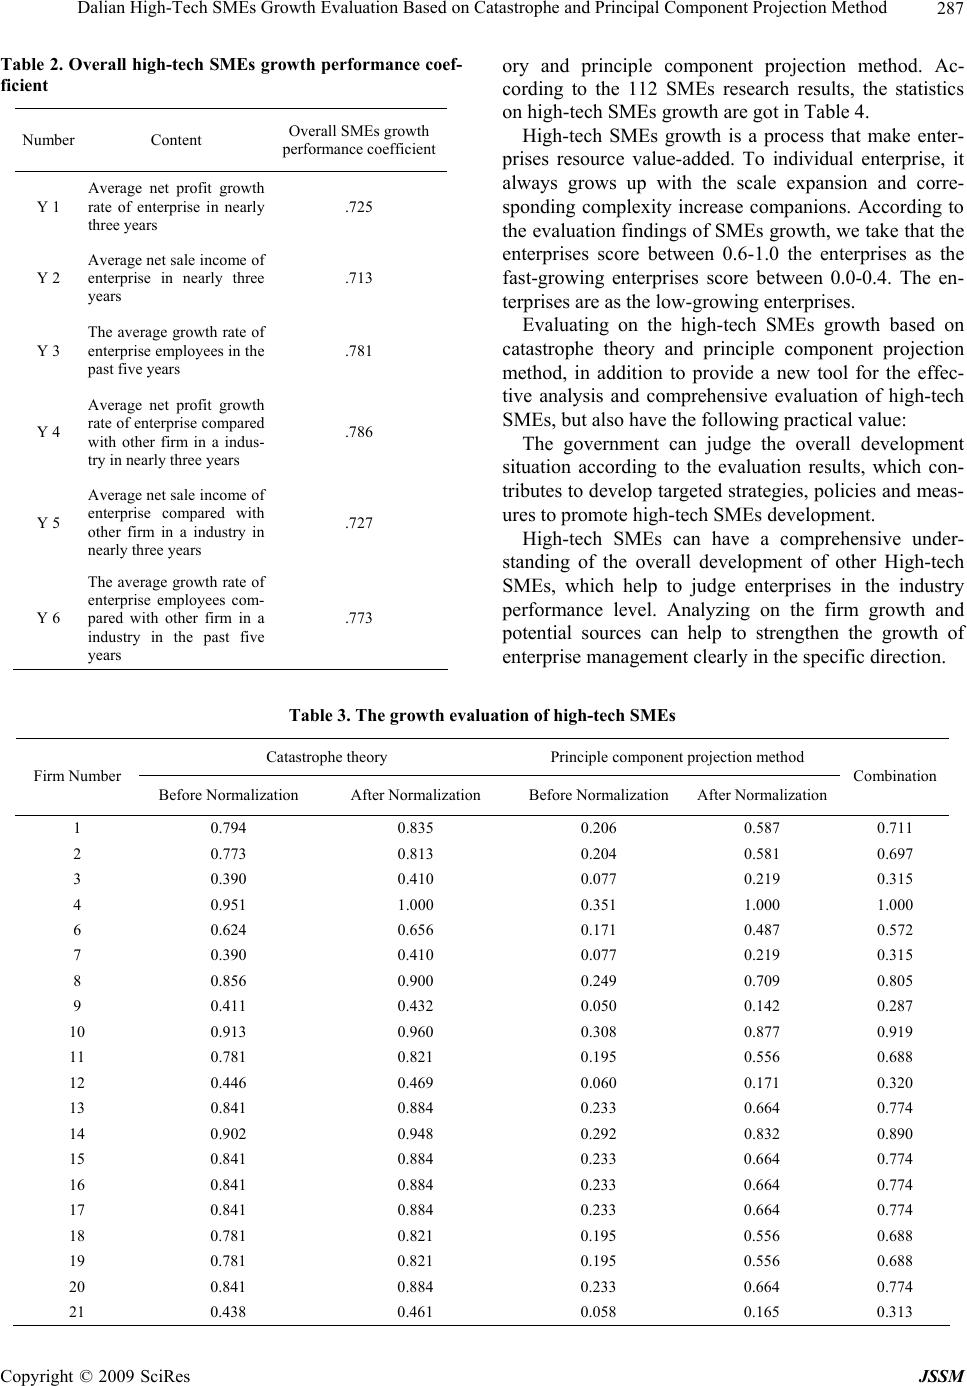 Dalian High-Tech SMEs Growth Evaluation Based on Catastrophe and Principal Component Projection Method Copyright © 2009 SciRes JSSM 287 er Content Overall SMEs growth performance coefficient Table 2. Overall high-tech SMEs growth performance coef- ficient Numb Y 1 Average growth rate of enterprise in nearly net profit three years .725 Y 2 n nearly three .713 Y 3 ise employees in the .781 Y 4 e compared .786 Y 5 ith .727 Y 6 es com-.773 Average net sale income of enterprise i years The average growth rate of enterpr past five years Average net profit growth rate of enterpris with other firm in a indus- try in nearly three years Average net sale income of enterprise compared w other firm in a industry in nearly three years The average growth rate of enterprise employe pared with other firm in a industry in the past five years ory and principle component projection method. Ac- cording to the 112 SMEs research results, the statistics on high-tech SMEs growth are got in Table 4. High-tech SMEs growth is a process that make enter- prises resource value-added. To individual enterprise, it always grows up with the scale expansion and corre- sponding complexity increase companions. According to the evaluation findings of SMEs growth, we take that the enterprises score between 0.6-1.0 the enterprises as the fast-growing enterprises score between 0.0-0.4. The en- terprises are as the low-growing enterprises. Evaluating on the high-tech SMEs growth based on catastrophe theory and principle component projection method, in addition to provide a new tool for the effec- tive analysis and comprehensive evaluation of high-tech SMEs, but also have the following practical value: The government can judge the overall development situation according to the evaluation results, which con- tributes to develop targeted strategies, policies an d meas- ures to promote high-tech SMEs development. High-tech SMEs can have a comprehensive under- standing of the overall development of other High-tech SMEs, which help to judge enterprises in the industry performance level. Analyzing on the firm growth and potential sources can help to strengthen the growth of enterprise management clearly in the specific direction. Table 3. The growth evaluation of high-tech SMEs Caprojection method tastrophe theory Principle component Firm Number Before Normaliormalization Befon Combination zation After Nore NormalizationAfter Normalizati 1 0.794 0.835 0.206 0.587 0.711 2 0.0.697 773 0.813 0.204 0.581 3 0.390 0.410 0.077 0.219 0.315 4 0.951 1.000 0.351 1.000 1.000 6 0.624 0.656 0.171 0.487 0.572 7 0.390 0.410 0.077 0.219 0.315 8 0.856 0.900 0.249 0.709 0.805 9 0.411 0.432 0.050 0.142 0.287 10 0.913 0.960 0.308 0.877 0.919 11 0.781 0.821 0.195 0.556 0.688 12 0.446 0.469 0.060 0.171 0.320 13 0.841 0.884 0.233 0.664 0.774 14 0.902 0.948 0.292 0.832 0.890 15 0.841 0.884 0.233 0.664 0.774 16 0.841 0.884 0.233 0.664 0.774 17 0.841 0.884 0.233 0.664 0.774 18 0.781 0.821 0.195 0.556 0.688 19 0.781 0.821 0.195 0.556 0.688 20 0.841 0.884 0.233 0.664 0.774 21 0.438 0.461 0.058 0.165 0.313 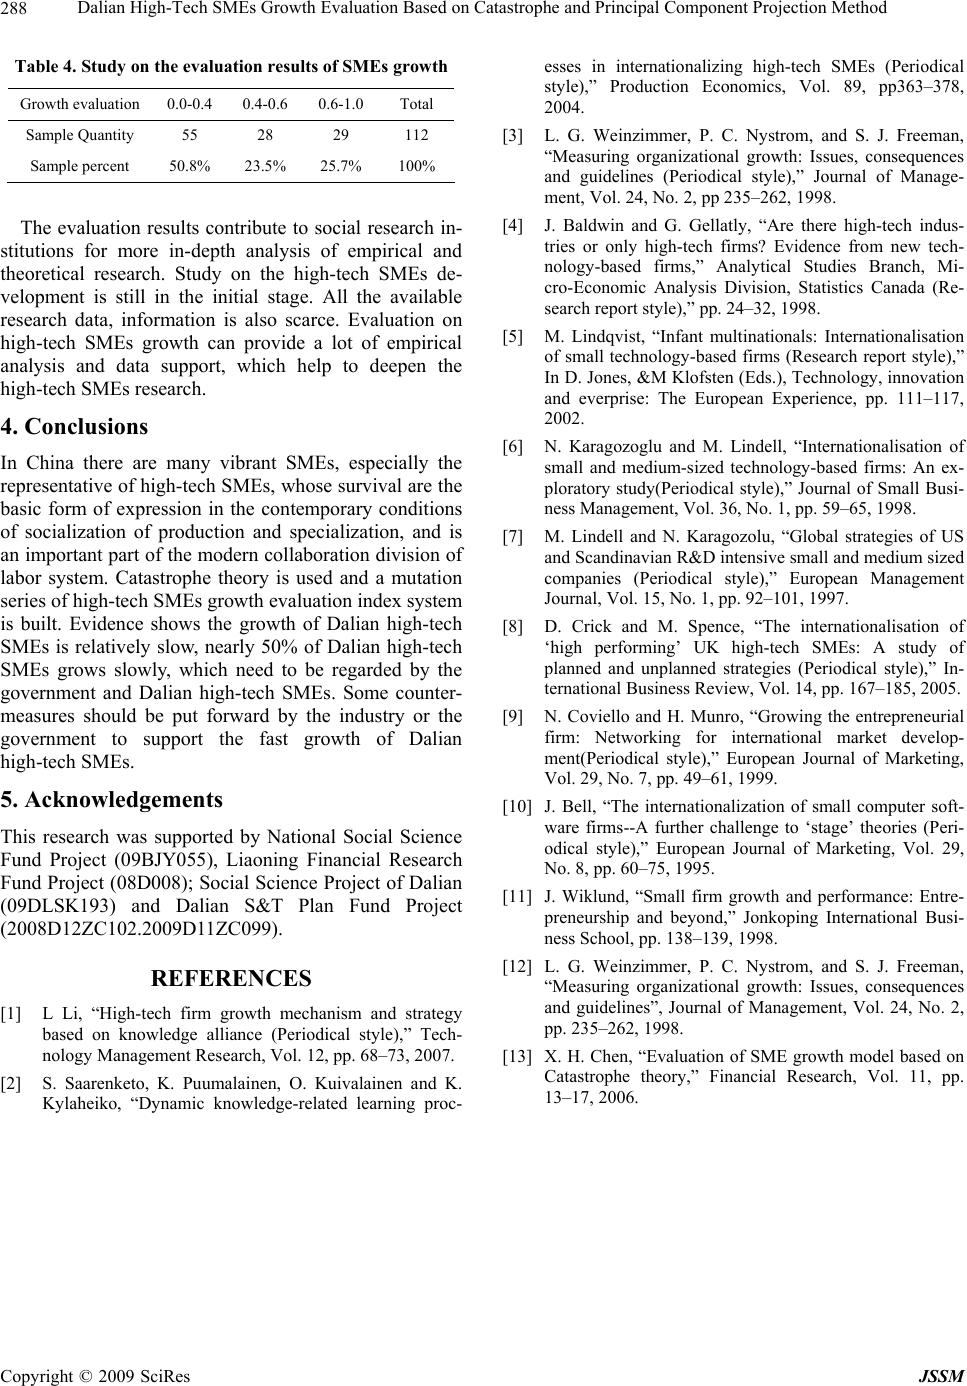 Dalian High-Tech SMEs Growth Evaluation Based on Catastrophe and Principal Component Projection Method 288 Table 4. Study on the eva results of SMEs Growth 0.0-0.4 0.4-0.6 0.6-1.0 luation growth evaluation Total Sample Quantity 55 28 29 112 Sample percent 50.8% 23.5% 25.7% 100% T reo esearch in- titutions for more in-depth analysis of empirical and brant SMEs, especially the h-tech SMEs, whose survival are the y National Social Science iaoning Financial Research [1] L Li, “High-tech firm growth mechanism and stra based on knoical style),” T esses in internationalizingMEsdical styleoduction EconVol. 89, –378, he evaluationsults contribute tsocial r s theoretical research. Study on the high-tech SMEs de- velopment is still in the initial stage. All the available research data, information is also scarce. Evaluation on high-tech SMEs growth can provide a lot of empirical analysis and data support, which help to deepen the high-tech SMEs research. 4. Conclusions any viIn China there are m representative of hig olo basic form of expression in the contemporary conditions of socialization of production and specialization, and is an important part of the modern collaboration division of labor system. Catastrophe theory is used and a mutation series of high-tech SMEs growth evaluation index system is built. Evidence shows the growth of Dalian high-tech SMEs is relatively slow, nearly 50% of Dalian high-tech SMEs grows slowly, which need to be regarded by the government and Dalian high-tech SMEs. Some counter- measures should be put forward by the industry or the government to support the fast growth of Dalian high-tech SMEs. 5. Acknowledgements This research was supported b Fund Project (09BJY055), L of M Fund Project (08D008); Social Science Project of Dalian (09DLSK193) and Dalian S&T Plan Fund Project (2008D12ZC102.2009D11ZC099). REFERENCES tegy ech- gement, Vol. 24, No. 2, pp. 235–262, 1998. [13] X. H. Chen, “Evaluation of SME growth model based on Catastrophe theory,” Financial Research, Vol. 11, pp. 13–17, 2006. wledge alliance (Period nology Management Research, Vol. 12, pp. 68–73, 2007. [2] S. Saarenketo, K. Puumalainen, O. Kuivalainen and K. Kylaheiko, “Dynamic knowledge-related learning proc- high-tech S (Perio ),” Promics, pp363 2004. [3] L. G. Weinzimmer, P. C. Nystrom, and S. J. Freeman, “Measuring organizational growth: Issues, consequences and guidelines (Periodical style),” Journal of Manage- ment, Vol. 24, No. 2, pp 235–262, 1998. [4] J. Baldwin and G. Gellatly, “Are there high-tech indus- tries or only high-tech firms? Evidence from new tech- nology-based firms,” Analytical Studies Branch, Mi- cro-Economic Analysis Division, Statistics Canada (Re- search report style),” pp. 24–32, 1998. [5] M. Lindqvist, “Infant multinationals: Internationalisation of small technology-based firms (Research report style),” In D. Jones, &M Klofsten (Eds.), Techngy, innovation and everprise: The European Experience, pp. 111–117, 2002. [6] N. Karagozoglu and M. Lindell, “Internationalisation of small and medium-sized technology-based firms: An ex- ploratory study(Periodical style),” Journal of Small Busi- ness Management, Vol. 36, No. 1, pp. 59–65, 1998. [7] M. Lindell and N. Karagozolu, “Global strategies of US and Scandinavian R&D intensive small and medium sized companies (Periodical style),” European Management Journal, Vol. 15, No. 1, pp. 92–101, 1997. [8] D. Crick and M. Spence, “The internationalisation of ‘high performing’ UK high-tech SMEs: A study of planned and unplanned strategies (Periodical style),” In- ternational Business Review, Vol. 14, pp. 167–185, 2005. [9] N. Coviello and H. Munro, “Growing the entrepreneurial firm: Networking for international market develop- ment(Periodical style),” European Journal of Marketing, Vol. 29, No. 7, pp. 49–61, 1999. [10] J. Bell, “The internationalization of small computer soft- ware firms--A further challenge to ‘stage’ theories (Peri- odical style),” European Journalarketing, Vol. 29, No. 8, pp. 60–75, 1995. [11] J. Wiklund, “Small firm growth and performance: Entre- preneurship and beyond,” Jonkoping International Busi- ness School, pp. 138–139, 1998. [12] L. G. Weinzimmer, P. C. Nystrom, and S. J. Freeman, “Measuring organizational growth: Issues, consequences and guidelines”, Journal of Mana Copyright © 2009 SciRes JSSM |