Paper Menu >>
Journal Menu >>
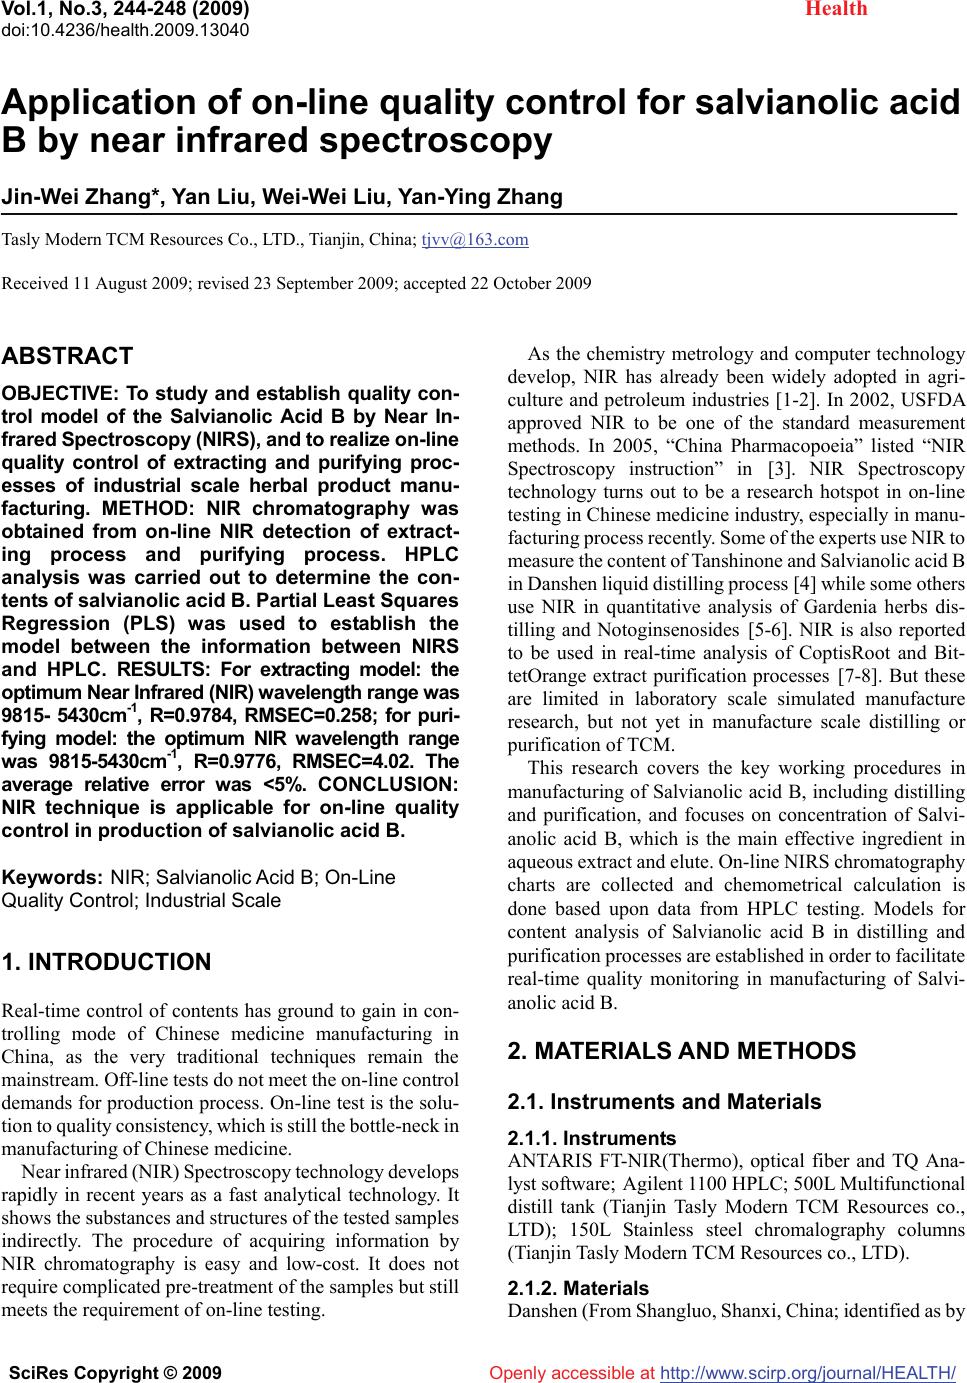 Vol.1, No.3, 244-248 (2009) doi:10.4236/health.2009.13040 SciRes Copyright © 2009 http://www.scirp.org/journal/HEALTH/ Health Openly accessible at Application of on-line quality control for salvianolic acid B by near infrared spectroscopy Jin-Wei Zhang*, Yan Liu, Wei-Wei Liu, Yan-Ying Zhang Tasly Modern TCM Resources Co., LTD., Tianjin, China; tjvv@163.com Received 11 August 2009; revised 23 September 2009; accepted 22 October 2009 ABSTRACT OBJECTIVE: To study and establish quality con- trol model of the Salvianolic Acid B by Near In- frared Spectroscopy (NIRS), and to realize on-line quality control of extracting and purifying proc- esses of industrial scale herbal product manu- facturing. METHOD: NIR chromatography was obtained from on-line NIR detection of extract- ing process and purifying process. HPLC analysis was carried out to determine the con- tents of salvianolic acid B. Partial Least Squares Regression (PLS) was used to establish the model between the information between NIRS and HPLC. RESULTS: For extracting model: the optimum Near Infrared (NIR) wavelength range was 9815- 5430cm-1, R=0.9784, RMSEC=0.258; for puri- fying model: the optimum NIR wavelength range was 9815-5430cm-1, R=0.9776, RMSEC=4.02. The average relative error was <5%. CONCLUSION: NIR technique is applicable for on-line quality control in production of salvianolic acid B. Keywords: NIR; Salvianolic Acid B; On-Line Quality Control; Industrial Scale 1. INTRODUCTION Real-time control of contents has ground to gain in con- trolling mode of Chinese medicine manufacturing in China, as the very traditional techniques remain the mainstream. Off-line tests do not meet the on-line control demands for production process. On-line test is the solu- tion to quality consistency, which is still the bottle-neck in manufacturing of Chinese medicine. Near infrared (NIR) Spectroscopy technology develops rapidly in recent years as a fast analytical technology. It shows the substances and structures of the tested samples indirectly. The procedure of acquiring information by NIR chromatography is easy and low-cost. It does not require complicated pre-treatment of the samples but still meets the requirement of on-line testing. As the chemistry metrology and computer technology develop, NIR has already been widely adopted in agri- culture and petroleum industries [1-2]. In 2002, USFDA approved NIR to be one of the standard measurement methods. In 2005, “China Pharmacopoeia” listed “NIR Spectroscopy instruction” in [3]. NIR Spectroscopy technology turns out to be a research hotspot in on-line testing in Chinese medicine industry, especially in manu- facturing process recently. Some of the experts use NIR to measure the content of Tanshinone and Salvianolic acid B in Danshen liquid distilling process [4] while some others use NIR in quantitative analysis of Gardenia herbs dis- tilling and Notoginsenosides [5-6]. NIR is also reported to be used in real-time analysis of CoptisRoot and Bit- tetOrange extract purification processes [7-8]. But these are limited in laboratory scale simulated manufacture research, but not yet in manufacture scale distilling or purification of TCM. This research covers the key working procedures in manufacturing of Salvianolic acid B, including distilling and purification, and focuses on concentration of Salvi- anolic acid B, which is the main effective ingredient in aqueous extract and elute. On-line NIRS chromatography charts are collected and chemometrical calculation is done based upon data from HPLC testing. Models for content analysis of Salvianolic acid B in distilling and purification processes are established in order to facilitate real-time quality monitoring in manufacturing of Salvi- anolic acid B. 2. MATERIALS AND METHODS 2.1. Instruments and Materials 2.1.1. Instruments ANTARIS FT-NIR(Thermo), optical fiber and TQ Ana- lyst software; Agilent 1100 HPLC; 500L Multifunctional distill tank (Tianjin Tasly Modern TCM Resources co., LTD); 150L Stainless steel chromalography columns (Tianjin Tasly Modern TCM Resources co., LTD). 2.1.2. Materials Danshen (From Shangluo, Shanxi, China; identified as by 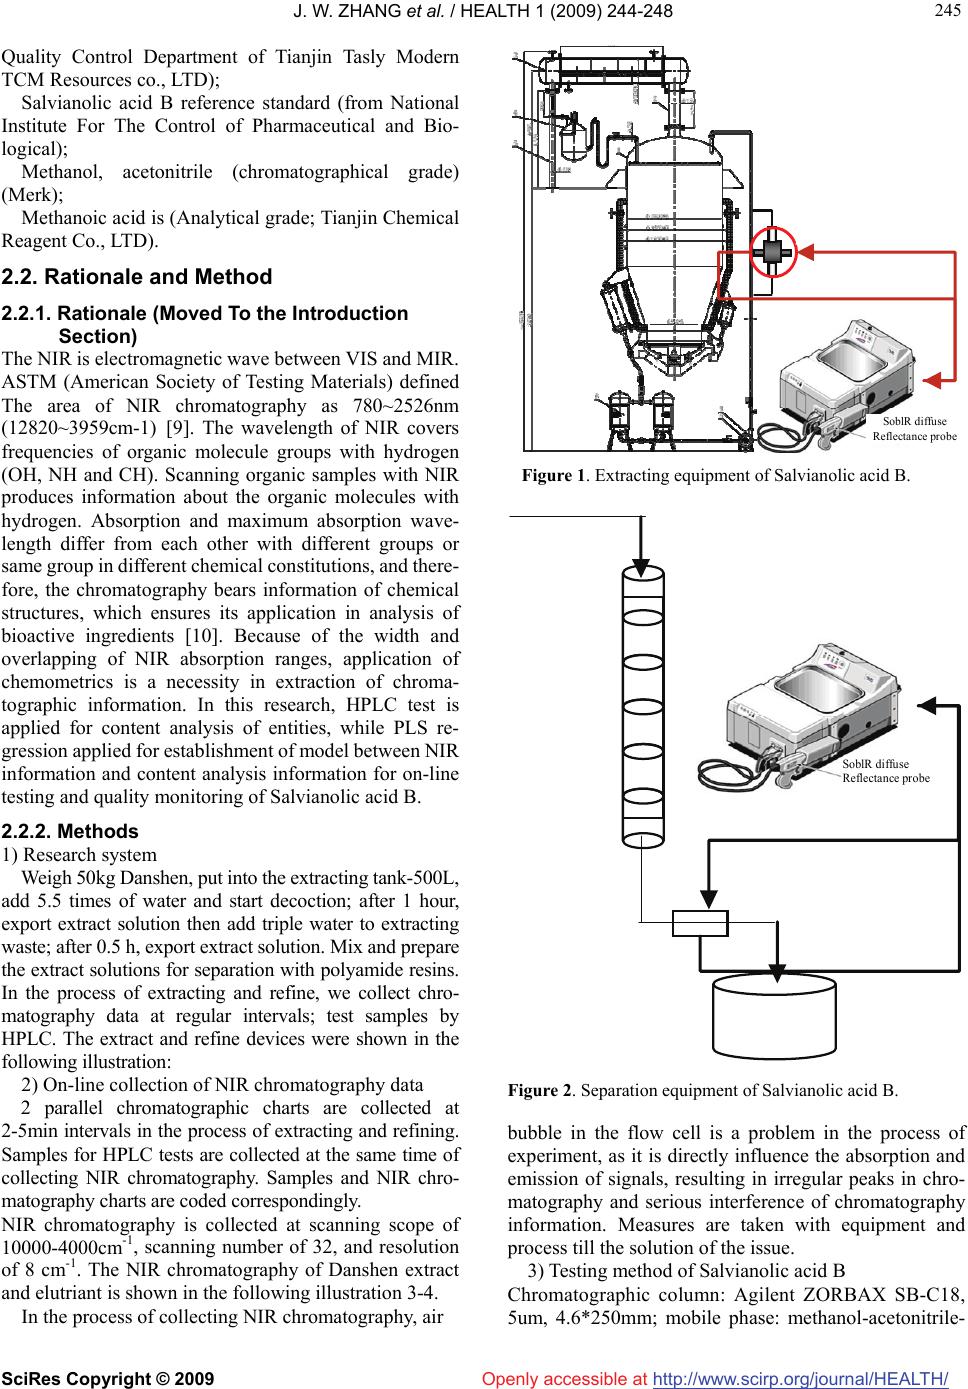 J. W. ZHANG et al. / HEALTH 1 (2009) 244-248 SciRes Copyright © 2009 http://www.scirp.org/journal/HEALTH/ 245 245 Openly accessible at Quality Control Department of Tianjin Tasly Modern TCM Resources co., LTD); Salvianolic acid B reference standard (from National Institute For The Control of Pharmaceutical and Bio- logical); Methanol, acetonitrile (chromatographical grade) (Merk); Methanoic acid is (Analytical grade; Tianjin Chemical Reagent Co., LTD). 2.2. Rationale and Method 2.2.1. Rationale (Moved To the Introduction Section) The NIR is electromagnetic wave between VIS and MIR. ASTM (American Society of Testing Materials) defined The area of NIR chromatography as 780~2526nm (12820~3959cm-1) [9]. The wavelength of NIR covers frequencies of organic molecule groups with hydrogen (OH, NH and CH). Scanning organic samples with NIR produces information about the organic molecules with hydrogen. Absorption and maximum absorption wave- length differ from each other with different groups or same group in different chemical constitutions, and there- fore, the chromatography bears information of chemical structures, which ensures its application in analysis of bioactive ingredients [10]. Because of the width and overlapping of NIR absorption ranges, application of chemometrics is a necessity in extraction of chroma- tographic information. In this research, HPLC test is applied for content analysis of entities, while PLS re- gression applied for establishment of model between NIR information and content analysis information for on-line testing and quality monitoring of Salvianolic acid B. 2.2.2. Methods 1) Research system Weigh 50kg Danshen, put into the extracting tank-500L, add 5.5 times of water and start decoction; after 1 hour, export extract solution then add triple water to extracting waste; after 0.5 h, export extract solution. Mix and prepare the extract solutions for separation with polyamide resins. In the process of extracting and refine, we collect chro- matography data at regular intervals; test samples by HPLC. The extract and refine devices were shown in the following illustration: 2) On-line collection of NIR chromatography data 2 parallel chromatographic charts are collected at 2-5min intervals in the process of extracting and refining. Samples for HPLC tests are collected at the same time of collecting NIR chromatography. Samples and NIR chro- matography charts are coded correspondingly. NIR chromatography is collected at scanning scope of 10000-4000cm-1, scanning number of 32, and resolution of 8 cm-1. The NIR chromatography of Danshen extract and elutriant is shown in the following illustration 3-4. In the process of collecting NIR chromatography, air SoblR diffuse Reflectance probe Figure 1. Extracting equipment of Salvianolic acid B. SoblR diffuse Reflectance probe Figure 2. Separation equipment of Salvianolic acid B. bubble in the flow cell is a problem in the process of experiment, as it is directly influence the absorption and emission of signals, resulting in irregular peaks in chro- matography and serious interference of chromatography information. Measures are taken with equipment and process till the solution of the issue. 3) Testing method of Salvianolic acid B Chromatographic column: Agilent ZORBAX SB-C18, 5um, 4.6*250mm; mobile phase: methanol-acetonitrile-  J. W. ZHANG et al. / HEALTH 1 (2009) 244-248 SciRes Copyright © 2009 http://www.scirp.org/journal/HEALTH/ 246 Openly accessible at Figure 3. NIR chromatography of salvianolic acid B extract. Figure 4. NIR chromatography of salvianolic acid elutriant. methanoic acid-water=30:10:1:59; detection wavelength: 286nm; flow rate: 1ml/min; column temp: 30C; injection: 5ul; preparation of reference substance solution: weigh accurately salvianolic acid B reference, and add it to the 75% methanol to make methanol solution of 0.14mg/ml; preparation of test solution: weigh accurately extract solution and elutriant, add it to the 75% methanol and dilute to 10ml, shake till well mixed, and then filtrate to the 0.45um. Filtrate is the test solution. 3. RESULTS AND DISCUSSIONS 3.1. Pretreatment of Chromatography Data In the process of collecting chromatography, environ- mental changes produce baseline excursion, while ran- dom noise of sample background produce influences on calibration results. Pretreatment of the chromatography data is conducted for the issue. Factorial analysis of various pretreatment methods and statistical factors in extracting and refining models are listed in Table 1 and Table 2. The methods of pretreatment are MSC, SNV, first- order differential equation, second-order differential equation, S-G (Savitzky-Golay) smooth and Norris De- rivative Filter smooth etc. 1st derivative +Norris is se- lected as the pretreatment for both extract and refine model accordingly. Table 1. Effect of various pretreatment methods on extracting model. Method of the chromatography pretreatment R RMSEC RMSECV Original chromatography 0.9581 0.358 0.389 MSC 0.8094 0.733 0.807 MSC+ 1st derivative 0.9169 0.498 0.566 MSC+ 2nd derivative 0.9055 0.530 0.911 MSC+1st derivative +Norris 0.8978 0.550 0.612 MSC+2nd derivative +Norris 0.8907 0.568 0.666 SNV 0.8131 0.727 0.800 SNV+1st derivative 0.9179 0.496 0.743 SNV+2nd derivative 0.9064 0.528 0.906 SNV+1st derivative +Norris 0.8988 0.547 0.610 SNV+2nd derivative +Norris 0.8906 0.568 0.666 1st derivative +Norris 0.9784 0.258 0.286 2nd derivative +Norris 0.9574 0.361 0.430 1st derivative +S-G 0.9746 0.279 0.378 2nd derivative +S-G 0.9110 0.515 0.761 Table 2. Effect of various pretreatment methods on purifying model. Method of the chromatography pretreatment R RMSEC RMSECV Original chromatography 0.6681 14.9 15.8 MSC 0.7782 12.6 13.4 MSC+1st derivative 0.9657 5.27 7.09 MSC+2nd derivative 0.9761 4.38 11.3 MSC+1st derivative +Norris 0.9635 5.39 6.95 MSC+2nd derivative +Norris 0.9524 6.15 7.05 SNV 0.9313 7.34 8.18 SNV+1st derivative 0.9624 5.49 6.99 SNV+2nd derivative 0.9730 4.65 11.5 SNV+1st derivative +Norris 0.9551 5.97 6.80 SNV+2nd derivative +Norris 0.9500 6.28 7.06 1st derivative +Norris 0.9776 4.02 4.42 2nd derivative +Norris 0.9668 5.26 6.09 1st derivative +S-G 0.9733 4.56 5.53 2nd derivative +S-G 0.9760 4.46 9.59 3.2. Selection for the Best Principal Factors In regression for the models with PLS, rational selection of principal factors is critical to avoid “over fitting”. Through LOOCV (leave-one-out cross-validation), we inspect the influence principal factors to RMSECV (Root-Mean-Square Error of Cross-Validation). The re- sults for extracting and refining models are in Figure 5  J. W. ZHANG et al. / HEALTH 1 (2009) 244-248 SciRes Copyright © 2009 http://www.scirp.org/journal/HEALTH/ 247 247 Openly accessible at and Figure 6. When the principal factor number is 5, the RMSECV is 0.286 and reaches pleateau phase. It is decided the prin- cipal factor number is 5. From Figure 6, RMSECV reaches peak at 4.42 when principal factor number of refining model is 6. 3.3. Selection of Chromatography Scope The decision of chromatography scope is the most diffi- cult step in the quantitative analysis model of NIR, as the calculation is not well established in chemometrics. The wave band of 9815-5430 cm-1 is validated as the optimal chromatography scope with optimized correlation coeffi- cient and forecast effects. 3.4. Establishment of Models Salvianolic acid B contents in 6 batches are analyzed, while 473 experiment samples (222 from extracting process and 251 from refining process) are collected. First-order differential equation is the statistical method in establishment of Salvianolic acid B models through PLS. According to the result of cross-validation: extra- cting model: the best principal factor number is 5, correlation coefficient R=0.784, RMSEC=0.258; refin- ing model: the best principal factor number is 6, corr- elation coefficient R=0.9776, RMSEC=4.02. The correl- ation coefficients of predicted results and test results are shown as following table: 3.5. Evaluation of Prediction In order to validate the predict effect of the model or REF, a batch with the same manufacturing conditions, is pro- duced, and 19 extracting samples and 33 refining samples are collected respectively for the validation of the models. The trend in predicted values and test values of Salvia- nolic acid B is shown as following: Obvious from Figures 9 and 10, predicted values match test values in a constant and steady style with exceptions in few outliers. The relative error is less than 5 between predictive values and true values (3.2% in ex- tracting model and 4.8% in refining model). Abnormal data points may be result of several facts. First of all, NIR test requires tested content to be at least 0.1%. Very low target concentration leads to more errors in measurement. The on-line nature of the measurement also contributes in the errors, as test liquid is in constant movement in pipe- line, and instability, as well as formation of bubbles in circulation pool is inevitable. 4. CONCLUSIONS 1) NIR (near infrared) Spectroscopy technology have many strong points including convenience, time effec- tiveness, cost effectiveness, and environment friendliness. On the basis of the research and model, it is feasible to Figure 7. Correlation of salvianolic acid B’s content between actual and calculated. Figure 8. Correlation of salvianolic acid B’s content between actual and calculated. 0 1 2 3 4 5 135791113 15 17 19 mg/ml test values predicted values Figure 9. Predicted and test values of Salvianolic acid B content. 0 10 20 30 40 50 60 70 159 131721252933 mg/ml test values predicted values Figure 10. Predicted and test values of Salvianolic acid B content.  J. W. ZHANG et al. / HEALTH 1 (2009) 244-248 SciRes Copyright © 2009 http://www.scirp.org/journal/HEALTH/ 248 implement on-line testing and quality monitoring as the prediction effects of the extraction and refinement models are acceptable in manufacturing of Salvianolic acid B. Openly accessible at 2) Pretreatment of the chromatography data and prin- ciple factor number has influence on the accuracy of the model. Analysis and comparison of various conditions and is necessary in selection of the principal factors. 3) Extremely low concentration of target entity, insta- bility and bubble formation in the current have influence over collection of chromatography data and over accu- racy of the model in prediction. Necessary measurement should be taken to reduce the influences. REFERENCES [1] L. G. Weyer, (1985) Applied spectroscopy. [J]. Reviews, 21 (1-2), 1-8. [2] G. A. Lang, (1994) NIRs monitor critical gasoline pa- rameters. [J]. Hydrocarbon Process, 72(2), 69-72. [3] N. Wang and H. Wei, (2007) Application potentials of on-line near infrared spectroscopy technology in manu- facturing of traditional Chinese medicine. [J]. Journal of Shandong University of Traditional Chinese Medicine, 31(4), 350-353. [4] L. J. Ni, X. H. Shi, X. J. Gao, etc. (2004) Research on the application of on-line detection and analytical technique by NIR in quality control of water extracting process of Salvia miltiorrhiza. [J]. Chinese Pharmaceutical Journal, 39(8), 628-630. [5] S. K. Yan, L. A. Luo, Y. M. Wang, etc. (2006) Study on real-time control of extraction procedure of furitus gar- denia by near infrared spectroscopy. [J]. Spectroscopy and Spectral Analysis, 26(6), 1026-1030. [6] N. L. Yang, H. B. Qu, Y. Y. Cheng, (2002) Rapid quanti- fication of total saponins of Panax notoginseng by near infrared spectroscopy. [J]. Journal of Zhejiang University (Engineering Science), 36(4), 463-466. [7] N. L. Yang, H. B. Qu, Y. Y. Cheng, (2003) An approach to purifying process analysis of chinese herbal extracts using NIRS. [J]. Acta Chimica Sinica., 61(5), 742-747. [8] Z. B. Yang, L. J. Luan, (2005) Rapid determination of purifying process of Fructus Aurantii extracts by NIR transmission spectroscopy. [J]. Chinese Pharmaceutical Journal, 40(8), 615-618. [9] Z. L. Jiang, P. Zhu, X. Qin, (2007) The new advance on pharmaceutical and clinical application of near infrared spectroscopy. [J]. Strait Pharmaceutical Journal, 19(8), 118-120. [10] W. Z. Lu, H. F. Yuan, G. T. Xu, etc., (2000) Modern NIR technology. [M]. Bei Jing: China Petrochemical Press, 6-26. [11] X. L. Chu, H. F. Yuan, W. Z. Lu, (2006) Research and applications of near infrared spectroscopy in China in recent years. [J]. Analytical Instrumentation, (2), 1-9. |