Open Access Library Journal
Vol.06 No.06(2019), Article ID:92906,13 pages
10.4236/oalib.1105455
Analysis on the Relationships on the Global Distribution of the World Happiness Index and Selected Economic Development Indicators
Eden J. Garces, Cerenio Adriatico, Lovely Riza E. Timbal
College of Business and Management, Southern Leyte State University, San Juan, Philippines

Copyright © 2019 by author(s) and Open Access Library Inc.
This work is licensed under the Creative Commons Attribution International License (CC BY 4.0).
http://creativecommons.org/licenses/by/4.0/


Received: May 8, 2019; Accepted: June 2, 2019; Published: June 5, 2019
ABSTRACT
World Happiness Index generally indicates the level of happiness and satisfaction among the residents in a given country. This study was conducted to assess the relationships of the world happiness index (WHI) and related economic development indicators consisting of the variables of life expectancy (LE), expected years in schooling (EY), gross national income per capita (GNI) and the corruption perception index (CPI) of selected countries which were retrieved from online resources. Two separate cluster analysis was conducted on the 78 countries, and the five variables studied. The first results revealed 50 countries were assigned to cluster 1, 20 states to cluster 2, two countries in the group, and the final six countries in cluster 4. The poor performing countries representing cluster 1 were again subjected to a second cluster analysis test. The indicative results of the analysis showed a significant improvement in the grouping of countries. Group 1 has now 23 states, cluster 2 with 14 countries, and cluster 3 with 13 countries. The results of the two separate clustering analysis conducted yielded not a single group dominated as the best performing cluster in terms of the economic variables. However, cluster 1 considered the poor performing cluster during the two tests, remained consistent. In conclusion, the study claimed that the “Quality of Life” largely depends on the performance of countries based on the given economic indices.
Subject Areas:
Education, Sociology
Keywords:
Cluster Analysis, Economic Development Indicators, Poor Performing Countries, Quality of Life

1. Introduction
An economy is an interplay of production, distribution or trade, and consumption functions of goods, commodities, and services by different agents in a given geographical location. Economic agents such as individuals, businesses, organizations, or governments are responsible for making its economy boost for the social well-being of the entire citizens [1] . An Indian economist, points out, “economic growth is one aspect of the process of economic development”. This would mean that developing countries have sometimes experienced economic growth with little or no economic development initiatives since these countries functioned mainly as resource-providers to wealthy industrialized countries. Consistent growth causes development, because some of the increase in income is spent on human development initiatives [2] [3] . Economic growth and development entail a two-way relationship. The first chain consists of economic growth altogether benefiting human development since economic growth is likely to lead families and individuals of spending their heightened incomes to increase expenditures, which in turn, spurs economic development. The second chain, on the other hand, assumed, the consistent increase in consumption and spending, health, education, and infrastructure systems, would contribute to the overall economic growth of a given economy.
This notion implied that economic growth leads to human development, as social progress contributes to economic growth [3] . Hence, these two crucial concepts are considered mutually reinforcing. Traditionally, happiness is measured as a mental or emotional state of well-being defined by positive or pleasant emotions ranging from contentment to intense joy. While the human development report primarily focuses on expanding the choices of people, significantly valuing lives and improving the human condition, the world happiness report accounts for the happiness of the people and uses it as a guide in passing quality public policies and enhancing human development efforts. A standard measure of human development is the Human Development Index (HDI), formulated by the United Nations Development Programme using a geometric mean. The index encompasses statistics such as life expectancy at birth, an education index (calculated using mean years of schooling and expected years of education), and gross national income per capita. Economic growth and human development have a two-way relationship, and specific factors are linking them which are not yet explored further for some researches. It takes off from previous work [2] who provided an initial exploration of the two-way relationship between human development and economic growth. In addition to their work, this study emphasized that the happiness of the people living in a particular country would be significantly affected by the total development of the populace and the economy in its entirety. Accordingly, the world happiness index signified a direct relationship with the economic development factors leading to the general well-being of individuals and societies that include the full development of healthcare, politics, and higher employment. The corruption perception index meanwhile ranks countries by the perceived level of corruption in the public sector, meaning the higher the index, the lower the recognized corruption practices committed by government officials and personnel. Recent literature, however, contrasted human development described as the ultimate goal of the development process, with economic growth described as an imperfect proxy for the general welfare toward enhancing and increasing human growth and economic development. This discussion has broadened the definitions and goals of progress but still needs to delineate the central interrelationship between economic development and economic growth ensuring that greater freedom and capabilities improve financial performance, human development will have a significant effect on economic growth. Similarly, the scope that increased incomes will increase the range of choices and capabilities enjoyed by households and governments, economic growth will redound to a consistent human development growth [4] - [9] . In this paper, the relationships and the two-way linkages involved in world happiness index and selected indicators of economic development were analyzed under the condition that the happiness of a country is dependent upon the total economic growth and development. It was done by performing a cluster analysis on variables and countries involved in the study.
2. Theoretical and Conceptual Framework of the Study
The theory anchored in this study is the “New Growth Theory” [10] [11] . New Growth theory postulates that human desires and unlimited wants foster ever-increasing productivity and economic growth. The theory argues that real GDP per capita will perpetually increase because of people’s pursuit of profits. As competition lowers the advantage in one area, people have to continually seek better ways to do things or invent new products to garner a higher gain [12] [13] . This premise would further lead to further economic growth. Human development considering knowledge and skills are significant contributors to economic growth. Indeed, human development is seen as a critical driver of economic development. The implication is that, to attain development, economies should move away from an exclusive reliance on physical resources to expanding their knowledge base, and support the people that help develop and share knowledge.
The “New Growth Theory” should be discussed further to arrive at a mutual understanding [10] . Aside from the human capital that cultivates economic growth, the theory is best linked to human and social development. Life expectancy expected years in schooling, and gross national income helped to determine the development of the countries. Without these three salient factors, growth of human capital would be difficult to achieve. Life expectancy is defined as the statistical measure of how long an organism may live, based on the year of their birth, their current age, and other demographic factors including sex. Given the life expectancy, it would determine how long an individual would be of service to the community.
On the other hand, the expected years in schooling would also play a significant role in it. School life expectancy or most commonly known as the years scheduled in schooling is a measure of how many years of education a child would receive during the lifetime if the school enrollment rates stay the same as of today. This factor is used by statisticians to compare and assess the development of nations. Another factor concerning the theory in determining economic growth and human development is the gross national income of the country. Gross National Income is the total domestic, and foreign output claimed by residents of a country, consisting of gross domestic product (GDP) plus factor incomes earned by foreign residents, minus income earned in the local economy by nonresidents [14] [15] . Therefore, economic growth leads to human development, contributing to higher economic growth and prosperity. There exists a two-way relationship [2] [16] [17] [18] [19] . Human development is not only a product of economic growth but also input to it. Happiness and the quality of life of the people in the country rely on the variables mentioned because these would explain the current standards of living of the people assuming all things are held constant. Figure 1 demonstrates the linkage among the essential economic variables leading to economic growth and development that is, the quality of life.
3. Data and Methodology
The study utilized a multivariate descriptive - exploratory data analysis using the cluster analysis technique. The data for Life Expectancy, Expected Years in Schooling, and Gross National Income Per Capita was retrieved from the United Nations Development Programme (UNDP) Human Development Report 2014. The data for the World Happiness Report 2014 and the Corruption Perception Index were downloaded from the United Nations Sustainable Development Solutions Network (SDSN) and Transparency International online resources. This study employed the cluster analysis to group the observations based on the characteristics they possess. As a multivariate technique, it grouped attributes that made them similar. If plotted geometrically, the views within the clusters will be closed together while the distance between clusters will be farther apart. The quality of life model used in this study was given by:
X1 = World Happiness Index (WHI)
X2 = Life Expectancy (LE)
X3 = Expected Years in Schooling (EY)
X4 = Gross National Income Per Capita (GNI)
X5 = Corruption Perception Index (CPI)
This model assumes the key indicators will spur economic growth and development in any given country or territory.
Moreover, correlations test were utilized to establish significant relationships among the identified variables using a 5% level of significance. The data of 78 countries and the indicators included in the study are presented in Table 1.

Figure 1. The Conceptual Framework of the Study.

Table 1. List the countries and economic variables of the study.
4. Results and Discussion
4.1. Cluster Analysis of 78 Countries
The visual presentations in Figure 2, Figure 3, and Figure 4 revealed the four clusters among 78 countries based on the similarity index. The 50 countries grouped in cluster 1 include Albania, Algeria, Angola, Argentina, Belarus, Bolivia, Brazil, Bulgaria, Chile, China, Columbia, Costa Rica, Croatia, Cyprus, Czech Republic, Ecuador, Estonia, Guatemala, Honduras, India, Indonesia, Jamaica, Jordan, Kazakhstan, Libya, Lithuania, Malaysia, Malta, Mauritius, Mexico, Moldova, Montenegro, Nicaragua, Nigeria, Panama, Paraguay, Peru, Poland, Portugal, Russia, Slovakia, Slovenia, Suriname, Thailand, Turkey, Turkmenistan, Uruguay, Uzbekistan and Vietnam.
The 20 countries in cluster 2 comprised of Australia, Canada, Belgium, Bahrain, Finland, France, Ireland, United Kingdom, Austria, Germany, Denmark, Netherlands, Sweden, Oman, Japan, Israel, Italy, New Zealand, and Spain.
The two countries in cluster 3 consisted of Kuwait and Singapore. Finally, the six states in group 4 are Luxembourg, United Arab Emirates, Norway, Saudi Arabia, United States, and Switzerland. The final partition on the number of observations is presented in Table 2.

Figure 2. Countries grouped in cluster 1 (50/78).

Figure 3. Countries grouped in cluster 2 (20/78).

Figure 4. Countries grouped in clusters 3 (2/78) and 4 (6/78).
Table 2. Final Partition of the observations.
The results of the final partition in Table 2 showed that cluster 3 had the lowest within-cluster sum of squares and the average distance from the centroid. In general, the countries in cluster 2 exhibited a more compact and cohesive group.
Meanwhile, the clustering of countries presented in Table 3 is mainly determined by the relationship among the key development factor variables used in the study revealing both consistent and contradictory results.
The 50 countries in cluster 1 are characterized by contrasting results in all the variables investigated. For instance Cyprus registered the highest income average of 28,633 USD but Honduras had the lowest income average of only 3938 USD. In terms of happiness, the mean value of 5.91 is closer to the median of 5.72 making the distribution normal. In this cluster, Brazil registered as the happiest country with a score of 7.43. The variable of longevity on the other hand had Chile with an average life span of 81.7 years while Angola had the lowest age average of only 52.3 years old. In the field of education, Argentina had the highest expected years of 17.95 compared to Nigeria which averages only to 8.99 years. For the corruption perception index, Turkmenistan was viewed as the most corrupt country with a perception score of 17 while Chile topped the list as the least corrupt country having a higher rating of 73. As per the United Nations Human Development Report, 19 countries are classified as very high human development, 22 countries as high human development, 8 countries as medium human development, and 1 country as low human development. The reason for the inclusion of the 19 countries in cluster 1 is their combined average of the gross national income per capita accounts only to 22,653.32 which is below the mean income of clusters 2, 3 and 4.
The 20 countries of cluster 2 performed best in the areas of happiness, longevity and expected years of schooling. With an average gross national income per capita of 38,903.90 USD, Sweden topped the list with 45,635.50 USD while Israel had the lowest per capita of 30,675.50 USD.
The 2 countries in cluster 3 also did better in the area of happiness having a mean index of 6.7 and have the highest average income of 80,294.40 USD. This cluster could have outpaced all the other 3 clusters in its overall performance of the development indicators if Kuwait had higher longevity and corruption perception index. Incidentally, the CPI score and life span of this country is only 44 and 74.3 respectively, compared with Singapore that has an overall rating of 84 for the corruption index and 83 for the life span. Accordingly a lower CPI constitutes higher corrupt practices pervading the country. Meanwhile, the final 6 countries that comprise cluster 4 also performed best in the areas of happiness and corruption perception index. The citizens of these countries unanimously perceived their governments are clean, transparent and continuously practice good housekeeping and governance.
The results in this multi-dimensional look across all variables and countries supported the human development index report done by the United Nations Development Programme classifying the countries and territories into “very high human development”, “high human development”, medium human development”, and “low human development”.
4.2. Testing Significant Relationships
The results presented in Table 4 showed a high to very high positive correlation observed on the variables tested. The results also suggested the existence of significant relationships between and among the variables.
Table 3. Cluster Centroids of the observations and variables.
Table 4. Sample characteristics of the correlations test of development factors.
Significant at <0.05.
4.3. Cluster Analysis of 50 Countries
The analysis performed for the 50 countries that comprised cluster 1 earlier generally revealed that countries with higher values on world happiness index, life expectancy, expected years of schooling, gross national income per capita and corruption perception index veered into grouping either as cluster 2 or cluster 3. This new dimension is reflected transparently in the accompanying dendrogram in Figure 5.
The observations drawn from Figure 5 demonstrated that there are already 23 countries that comprise cluster 1, 14 states in group 2 and 13 countries formed in cluster 3. Cluster 1 accounts to around 46% of the total number of countries studied.
The latest cluster analysis result identified the countries in cluster 1 now comprise of Albania, Algeria, Angola, Bolivia, Colombia, Costa Rica, Ecuador, Guatemala, Honduras, Indonesia, Jamaica, Jordan, Moldova, Nicaragua, Nigeria, Paraguay, Peru, Thailand, Turkmenistan, Uzbekistan, and Vietnam. This grouping also includes two of the world’s largest countries, China and India. Besides, countries like Albania, Algeria, Columbia, and Costa Rica, which are classified as high human development by the UNDP.
Meanwhile, the countries of Argentina, Chile, Cyprus, Czech Republic, Estonia, Kazakhstan, Lithuania, Malaysia, Malta, Poland, Portugal, Russia, Slovakia, and Slovenia were grouped into cluster 2 an improvement from the first cluster analysis results. All the countries in the cluster are ranked very high human development by the UNDP.
Finally, Belarus, Brazil, Bulgaria, Croatia, Libya, Mauritius, Mexico, Montenegro, Panama, Suriname, Turkey, Uruguay, and Venezuela now comprised cluster 3.
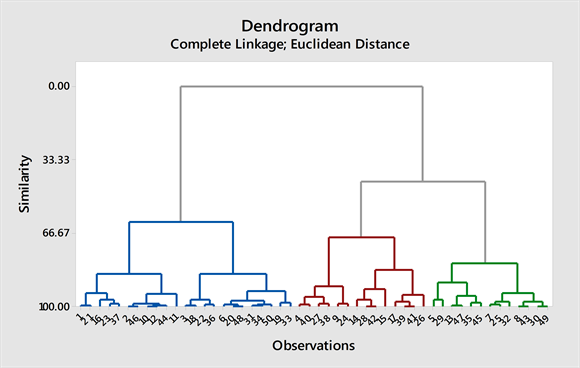
Figure 5. Dendrogram of 50 countries clustered.
The mixture of different and exciting results are presented in the final partition on the number of observations in Table 5 showing 23 countries in cluster 1, 14 countries in group 2 and 13 countries in cluster 3.
The results of the final partition presented in Table 5 revealed that cluster 3 had the lowest within-cluster sum of squares and the average distance from the centroid indicating the countries exhibited a more compact and cohesive range.
The cluster centroids presented in Table 6 revealed that the 23 are highly characterized by lower years of schooling, income per capita, and corruption index. The meager results in this cluster can also be attributed to lower incomes of Nigeria, India, and Angola. Nevertheless, these countries also considered relatively happy having acceptable levels of longevity, education, and per capita income, but they have the lowest corruption perception index average of 33. These stark results suggest that around 99% of the countries have a CPI below 50. Additionally, the sample descriptive statistical results of cluster 2 countries are presented in accompanying Table 7.
A highlight in this table revealed the country that has the lowest corruption perception index is Turkmenistan. Other countries with scores below 30 include Angola (19), Uzbekistan (18), Honduras (29), Nicaragua (28), Nigeria (27), and Paraguay (24). Having the lowest corruption perception index, the citizens of these countries viewed the existence of unabated corrupt practices in the public sector.
The cluster centroid presented in Table 6 signified that cluster 2, the countries are best in the areas of life expectancy, expected years of schooling, average income, and the corruption perception index. The happiness index in this cluster is almost closer to the index of group 3. The results of the descriptive statistics test for this cluster are presented in Table 8.
Although the average CPI of this cluster is 53.07 and considered acceptable, three countries are contributory to the overall perception index below 50. These are Argentina, Kazakhstan, and Russia.
Cluster 3 considered the second better performing cluster have the highest index for happiness and satisfaction with a mean score of 6.2, but the corruption perception index is way below the 50 passing marks. A sample descriptive statistical results of this cluster is presented in Table 9.
The sample characteristics results showed the mean CPI of only 40 are attributed to the lower perception index of Belarus (31), Libya (18), Mexico (35), Panama (37), Suriname (36) and Venezuela (19). It is on the premise that the residents of these countries perceived higher levels of graft and corrupt practices are committed across the public sector. Overall, they consider themselves happy and satisfied.
4.4. Testing of Significant Relationships
In testing the significant relationships among the variables that were subjected to correlation analysis presented in Table 10 revealed only the variables of the world happiness index and life expectancy were found to be significantly related although the correlation was observed to be very low. The happiness index of the 50 countries no longer correlates with the variables of expected years of schooling, gross national income per capita, and the corruption index.
Table 5. Final Partition of the cluster analysis.
Table 6. Cluster centroids of observations and variables.
Table 7. Sample characteristics of cluster 1 countries.
Table 8. Sample descriptive statistics of cluster 2.
Table 9. Cluster 3 sample descriptive statistics results.
Table 10. Correlations of World Happiness Index and development factors.
The removal of the 28 countries compounded the contradicting results of the correlation test conducted between the world happiness index and the variables of expected years of schooling, gross national income per capita and the corruption perception index included earlier in the first testing. These countries consistently have higher indices of the variables studied. For instance the no relationship existed between the world happiness index and expected years of schooling was caused by the lower years of education in countries like Albania (11.82), Angola (11.39), Guatemala (10.69), Nicaragua (11.51), Nigeria (8.99), Paraguay (11.91), Turkmenistan (10.80), Uzbekistan (11.51) and Vietnam (11.9). Testing between WPI and the gross national income per capita discovered 26 countries have average income below the mean of 15,269 USD. Regarding the corruption perception index, there were 30 countries with CPI below the mean of 40.50. The variations of the data validated the non-existence of significant relationships between the WHI and the related variables.
5. Conclusion
The study concluded that the clustering of countries and the related economic variables yielded relevant information that can be utilized in developing a suitable framework for policy-making decision processes by all political actors across the region and the national levels that will ultimately improve the standards of living of the citizens. One obstacle to development efforts, noted in the study, is how those corrupt practices could be addressed and given special attention by the concerned government officials emanating from the national level down to the local level. The cluster analysis is one statistical tool to uncover the hidden dimensions of the observations included in the study. As found out in the study, the countries with higher and consistent economic development indices tend to group into a single cluster based on the similarity level. The study, thus, proposed a new learning theory on the quality of life signifying that development and prosperity vary directly of the countries’ well-being, longevity, level of investment in education, income and perceived corrupt practices are assuming that all other related indicators are held constantly, and that developmental factors vary directly to a world happiness index. It is recommended that in the future undertaking of a similar activity, economic data may be increased to arrive at more accurate findings and results.
Conflicts of Interest
The authors declare no conflicts of interest regarding the publication of this paper.
Cite this paper
Garces, E.J., Adriatico, C. and Timbal, L.R.E. (2019) Analysis on the Relationships on the Global Distribution of the World Happiness Index and Selected Economic Development Indicators. Open Access Library Journal, 6: e5455. https://doi.org/10.4236/oalib.1105455
References
- 1. Nussbaum, M. and Sen, A. (1993) The Quality of Life. Clarendon Press, Oxford.
https://doi.org/10.1093/0198287976.001.0001 - 2. Ranis, G., Stewart, F. and Ramirez, A. (2000) Economic Growth and Human Development. World Development, 28, 197-219.
https://doi.org/10.1016/S0305-750X(99)00131-X - 3. Chiappero-Martinetti, E., von Jacobi, N. and Signorelli, M. (2015) Human Development and Economic Growth. Palgrave Dictionary of Emerging Markets and Transition Eco-nomics, 223-244. https://doi.org/10.1007/978-1-137-37138-6_13
- 4. Easterlin, R.A. (2015) Happiness and Economic Growth—The Evidence. In: Global Handbook of Quality of Life, Springer, Dordrecht, 283-299.
https://doi.org/10.1007/978-94-017-9178-6_12 - 5. Ranis, G. (2004) Human Development and Economic Growth. Yale University Economic Growth Center, New Haven, Discussion Paper, 887.
- 6. Suri, T., Boozer, M.A., Ranis, G. and Stewart, F. (2011) Paths to Success: The Relationship between Human Development and Economic Growth. World Development, 39, 506-522. https://doi.org/10.1016/j.worlddev.2010.08.020
- 7. Cingano, F. (2014) Trends in Income Inequality and Its Impact on Economic Growth.
- 8. Fleisher, B., Li, H. and Zhao, M.Q. (2010) Human Capital, Economic Growth, and Regional Inequality in China. Journal of Development Economics, 92, 215-231.
https://doi.org/10.1016/j.jdeveco.2009.01.010 - 9. Helliwell, J., Layard, R. and Sachs, J. (2012) World Happiness Report.
- 10. Sengupta, J.K. (1998) New Growth Theory.
- 11. Sullivan, A. and Sheffrin, S.M. (2012) Economics: Principles in Action. Pearson Prentice Hall, Upper Saddle River, 473.
- 12. Romer, P.M. (1994) The Origins of Endogenous Growth. The Journal of Economic Perspectives, 8, 3-22. https://doi.org/10.1257/jep.8.1.3
- 13. Schumpeter, J. and Backhaus, U. (2003) The Theory of Economic Development. In: Backhaus, J., Ed., Joseph Alois Schumpeter, Springer, Berlin, 61-116.
https://doi.org/10.1007/0-306-48082-4_3 - 14. Todaro, M.P. and Smith, S.C. (2011) Economic Development. 11th Edition, Pearson Education Limited, Harlow.
- 15. Sen, A. (1983) Development: Which Way Now? Economic Journal, 93, 745-762.
https://doi.org/10.2307/2232744 - 16. Streeten, P. (1994) Human Development: Means and Ends. Human Development, 84, 232-237.
- 17. Anand, S. (1994) Human Development Index: Methodology and Measurement (No. HDOCPA-1994-02). Human Development Report Office (HDRO), United Nations Development Programme (UNDP), New York.
- 18. O’Donnell, R. (1987) Real and Nominal Quantities. The New Palgrave: A Dictionary of Economics, 4, 97-98.
https://doi.org/10.1057/978-1-349-95121-5_1809-1 - 19. Ramirez, A. and Ranis, G. (1997) Economic Growth and Human Development (No. 787). Center Discussion Paper.