Paper Menu >>
Journal Menu >>
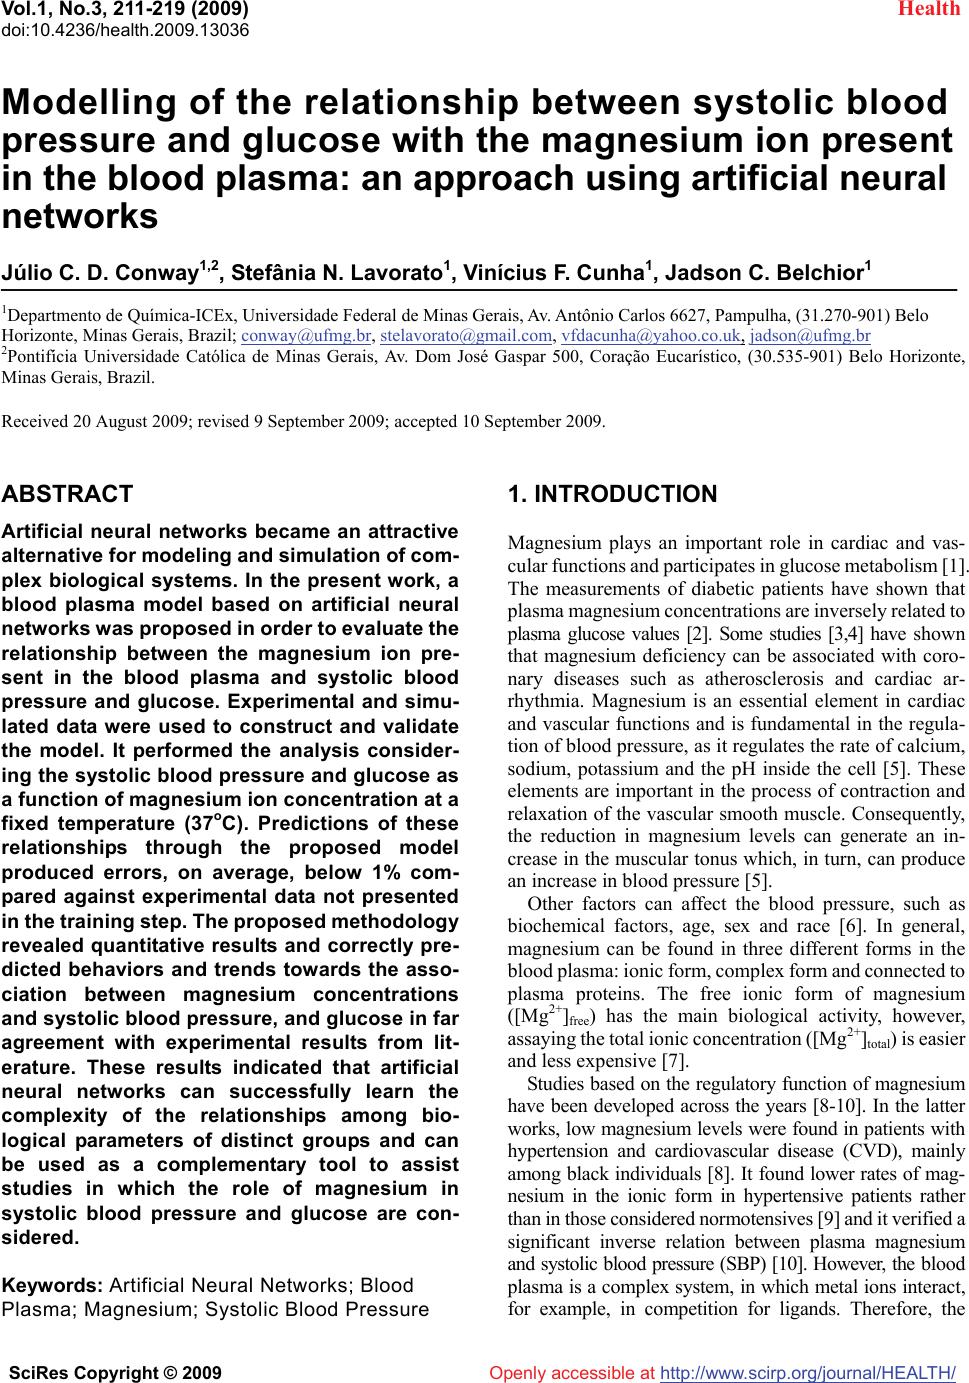 Vol.1, No.3, 211-219 (2009) doi:10.4236/health.2009.13036 SciRes Copyright © 2009 http://www.scirp.org/journal/HEALTH/ Health Openly accessible at Modelling of the relationship between systolic blood pressure and glucose with the magnesium ion present in the blood plasma: an approach using artificial neural networks Júlio C. D. Conway1,2, Stefânia N. Lavorato1, Vinícius F. Cunha1, Jadson C. Belchior1 1Departmento de Química-ICEx, Universidade Federal de Minas Gerais, Av. Antônio Carlos 6627, Pampulha, (31.270-901) Belo Horizonte, Minas Gerais, Brazil; conway@ufmg.br, stelavorato@gmail.com, vfdacunha@yahoo.co.uk, jadson@ufmg.br 2Pontifícia Universidade Católica de Minas Gerais, Av. Dom José Gaspar 500, Coração Eucarístico, (30.535-901) Belo Horizonte, Minas Gerais, Brazil. Received 20 August 2009; revised 9 September 2009; accepted 10 September 2009. ABSTRACT Artificial neural networks became an attractive alternative for modeling and simulation of com- plex biological systems. In the present work, a blood plasma model based on artificial neural networks was proposed in order to evaluate the relationship between the magnesium ion pre- sent in the blood plasma and systolic blood pressure and glucose. Experimental and simu- lated data were used to construct and validate the model. It performed the analysis consider- ing the systolic blood pressure and glucose as a function of magnesium ion concentration at a fixed temperature (37oC). Predictions of these relationships through the proposed model produced errors, on average, below 1% com- pared against experimental data not presented in the training step. The proposed methodology revealed quantitative results and correctly pre- dicted behaviors and trends towards the asso- ciation between magnesium concentrations and systolic blood pressure, and glucose in far agreement with experimental results from lit- erature. These results indicated that artificial neural networks can successfully learn the complexity of the relationships among bio- logical parameters of distinct groups and can be used as a complementary tool to assist studies in which the role of magnesium in systolic blood pressure and glucose are con- sidered. Keywords: Artificial Neural Networks; Blood Plasma; Magnesium; Systolic Blood Pressure 1. INTRODUCTION Magnesium plays an important role in cardiac and vas- cular functions and participates in glucose metabolism [1]. The measurements of diabetic patients have shown that plasma magnesium concentrations are inversely related to plasma glucose values [2]. Some studies [3,4] have shown that magnesium deficiency can be associated with coro- nary diseases such as atherosclerosis and cardiac ar- rhythmia. Magnesium is an essential element in cardiac and vascular functions and is fundamental in the regula- tion of blood pressure, as it regulates the rate of calcium, sodium, potassium and the pH inside the cell [5]. These elements are important in the process of contraction and relaxation of the vascular smooth muscle. Consequently, the reduction in magnesium levels can generate an in- crease in the muscular tonus which, in turn, can produce an increase in blood pressure [5]. Other factors can affect the blood pressure, such as biochemical factors, age, sex and race [6]. In general, magnesium can be found in three different forms in the blood plasma: ionic form, complex form and connected to plasma proteins. The free ionic form of magnesium ([Mg2+]free) has the main biological activity, however, assaying the total ionic concentration ([Mg2+]total) is easier and less expensive [7]. Studies based on the regulatory function of magnesium have been developed across the years [8-10]. In the latter works, low magnesium levels were found in patients with hypertension and cardiovascular disease (CVD), mainly among black individuals [8]. It found lower rates of mag- nesium in the ionic form in hypertensive patients rather than in those considered normotensives [9] and it verified a significant inverse relation between plasma magnesium and systolic blood pressure (SBP) [10]. However, the blood plasma is a complex system, in which metal ions interact, for example, in competition for ligands. Therefore, the 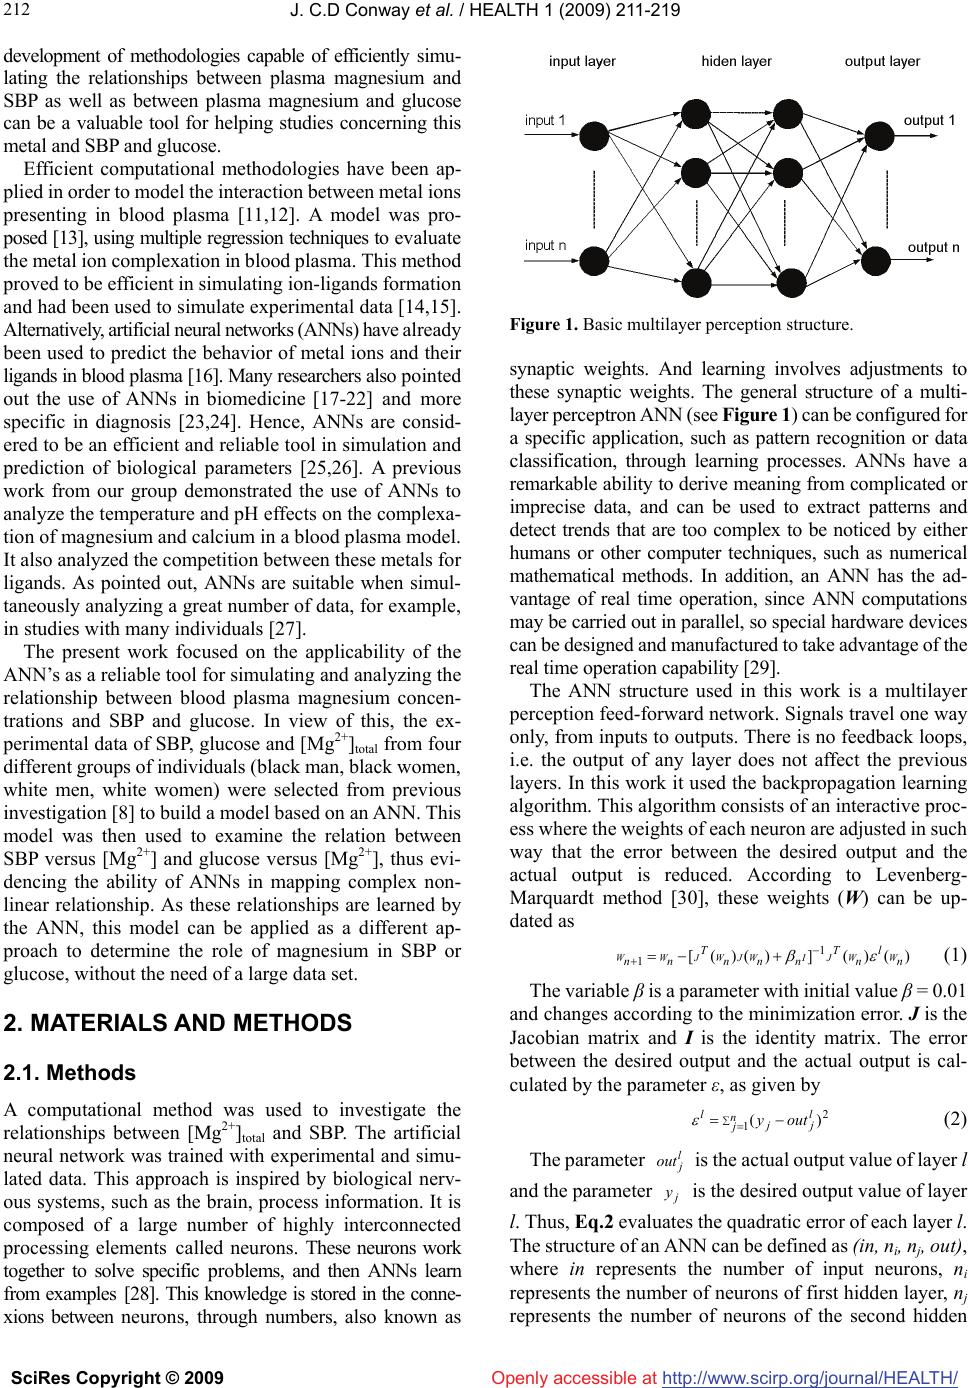 J. C.D Conway et al. / HEALTH 1 (2009) 211-219 SciRes Copyright © 2009 http://www.scirp.org/journal/HEALTH/ 212 Openly accessible at development of methodologies capable of efficiently simu- lating the relationships between plasma magnesium and SBP as well as between plasma magnesium and glucose can be a valuable tool for helping studies concerning this metal and SBP and glucose. Efficient computational methodologies have been ap- plied in order to model the interaction between metal ions presenting in blood plasma [11,12]. A model was pro- posed [13], using multiple regression techniques to evaluate the metal ion complexation in blood plasma. This method proved to be efficient in simulating ion-ligands formation and had been used to simulate experimental data [14,15]. Alternatively, artificial neural networks (ANNs) have already been used to predict the behavior of metal ions and their ligands in blood plasma [16]. Many researchers also pointed out the use of ANNs in biomedicine [17-22] and more specific in diagnosis [23,24]. Hence, ANNs are consid- ered to be an efficient and reliable tool in simulation and prediction of biological parameters [25,26]. A previous work from our group demonstrated the use of ANNs to analyze the temperature and pH effects on the complexa- tion of magnesium and calcium in a blood plasma model. It also analyzed the competition between these metals for ligands. As pointed out, ANNs are suitable when simul- taneously analyzing a great number of data, for example, in studies with many individuals [27]. The present work focused on the applicability of the ANN’s as a reliable tool for simulating and analyzing the relationship between blood plasma magnesium concen- trations and SBP and glucose. In view of this, the ex- perimental data of SBP, glucose and [Mg2+]total from four different groups of individuals (black man, black women, white men, white women) were selected from previous investigation [8] to build a model based on an ANN. This model was then used to examine the relation between SBP versus [Mg2+] and glucose versus [Mg2+], thus evi- dencing the ability of ANNs in mapping complex non- linear relationship. As these relationships are learned by the ANN, this model can be applied as a different ap- proach to determine the role of magnesium in SBP or glucose, without the need of a large data set. 2. MATERIALS AND METHODS 2.1. Methods A computational method was used to investigate the relationships between [Mg2+]total and SBP. The artificial neural network was trained with experimental and simu- lated data. This approach is inspired by biological nerv- ous systems, such as the brain, process information. It is composed of a large number of highly interconnected processing elements called neurons. These neurons work together to solve specific problems, and then ANNs learn from examples [28]. This knowledge is stored in the conne- xions between neurons, through numbers, also known as Figure 1. Basic multilayer perception structure. synaptic weights. And learning involves adjustments to these synaptic weights. The general structure of a multi- layer perceptron ANN (see Figure 1) can be configured for a specific application, such as pattern recognition or data classification, through learning processes. ANNs have a remarkable ability to derive meaning from complicated or imprecise data, and can be used to extract patterns and detect trends that are too complex to be noticed by either humans or other computer techniques, such as numerical mathematical methods. In addition, an ANN has the ad- vantage of real time operation, since ANN computations may be carried out in parallel, so special hardware devices can be designed and manufactured to take advantage of the real time operation capability [29]. The ANN structure used in this work is a multilayer perception feed-forward network. Signals travel one way only, from inputs to outputs. There is no feedback loops, i.e. the output of any layer does not affect the previous layers. In this work it used the backpropagation learning algorithm. This algorithm consists of an interactive proc- ess where the weights of each neuron are adjusted in such way that the error between the desired output and the actual output is reduced. According to Levenberg- Marquardt method [30], these weights (W) can be up- dated as )()(])()([ 1 1n l n T nnn T nn WWJIWJWJWW (1) The variable β is a parameter with initial value β = 0.01 and changes according to the minimization error. J is the Jacobian matrix and I is the identity matrix. The error between the desired output and the actual output is cal- culated by the parameter ε, as given by 2 1)( n j l jj louty (2) The parameter is the actual output value of layer l and the parameter is the desired output value of layer l. Thus, Eq.2 evaluates the quadratic error of each layer l. The structure of an ANN can be defined as (in, ni, nj, out), where in represents the number of input neurons, ni represents the number of neurons of first hidden layer, nj represents the number of neurons of the second hidden l j out j y 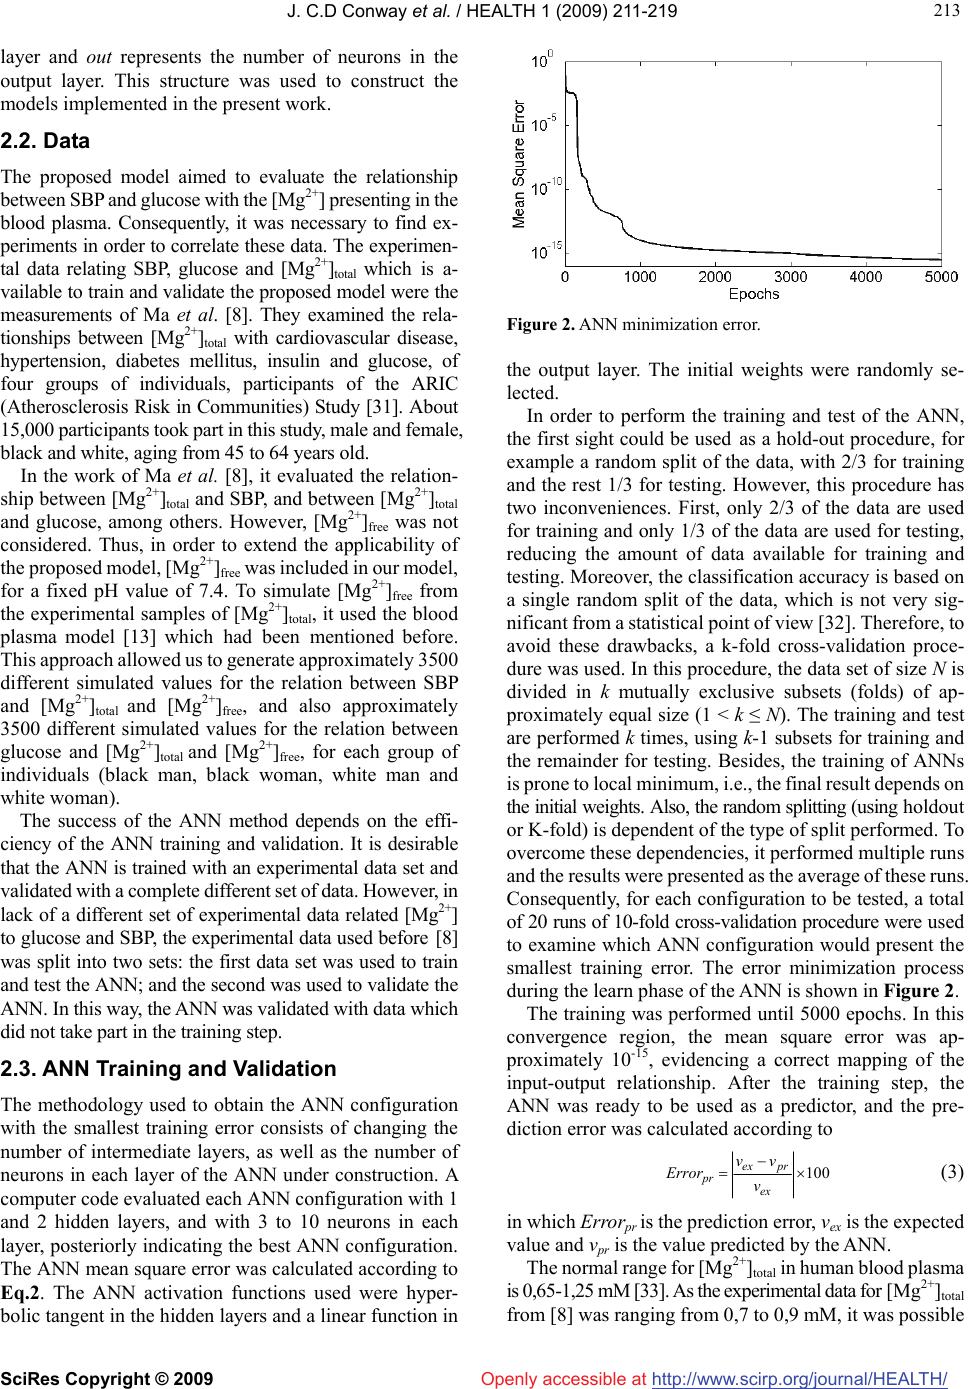 J. C.D Conway et al. / HEALTH 1 (2009) 211-219 SciRes Copyright © 2009 http://www.scirp.org/journal/HEALTH/ 213 213 Openly accessible at layer and out represents the number of neurons in the output layer. This structure was used to construct the models implemented in the present work. 2.2. Data The proposed model aimed to evaluate the relationship between SBP and glucose with the [Mg2+] presenting in the blood plasma. Consequently, it was necessary to find ex- periments in order to correlate these data. The experimen- tal data relating SBP, glucose and [Mg2+]total which is a- vailable to train and validate the proposed model were the measurements of Ma et al. [8]. They examined the rela- tionships between [Mg2+]total with cardiovascular disease, hypertension, diabetes mellitus, insulin and glucose, of four groups of individuals, participants of the ARIC (Atherosclerosis Risk in Communities) Study [31]. About 15,000 participants took part in this study, male and female, black and white, aging from 45 to 64 years old. In the work of Ma et al. [8], it evaluated the relation- ship between [Mg2+]total and SBP, and between [Mg2+]total and glucose, among others. However, [Mg2+]free was not considered. Thus, in order to extend the applicability of the proposed model, [Mg2+]free was included in our model, for a fixed pH value of 7.4. To simulate [Mg2+]free from the experimental samples of [Mg2+]total, it used the blood plasma model [13] which had been mentioned before. This approach allowed us to generate approximately 3500 different simulated values for the relation between SBP and [Mg2+]total and [Mg2+]free, and also approximately 3500 different simulated values for the relation between glucose and [Mg2+]total and [Mg2+]free, for each group of individuals (black man, black woman, white man and white woman). The success of the ANN method depends on the effi- ciency of the ANN training and validation. It is desirable that the ANN is trained with an experimental data set and validated with a complete different set of data. However, in lack of a different set of experimental data related [Mg2+] to glucose and SBP, the experimental data used before [8] was split into two sets: the first data set was used to train and test the ANN; and the second was used to validate the ANN. In this way, the ANN was validated with data which did not take part in the training step. 2.3. ANN Training and Validation The methodology used to obtain the ANN configuration with the smallest training error consists of changing the number of intermediate layers, as well as the number of neurons in each layer of the ANN under construction. A computer code evaluated each ANN configuration with 1 and 2 hidden layers, and with 3 to 10 neurons in each layer, posteriorly indicating the best ANN configuration. The ANN mean square error was calculated according to Eq.2. The ANN activation functions used were hyper- bolic tangent in the hidden layers and a linear function in Figure 2. ANN minimization error. the output layer. The initial weights were randomly se- lected. In order to perform the training and test of the ANN, the first sight could be used as a hold-out procedure, for example a random split of the data, with 2/3 for training and the rest 1/3 for testing. However, this procedure has two inconveniences. First, only 2/3 of the data are used for training and only 1/3 of the data are used for testing, reducing the amount of data available for training and testing. Moreover, the classification accuracy is based on a single random split of the data, which is not very sig- nificant from a statistical point of view [32]. Therefore, to avoid these drawbacks, a k-fold cross-validation proce- dure was used. In this procedure, the data set of size N is divided in k mutually exclusive subsets (folds) of ap- proximately equal size (1 < k ≤ N). The training and test are performed k times, using k-1 subsets for training and the remainder for testing. Besides, the training of ANNs is prone to local minimum, i.e., the final result depends on the initial weights. Also, the random splitting (using holdout or K-fold) is dependent of the type of split performed. To overcome these dependencies, it performed multiple runs and the results were presented as the average of these runs. Consequently, for each configuration to be tested, a total of 20 runs of 10-fold cross-validation procedure were used to examine which ANN configuration would present the smallest training error. The error minimization process during the learn phase of the ANN is shown in Figure 2. The training was performed until 5000 epochs. In this convergence region, the mean square error was ap- proximately 10-15, evidencing a correct mapping of the input-output relationship. After the training step, the ANN was ready to be used as a predictor, and the pre- diction error was calculated according to 100 ex prex pr v vv Error (3) in which Errorpr is the prediction error, vex is the expected value and vpr is the value predicted by the ANN. The normal range for [Mg2+]total in human blood plasma is 0,65-1,25 mM [33]. As the experimental data for [Mg2+ ]total from [8] was ranging from 0,7 to 0,9 mM, it was possible 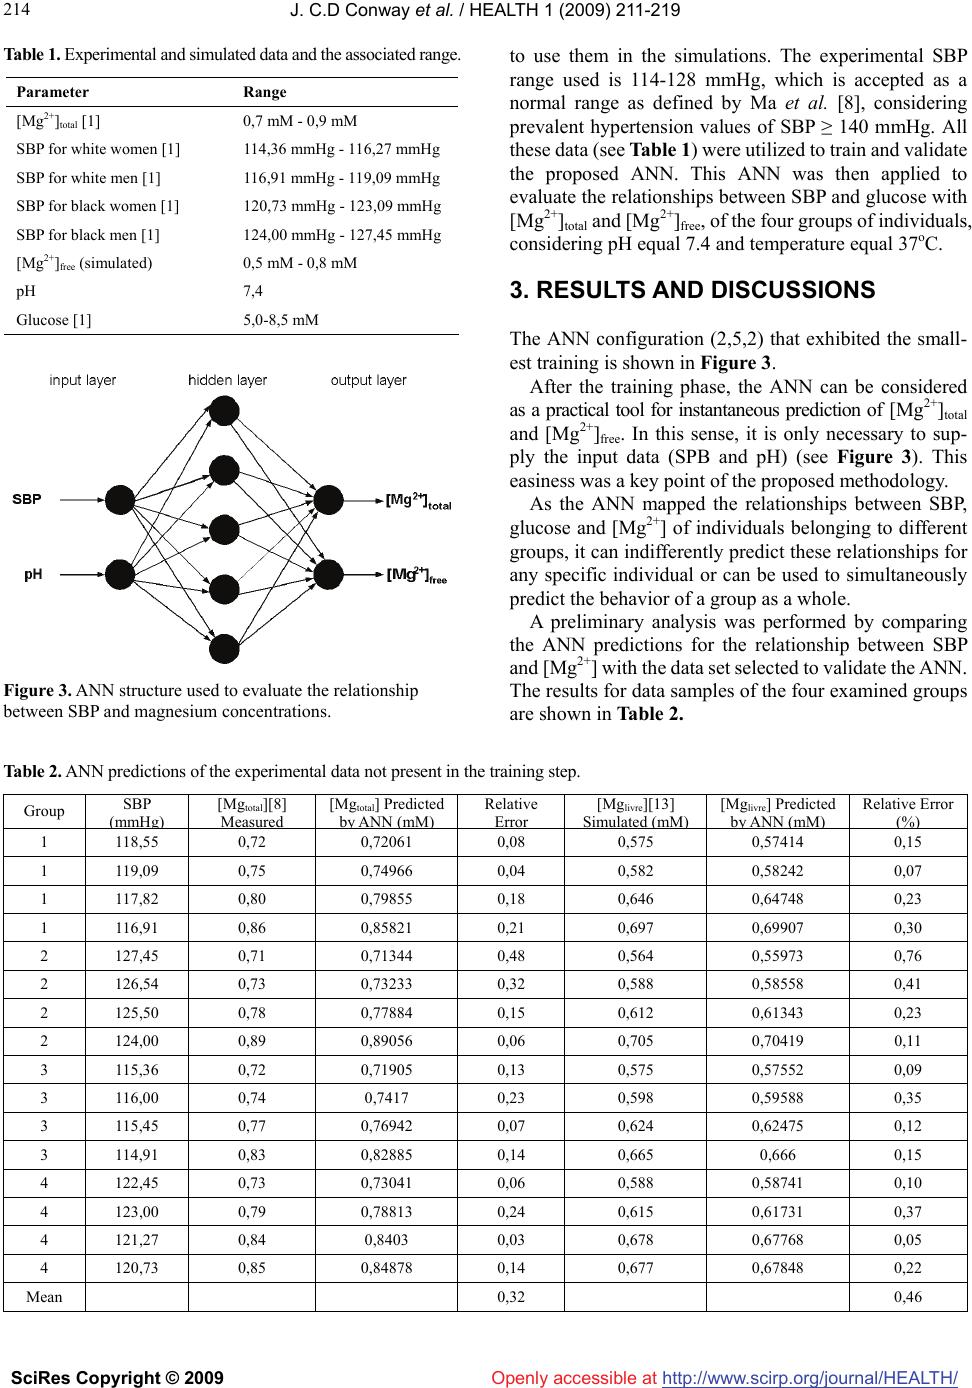 J. C.D Conway et al. / HEALTH 1 (2009) 211-219 SciRes Copyright © 2009 http://www.scirp.org/journal/HEALTH/ 214 Table 1. Experimental and simulated data and the associated range. to use them in the simulations. The experimental SBP range used is 114-128 mmHg, which is accepted as a normal range as defined by Ma et al. [8], considering prevalent hypertension values of SBP ≥ 140 mmHg. All these data (see Table 1) were utilized to train and validate the proposed ANN. This ANN was then applied to evaluate the relationships between SBP and glucose with [Mg2+]total and [Mg2+]free, of the four groups of individuals, considering pH equal 7.4 and temperature equal 37oC. Parameter Range [Mg2+]total [1] 0,7 mM - 0,9 mM SBP for white women [1] 114,36 mmHg - 116,27 mmHg SBP for white men [1] 116,91 mmHg - 119,09 mmHg SBP for black women [1] 120,73 mmHg - 123,09 mmHg SBP for black men [1] 124,00 mmHg - 127,45 mmHg [Mg2+]free (simulated) 0,5 mM - 0,8 mM pH 7,4 Glucose [1] 5,0-8,5 mM 3. RESULTS AND DISCUSSIONS The ANN configuration (2,5,2) that exhibited the small- est training is shown in Figure 3. After the training phase, the ANN can be considered as a practical tool for instantaneous prediction of [Mg2+]total and [Mg2+]free. In this sense, it is only necessary to sup- ply the input data (SPB and pH) (see Figure 3). This easiness was a key point of the proposed methodology. As the ANN mapped the relationships between SBP, glucose and [Mg2+] of individuals belonging to different groups, it can indifferently predict these relationships for any specific individual or can be used to simultaneously predict the behavior of a group as a whole. A preliminary analysis was performed by comparing the ANN predictions for the relationship between SBP and [Mg2+] with the data set selected to validate the ANN. The results for data samples of the four examined groups are shown in Table 2. Figure 3. ANN structure used to evaluate the relationship between SBP and magnesium concentrations. Table 2. ANN predictions of the experimental data not present in the training step. Group SBP ( mmH g) [Mgtotal][8] M easu r ed [Mgtotal] Predicted by A NN ( mM ) Relative Err or [Mglivre][13] S im u l a t ed ( mM ) [Mglivre] Predicted by A NN ( mM ) Relative Error (%) 1 118,55 0,72 0,72061 0,08 0,575 0,57414 0,15 1 119,09 0,75 0,74966 0,04 0,582 0,58242 0,07 1 117,82 0,80 0,79855 0,18 0,646 0,64748 0,23 1 116,91 0,86 0,85821 0,21 0,697 0,69907 0,30 2 127,45 0,71 0,71344 0,48 0,564 0,55973 0,76 2 126,54 0,73 0,73233 0,32 0,588 0,58558 0,41 2 125,50 0,78 0,77884 0,15 0,612 0,61343 0,23 2 124,00 0,89 0,89056 0,06 0,705 0,70419 0,11 3 115,36 0,72 0,71905 0,13 0,575 0,57552 0,09 3 116,00 0,74 0,7417 0,23 0,598 0,59588 0,35 3 115,45 0,77 0,76942 0,07 0,624 0,62475 0,12 3 114,91 0,83 0,82885 0,14 0,665 0,666 0,15 4 122,45 0,73 0,73041 0,06 0,588 0,58741 0,10 4 123,00 0,79 0,78813 0,24 0,615 0,61731 0,37 4 121,27 0,84 0,8403 0,03 0,678 0,67768 0,05 4 120,73 0,85 0,84878 0,14 0,677 0,67848 0,22 Mean 0,32 0,46 Openly accessible at 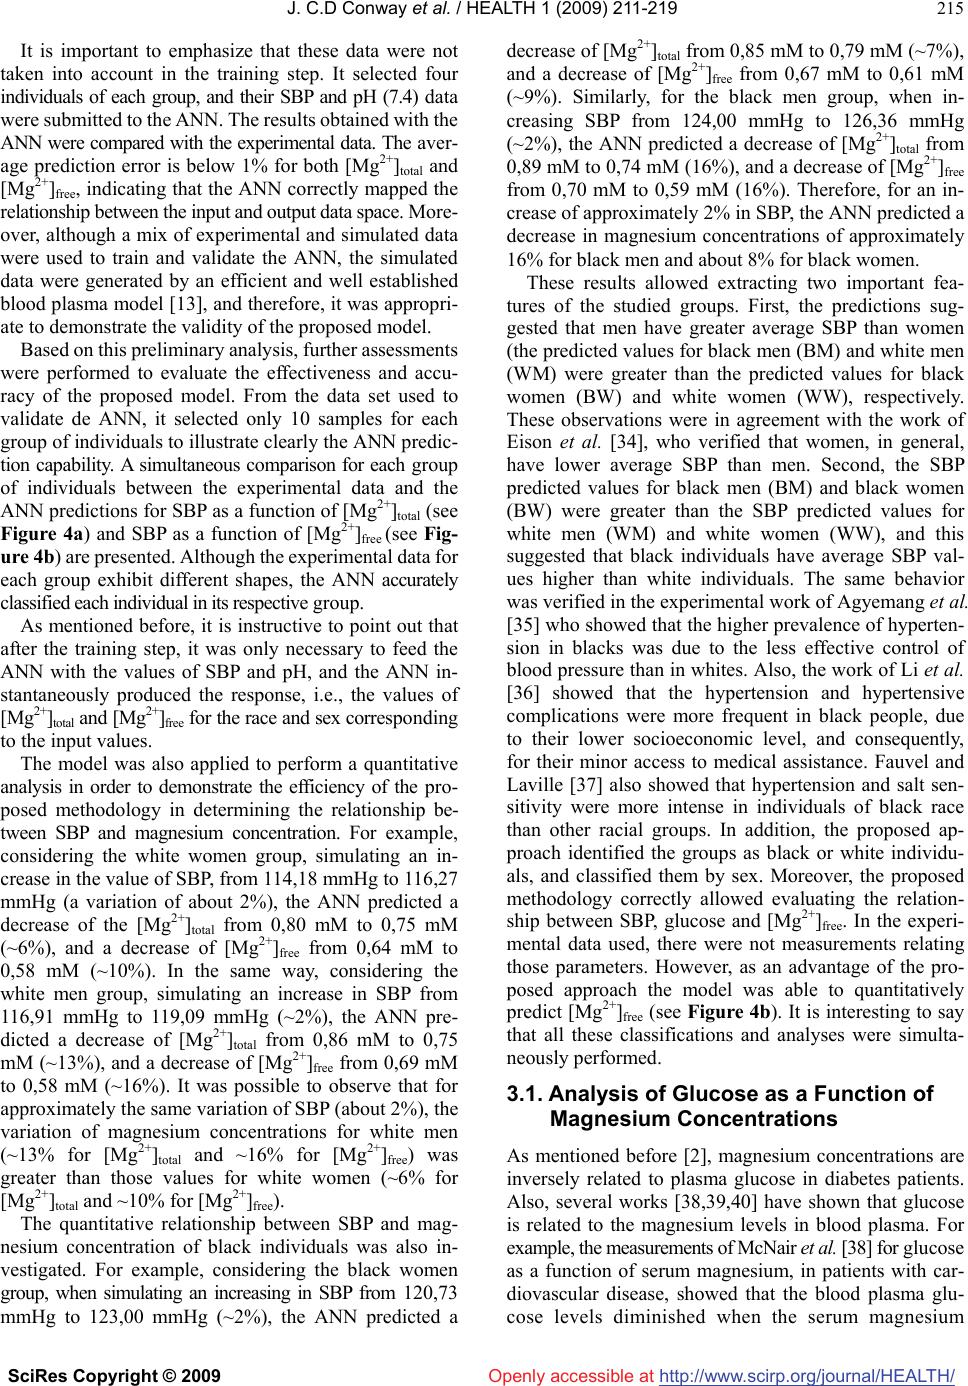 J. C.D Conway et al. / HEALTH 1 (2009) 211-219 SciRes Copyright © 2009 http://www.scirp.org/journal/HEALTH/Openly accessible at 215 It is important to emphasize that these data were not taken into account in the training step. It selected four individuals of each group, and their SBP and pH (7.4) data were submitted to the ANN. The results obtained with the ANN were compared with the experimental data. The aver- age prediction error is below 1% for both [Mg2+]total and [Mg2+]free, indicating that the ANN correctly mapped the relationship between the input and output data space. More- over, although a mix of experimental and simulated data were used to train and validate the ANN, the simulated data were generated by an efficient and well established blood plasma model [13], and therefore, it was appropri- ate to demonstrate the validity of the proposed model. Based on this preliminary analysis, further assessments were performed to evaluate the effectiveness and accu- racy of the proposed model. From the data set used to validate de ANN, it selected only 10 samples for each group of individuals to illustrate clearly the ANN predic- tion capability. A simultaneous comparison for each group of individuals between the experimental data and the ANN predictions for SBP as a function of [Mg2+]total (see Figure 4a) and SBP as a function of [Mg2+]free (see Fig- ure 4b) are presented. Although the experimental data for each group exhibit different shapes, the ANN accurately classified each individual in its respective group. As mentioned before, it is instructive to point out that after the training step, it was only necessary to feed the ANN with the values of SBP and pH, and the ANN in- stantaneously produced the response, i.e., the values of [Mg2+]total and [Mg2+]free for the race and sex corresponding to the input values. The model was also applied to perform a quantitative analysis in order to demonstrate the efficiency of the pro- posed methodology in determining the relationship be- tween SBP and magnesium concentration. For example, considering the white women group, simulating an in- crease in the value of SBP, from 114,18 mmHg to 116,27 mmHg (a variation of about 2%), the ANN predicted a decrease of the [Mg2+]total from 0,80 mM to 0,75 mM (~6%), and a decrease of [Mg2+]free from 0,64 mM to 0,58 mM (~10%). In the same way, considering the white men group, simulating an increase in SBP from 116,91 mmHg to 119,09 mmHg (~2%), the ANN pre- dicted a decrease of [Mg2+]total from 0,86 mM to 0,75 mM (~13%), and a decrease of [Mg2+]free from 0,69 mM to 0,58 mM (~16%). It was possible to observe that for approximately the same variation of SBP (about 2%), the variation of magnesium concentrations for white men (~13% for [Mg2+]total and ~16% for [Mg2+]free) was greater than those values for white women (~6% for [Mg2+]total and ~10% for [Mg2+]free). The quantitative relationship between SBP and mag- nesium concentration of black individuals was also in- vestigated. For example, considering the black women group, when simulating an increasing in SBP from 120,73 mmHg to 123,00 mmHg (~2%), the ANN predicted a decrease of [Mg2+]total from 0,85 mM to 0,79 mM (~7%), and a decrease of [Mg2+]free from 0,67 mM to 0,61 mM (~9%). Similarly, for the black men group, when in- creasing SBP from 124,00 mmHg to 126,36 mmHg (~2%), the ANN predicted a decrease of [Mg2+]total from 0,89 mM to 0,74 mM (16%), and a decrease of [Mg2+]free from 0,70 mM to 0,59 mM (16%). Therefore, for an in- crease of approximately 2% in SBP, the ANN predicted a decrease in magnesium concentrations of approximately 16% for black men and about 8% for black women. These results allowed extracting two important fea- tures of the studied groups. First, the predictions sug- gested that men have greater average SBP than women (the predicted values for black men (BM) and white men (WM) were greater than the predicted values for black women (BW) and white women (WW), respectively. These observations were in agreement with the work of Eison et al. [34], who verified that women, in general, have lower average SBP than men. Second, the SBP predicted values for black men (BM) and black women (BW) were greater than the SBP predicted values for white men (WM) and white women (WW), and this suggested that black individuals have average SBP val- ues higher than white individuals. The same behavior was verified in the experimental work of Agyemang et al. [35] who showed that the higher prevalence of hyperten- sion in blacks was due to the less effective control of blood pressure than in whites. Also, the work of Li et al. [36] showed that the hypertension and hypertensive complications were more frequent in black people, due to their lower socioeconomic level, and consequently, for their minor access to medical assistance. Fauvel and Laville [37] also showed that hypertension and salt sen- sitivity were more intense in individuals of black race than other racial groups. In addition, the proposed ap- proach identified the groups as black or white individu- als, and classified them by sex. Moreover, the proposed methodology correctly allowed evaluating the relation- ship between SBP, glucose and [Mg2+]free. In the experi- mental data used, there were not measurements relating those parameters. However, as an advantage of the pro- posed approach the model was able to quantitatively predict [Mg2+]free (see Figure 4b). It is interesting to say that all these classifications and analyses were simulta- neously performed. 3.1. Analysis of Glucose as a Function of Magnesium Concentrations As mentioned before [2], magnesium concentrations are inversely related to plasma glucose in diabetes patients. Also, several works [38,39,40] have shown that glucose is related to the magnesium levels in blood plasma. For example, the measurements of McNair et al. [38] for glucose as a function of serum magnesium, in patients with car- diovascular disease, showed that the blood plasma glu- cose levels diminished when the serum magnesium 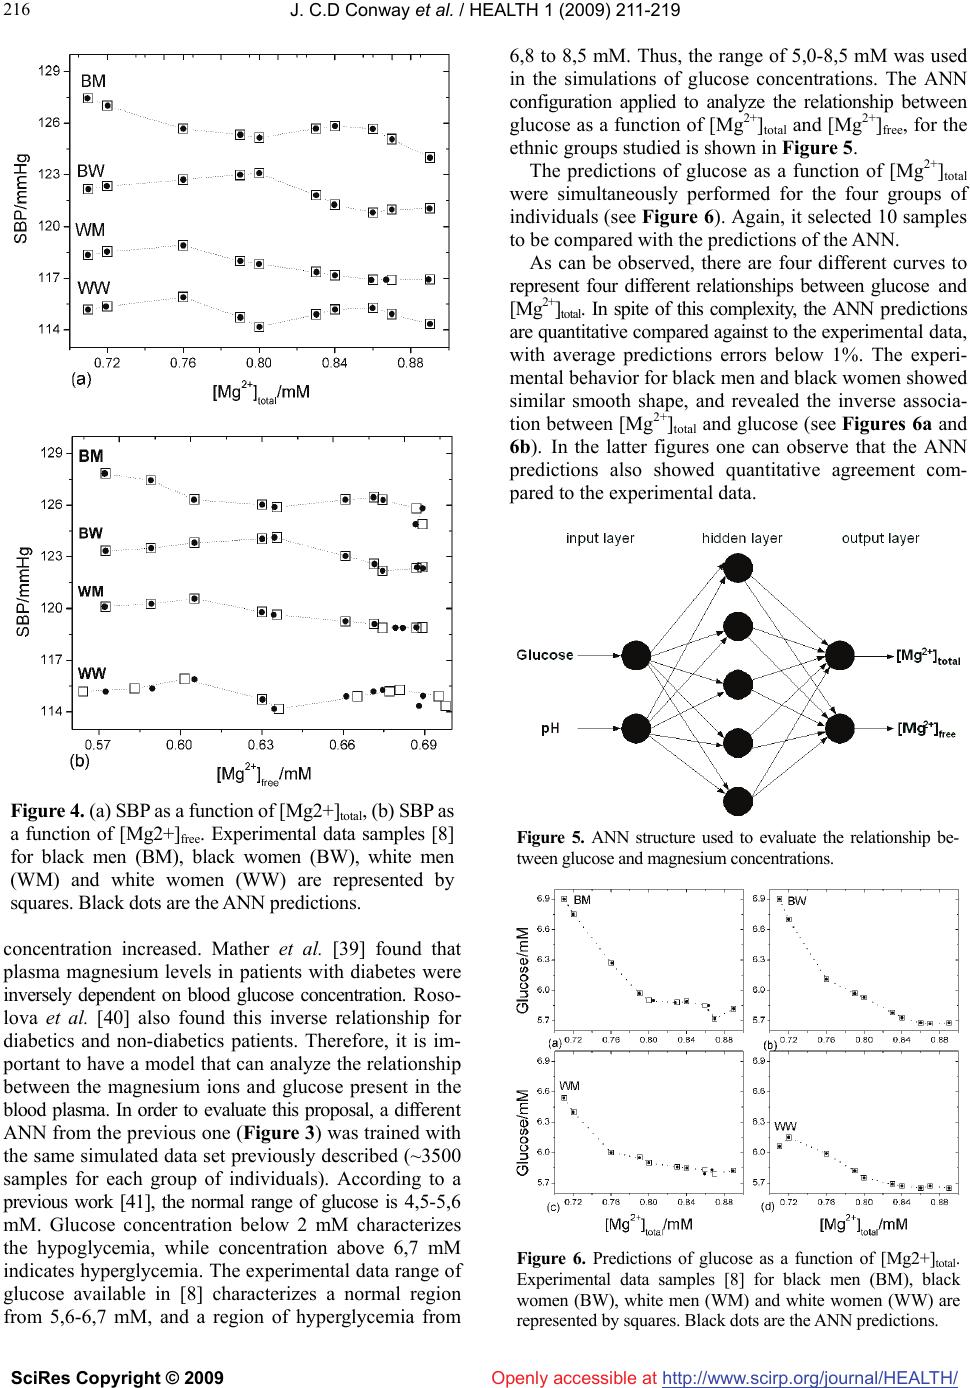 J. C.D Conway et al. / HEALTH 1 (2009) 211-219 SciRes Copyright © 2009 http://www.scirp.org/journal/HEALTH/ 216 Openly accessible at Figure 4. (a) SBP as a function of [Mg2+]total, (b) SBP as a function of [Mg2+]free. Experimental data samples [8] for black men (BM), black women (BW), white men (WM) and white women (WW) are represented by squares. Black dots are the ANN predictions. concentration increased. Mather et al. [39] found that plasma magnesium levels in patients with diabetes were inversely dependent on blood glucose concentration. Roso- lova et al. [40] also found this inverse relationship for diabetics and non-diabetics patients. Therefore, it is im- portant to have a model that can analyze the relationship between the magnesium ions and glucose present in the blood plasma. In order to evaluate this proposal, a different ANN from the previous one (Figure 3) was trained with the same simulated data set previously described (~3500 samples for each group of individuals). According to a previous work [41], the normal range of glucose is 4,5-5,6 mM. Glucose concentration below 2 mM characterizes the hypoglycemia, while concentration above 6,7 mM indicates hyperglycemia. The experimental data range of glucose available in [8] characterizes a normal region from 5,6-6,7 mM, and a region of hyperglycemia from 6,8 to 8,5 mM. Thus, the range of 5,0-8,5 mM was used in the simulations of glucose concentrations. The ANN configuration applied to analyze the relationship between glucose as a function of [Mg2+]total and [Mg2+]free, for the ethnic groups studied is shown in Figure 5. The predictions of glucose as a function of [Mg2+]total were simultaneously performed for the four groups of individuals (see Figure 6). Again, it selected 10 samples to be compared with the predictions of the ANN. As can be observed, there are four different curves to represent four different relationships between glucose and [Mg2+]total. In spite of this complexity, the ANN predictions are quantitative compared against to the experimental data, with average predictions errors below 1%. The experi- mental behavior for black men and black women showed similar smooth shape, and revealed the inverse associa- tion between [Mg2+]total and glucose (see Figures 6a and 6b). In the latter figures one can observe that the ANN predictions also showed quantitative agreement com- pared to the experimental data. Figure 5. ANN structure used to evaluate the relationship be- tween glucose and magnesium concentrations. Figure 6. Predictions of glucose as a function of [Mg2+]total. Experimental data samples [8] for black men (BM), black women (BW), white men (WM) and white women (WW) are represented by squares. Black dots are the ANN predictions. 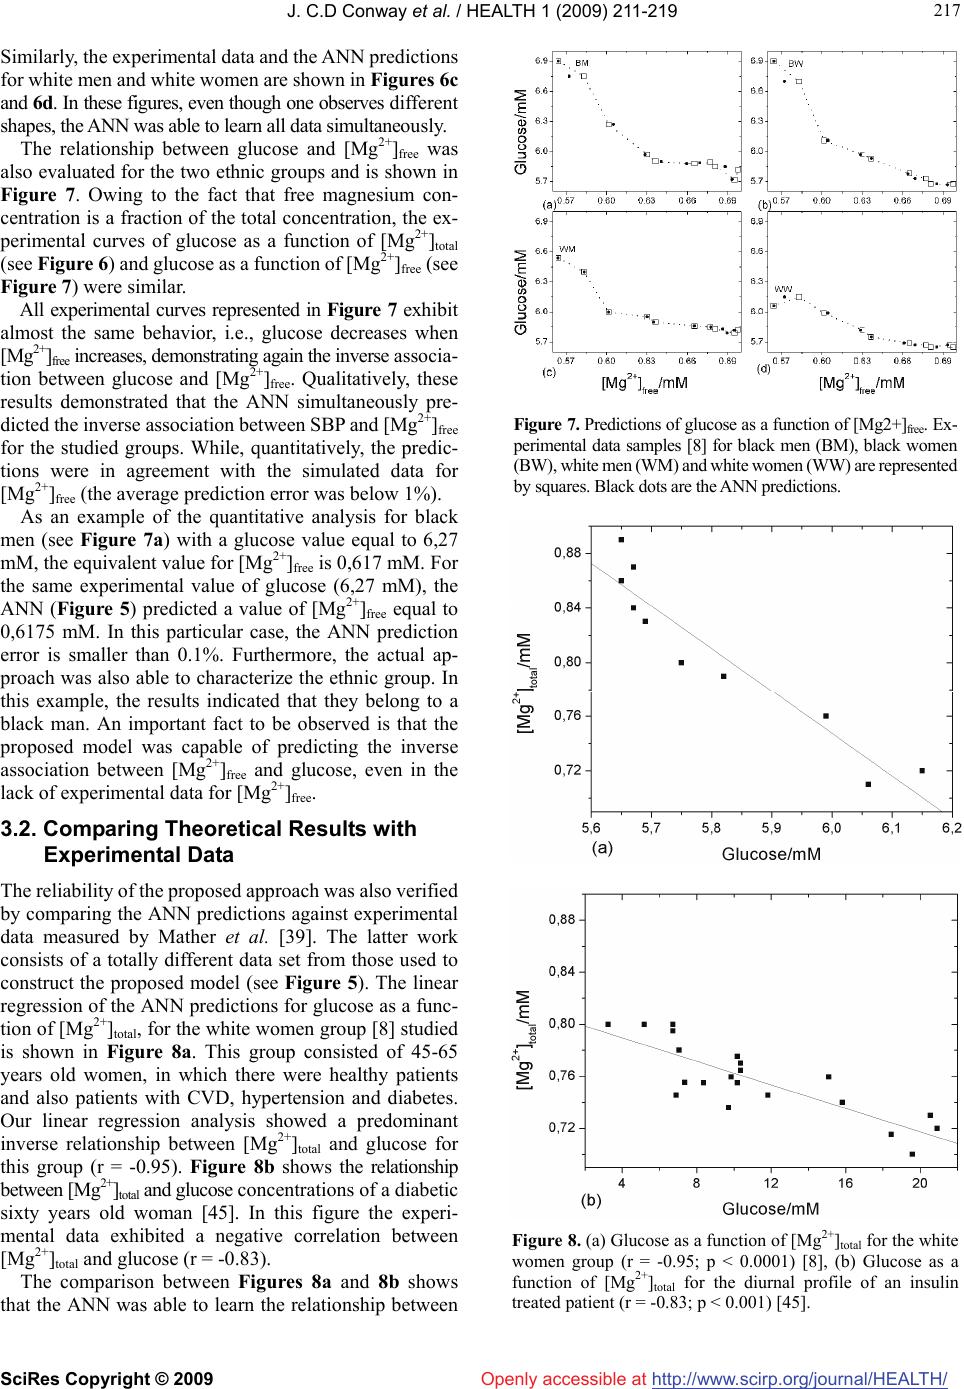 J. C.D Conway et al. / HEALTH 1 (2009) 211-219 SciRes Copyright © 2009 http://www.scirp.org/journal/HEALTH/ 217 217 Openly accessible at Similarly, the experimental data and the ANN predictions for white men and white women are shown in Figures 6c and 6d. In these figures, even though one observes different shapes, the ANN was able to learn all data simultaneously. The relationship between glucose and [Mg2+]free was also evaluated for the two ethnic groups and is shown in Figure 7. Owing to the fact that free magnesium con- centration is a fraction of the total concentration, the ex- perimental curves of glucose as a function of [Mg2+]total (see Figure 6) and glucose as a function of [Mg2+]free (see Figure 7) were similar. All experimental curves represented in Figure 7 exhibit almost the same behavior, i.e., glucose decreases when [Mg2+]free increases, demonstrating again the inverse associa- tion between glucose and [Mg2+]free. Qualitatively, these results demonstrated that the ANN simultaneously pre- dicted the inverse association between SBP and [Mg2+]free for the studied groups. While, quantitatively, the predic- tions were in agreement with the simulated data for [Mg2+]free (the average prediction error was below 1%). As an example of the quantitative analysis for black men (see Figure 7a) with a glucose value equal to 6,27 mM, the equivalent value for [Mg2+]free is 0,617 mM. For the same experimental value of glucose (6,27 mM), the ANN (Figure 5) predicted a value of [Mg2+]free equal to 0,6175 mM. In this particular case, the ANN prediction error is smaller than 0.1%. Furthermore, the actual ap- proach was also able to characterize the ethnic group. In this example, the results indicated that they belong to a black man. An important fact to be observed is that the proposed model was capable of predicting the inverse association between [Mg2+]free and glucose, even in the lack of experimental data for [Mg2+]free. 3.2. Comparing Theoretical Results with Experimental Data The reliability of the proposed approach was also verified by comparing the ANN predictions against experimental data measured by Mather et al. [39]. The latter work consists of a totally different data set from those used to construct the proposed model (see Figure 5). The linear regression of the ANN predictions for glucose as a func- tion of [Mg2+]total, for the white women group [8] studied is shown in Figure 8a. This group consisted of 45-65 years old women, in which there were healthy patients and also patients with CVD, hypertension and diabetes. Our linear regression analysis showed a predominant inverse relationship between [Mg2+]total and glucose for this group (r = -0.95). Figure 8b shows the relationship between [Mg2+]total and glucose concentrations of a diabetic sixty years old woman [45]. In this figure the experi- mental data exhibited a negative correlation between [Mg2+]total and glucose (r = -0.83). The comparison between Figures 8a and 8b shows that the ANN was able to learn the relationship between Figure 7. Predictions of glucose as a function of [Mg2+]free. Ex- perimental data samples [8] for black men (BM), black women (BW), white men (WM) and white women (WW) are represented by squares. Black dots are the ANN predictions. Figure 8. (a) Glucose as a function of [Mg2+]total for the white women group (r = -0.95; p < 0.0001) [8], (b) Glucose as a function of [Mg2+]total for the diurnal profile of an insulin treated patient (r = -0.83; p < 0.001) [45]. 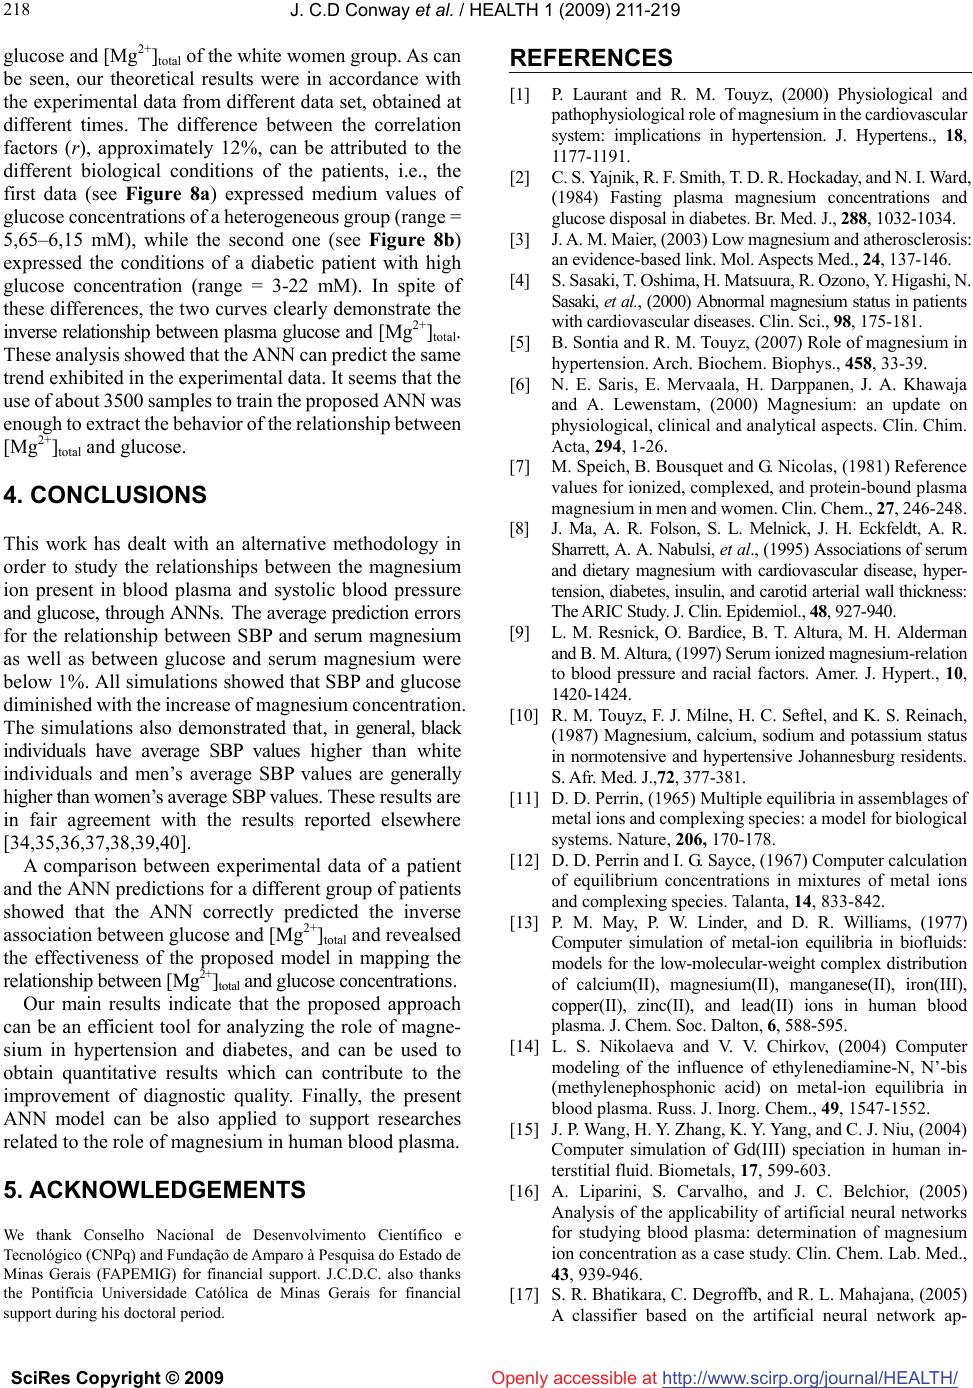 J. C.D Conway et al. / HEALTH 1 (2009) 211-219 SciRes Copyright © 2009 http://www.scirp.org/journal/HEALTH/ 218 Openly accessible at glucose and [Mg2+]total of the white women group. As can be seen, our theoretical results were in accordance with the experimental data from different data set, obtained at different times. The difference between the correlation factors (r), approximately 12%, can be attributed to the different biological conditions of the patients, i.e., the first data (see Figure 8a) expressed medium values of glucose concentrations of a heterogeneous group (range = 5,65–6,15 mM), while the second one (see Figure 8b) expressed the conditions of a diabetic patient with high glucose concentration (range = 3-22 mM). In spite of these differences, the two curves clearly demonstrate the inverse relationship between plasma glucose and [Mg2+]total. These analysis showed that the ANN can predict the same trend exhibited in the experimental data. It seems that the use of about 3500 samples to train the proposed ANN was enough to extract the behavior of the relationship between [Mg2+]total and glucose. 4. CONCLUSIONS This work has dealt with an alternative methodology in order to study the relationships between the magnesium ion present in blood plasma and systolic blood pressure and glucose, through ANNs. The average prediction errors for the relationship between SBP and serum magnesium as well as between glucose and serum magnesium were below 1%. All simulations showed that SBP and glucose diminished with the increase of magnesium concentration. The simulations also demonstrated that, in general, black individuals have average SBP values higher than white individuals and men’s average SBP values are generally higher than women’s average SBP values. These results are in fair agreement with the results reported elsewhere [34,35,36,37,38,39,40]. A comparison between experimental data of a patient and the ANN predictions for a different group of patients showed that the ANN correctly predicted the inverse association between glucose and [Mg2+]total and revealsed the effectiveness of the proposed model in mapping the relationship between [Mg2+]total and glucose concentrations. Our main results indicate that the proposed approach can be an efficient tool for analyzing the role of magne- sium in hypertension and diabetes, and can be used to obtain quantitative results which can contribute to the improvement of diagnostic quality. Finally, the present ANN model can be also applied to support researches related to the role of magnesium in human blood plasma. 5. ACKNOWLEDGEMENTS We thank Conselho Nacional de Desenvolvimento Científico e Tecnológico (CNPq) and Fundação de Amparo à Pesquisa do Estado de Minas Gerais (FAPEMIG) for financial support. J.C.D.C. also thanks the Pontifícia Universidade Católica de Minas Gerais for financial support during his doctoral period. REFERENCES [1] P. Laurant and R. M. Touyz, (2000) Physiological and pathophysiological role of magnesium in the cardiovascular system: implications in hypertension. J. Hypertens., 18, 1177-1191. [2] C. S. Yajnik, R. F. Smith, T. D. R. Hockaday, and N. I. Ward, (1984) Fasting plasma magnesium concentrations and glucose disposal in diabetes. Br. Med. J., 288, 1032-1034. [3] J. A. M. Maier, (2003) Low magnesium and atherosclerosis: an evidence-based link. Mol. Aspects Med., 24, 137-146. [4] S. Sasaki, T. Oshima, H. Matsuura, R. Ozono, Y. Higashi, N. Sasaki, et al., (2000) Abnormal magnesium status in patients with cardiovascular diseases. Clin. Sci., 98, 175-181. [5] B. Sontia and R. M. Touyz, (2007) Role of magnesium in hypertension. Arch. Biochem. Biophys., 458, 33-39. [6] N. E. Saris, E. Mervaala, H. Darppanen, J. A. Khawaja and A. Lewenstam, (2000) Magnesium: an update on physiological, clinical and analytical aspects. Clin. Chim. Acta, 294, 1-26. [7] M. Speich, B. Bousquet and G. Nicolas, (1981) Reference values for ionized, complexed, and protein-bound plasma magnesium in men and women. Clin. Chem., 27, 246-248. [8] J. Ma, A. R. Folson, S. L. Melnick, J. H. Eckfeldt, A. R. Sharrett, A. A. Nabulsi, et al., (1995) Associations of serum and dietary magnesium with cardiovascular disease, hyper- tension, diabetes, insulin, and carotid arterial wall thickness: The ARIC Study. J. Clin. Epidemiol., 48, 927-940. [9] L. M. Resnick, O. Bardice, B. T. Altura, M. H. Alderman and B. M. Altura, (1997) Serum ionized magnesium-relation to blood pressure and racial factors. Amer. J. Hypert., 10, 1420-1424. [10] R. M. Touyz, F. J. Milne, H. C. Seftel, and K. S. Reinach, (1987) Magnesium, calcium, sodium and potassium status in normotensive and hypertensive Johannesburg residents. S. Afr. Med. J.,72, 377-381. [11] D. D. Perrin, (1965) Multiple equilibria in assemblages of metal ions and complexing species: a model for biological systems. Nature, 206, 170-178. [12] D. D. Perrin and I. G. Sayce, (1967) Computer calculation of equilibrium concentrations in mixtures of metal ions and complexing species. Talanta, 14, 833-842. [13] P. M. May, P. W. Linder, and D. R. Williams, (1977) Computer simulation of metal-ion equilibria in biofluids: models for the low-molecular-weight complex distribution of calcium(II), magnesium(II), manganese(II), iron(III), copper(II), zinc(II), and lead(II) ions in human blood plasma. J. Chem. Soc. Dalton, 6, 588-595. [14] L. S. Nikolaeva and V. V. Chirkov, (2004) Computer modeling of the influence of ethylenediamine-N, N’-bis (methylenephosphonic acid) on metal-ion equilibria in blood plasma. Russ. J. Inorg. Chem., 49, 1547-1552. [15] J. P. Wang, H. Y. Zhang, K. Y. Yang, and C. J. Niu, (2004) Computer simulation of Gd(III) speciation in human in- terstitial fluid. Biometals, 17, 599-603. [16] A. Liparini, S. Carvalho, and J. C. Belchior, (2005) Analysis of the applicability of artificial neural networks for studying blood plasma: determination of magnesium ion concentration as a case study. Clin. Chem. Lab. Med., 43, 939-946. [17] S. R. Bhatikara, C. Degroffb, and R. L. Mahajana, (2005) A classifier based on the artificial neural network ap-  J. C.D Conway et al. / HEALTH 1 (2009) 211-219 SciRes Copyright © 2009 http://www.scirp.org/journal/HEALTH/Openly accessible at 219 219 proach for cardiologic auscultation in pediatrics. Artif. Intell. Med., 33, 251-260. [18] I. Inza, M. Merin, N. P. Larra, J. Quiroga, B. Sierra, and M. Girala, (2001) Feature subset selection by genetic algo- rithms–a case study in the survival of cirrhotic patients treated with tips. Artif. Intell. Med., 23, 187-205. [19] D. Itchhaporia, P. B. Snow, R. J. Almassy, and W. J. Oet- gen, (1996) Artificial neural networks: Current status in cardiovascular medicine. J. Am. Coll. Cardiol., 28, 515-521. [20] J. D. Martin, E. Soria, G. Campos, A. J. Serrano, J. R. Sepulveda, and V. Gimenez, (2004) Neural networks as effective techniques in clinical management of patients: some case studies. Trans. Inst. Measur. Control, 26, 169-183. [21] C. Thang, E. W. Cooper, Y. Hoshino, and K. Kamei, (2005) A decision support system for rheumatic evaluation and treatment in oriental medicine using fuzzy logic and neural network. Lect. Note Artif. Intell., 3558, 399-409. [22] J. Trujillano, J. March, and A. Sorribas, (2004) Methodo- logical approach to the use of artificial neural networks for predicting results in medicine. Med. Clin., 122, 59-67. [23] R. Poli, S. Cagnoni, R. Livi, G. Coppini, and G. Valli, (1991) A neural network expert system for diagnosing and treating hypertension. Computer, 24, 64-71. [24] A. M. Zhai, B. Q. Sun, Y. J. Feng, and H. Q. Wang, (2003) A study on diagnosis of hypertension by intelligent medical diagnostic system. Dyn. Cont. Discr. Imp. Syst. Ser. B, Suppl.S, 478-480. [25] M. Beksac, M. S. Beksac, V. B. Tipi, H. A. Duru, M. U. Karakas, and A. N. Cakar, (1997), An artificial intelligent diagnostic system on differential recognition of hemato- poietic cells from microscopic images. Cytometric, 30, 145-150. [26] F. Viazzi, G. Leoncini, G. Sacchi, D. Parodi, E. Ratto, V. Falqui, et al., (2006) Predicting cardiovascular risk using creatinine clearance and an artificial neural network in primary hypertension. J. Hypertens., 24, 1281-1286. [27] J. C. D. Conway, A. Liparini, J. R. Oliveira Júnior, and J. C. Belchior, (2007) Analyses of the temperature and pH effects on the complexation of the magnesium and cal- cium in human blood plasma: an approach using artificial neural networks. Anal. Bioanal. Chem., 30, 1585-1594. [28] W. S. McCulloc and W. Pitts, (1943) A logical calculus of the ideas immanent in nervous activity. Bull. Math. Bio- phys., 5, 115-133. [29] S. Haykin, (1999) Neural networks: A comprehensive foundation. Prentice Hall. [30] D. W. Marquardt, (1963) An algorithm for least-squares estimation of nonlinear parameters. J. Soc. Indust. Appl. Math., 11, 431-441. [31] O. D. Williams, (1989) The atherosclerosis risk in commu- nities (ARIC) study: design and objectives. Amer. J. Epidemiol., 129, 687-702. [32] A. A. Freitas, (2002) Data mining and knowledge dis- covery with evolutionary algorithms. Springer. [33] H. J. Milionis, G. E. Alexandrides, E. N. Liberopoulos, E. T. Bairaktari, J. Goudevenos, and M. S. Elisaf, (2002) Hypomagnesemia and concurrent acid-base and electro- lyte abnormalities in patients with congestive heart failure. Eur. J. Heart Fail., 4, 167-173. [34] H. Eison, R. A. Phillips, M. Ardeljan and L. R. Krakoff, (1990) Differences in ambulatory blood pressure between men and women with mild hypertension, J. Hum. Hy- pertens., 4, 400-404. [35] C. Agyemang, N. Bindraban, G. Mairuhu, G. Van Montfrans, R. Koopmans, and K. Stronks, (2005) Prevalence, awareness, treatment, and control of hypertension among black suri- namese, south Asian surinamese and white dutch in am- sterdam, the netherlands: the sunset study. J. Hypertens., 23, 1971 1977. [36] J. L. Li, R. M. Canham, W. Vongpatanasin, D. Leonard, R. J. Auchus, and R. G. Victor, (2006) Do allelic variantes in alpha(2A) and alpha(2C) adrenergic receptors predispose to hypertension in blacks?. Hypertension, 47, 1140-1146. [37] J. P. Fauvel and M. Laville, (2006) Hypertension in blacks. Press. Med., 35, 1067-1071. [38] P. McNair, M. S. Christensen, and C. Christiansen, (1982) Renal hypomagnesemia in human diabetes mellitus: its re- lation to glucose homeostasis. Eur. J. Clin. Invest., 12, 81-85. [39] H. M. Mather, G. E. Levin, J. A. Nisbet, L. A. A. Hadley LAA, N. W. Oakley, and T. R. E. Pilkington, (1982) Di- urnal profiles of plasma magnesium and blood glucose in diabetes. Diabetologia, 22, 180-183. [40] H. Rosolova, O. Mayer, and G. Reaven, (1997) Effect of variations in plasma magnesium concentration on resis- tance to insulin-mediated glucose disposal in nondiabetic subjects. J. Clin. Endocrinol. Metab., 82, 3783-3785. [41] P. E. Paulev, (1999) Textbook in medical physiology and pathophysiology, essentials and clinical problems. Co- penhagen Medical Plubishers. |