 Journal of Envi ro nmental Prote c tion, 2011, 2, 1310-1316 doi:10.4236/jep.2011.210151 Published Online December 2011 (http://www.SciRP.org/journal/jep) Copyright © 2011 SciRes. JEP Effect of Solid Wastes Composition and Confinement Time on Methane Production in a Dump Carlos González1, Otoniel Buenrostro1*, Liliana Marquez1, Consuelo Hernández2, Edgar Moreno3, Fabián Robles4 1Agronomics and Forestry Research Institute, Universidad Michoacana de San Nicolás de Hidalgo, Morelia, Mexico; 2Technological Institute of Toluca, Toluca, Mexico; 3Technological Institute of Morelia, Morelia, Mexico; 4Interdisciplinary Professional Unit of Biotechnology, Instituto Politécnico Nacional, Mexico City, Mexico. E-mail: *otonielb@umich.mx Received September 21st, 2011; revised October 23rd, 2011; accepted November 25th, 2011. ABSTRACT In developing countries, illegal dump structures or even some landfills do not include methane collecting systems, even if local environmental laws exist. In this condition, the greenhouse gas escapes to the atmosphere uncontrolled and practical solutions to tackle this problem are not obvious. To make a solution approachable, first-hand reliable data from dump emissions are required as starting point. The methane production is not homogeneous throughout the dump, therefore to estimate its global methane emissions, various representative gas monitoring sites distributed along the dump becomes necessary. This research work presents the measures of biogas emissions collected in the final disposal site located at Morelia (Mexico), along with an evaluation of the organic fraction and confinement time participation on biogas production. Biogas emission data were taken with a portable analyzer from 49 ventila tion pip e s for 52 weeks. For the composition and degradability analysis of solid wastes, the required samples have been collected from 16 sites. The results sho w a heterogeneou s composition of solid wa stes: 38 separate components are present, from those, 19 be- long to organic categories and 28 of total comp onents accounts fo r almost 99% of the waste. The mean biogas concen- tration detected was: 45.5% CH4, 32.4% CO2, 3.1% O2, and 18.9% balance gas (i.e., N2, CO or H2S). The ANOVA procedure clearly corroborated the influence of composition, biodegradability and time of co nfinement of solid wastes on the production of methane, despite the deficiencies in the final soil layer cover in these sites. Keywords: Mexico, Biodegradability, Emissio ns, Biogas, Methane 1. Introduction Intergovernmental agencies worldwide are making at- tempts to create awareness about the contribution to glo- bal warming of landfill gas emissions from decomposing municipal solid wastes (MSW), recommending the use of biogas emissions as a source of alternative energy instead of their release to the atmosphere [1]. The amount of land- fill gas generated largely depends on climatic conditions, geography, waste characteristics and other local factors [2]. Several researchers have identified the factors influ- encing the degradation of MSW and have assessed their individual effects on the methane production. These fac- tors include presence or absence of oxygen and hydrogen [3-5]; temperature [6,7]; MSW confinement time [8]; MSW field capacity and hydraulic retention time [9-11]; compaction and compressibility of MSW [12]; pH [13,14]; type of material used as final cover layer and the codispo- sition of wastes from the construction and demolition in- dustry [15,16]; humidity content and water flow [17,18] and; the use of inoculants such as biosolids and compost, and leachate recycling [19-26]. Although the aforemen- tioned factors are interdependent, [27] identified pH and humidity content as being most critical, whereas [28] em- phasized humidity and nutrient contents as the main fac- tors affecting the stabilization of MSW. However, only the solid wastes containing cellulose are degraded in a landfill, such as food and yard wastes and two thirds of the paper and cardboard; the degradation of other materi- als is often incomplete [29]. There is clearly a need to extend the knowledge on biogas emissions in MSW disposal sites in order to opti-  Effect of Solid Wastes Composition and Confinement Time on Methane Production in a Dump1311 mize measures for landfill gas capture and to minimize emissions to the environment [30], but such information is still very limited in developing countries, and when available, comparisons and the determination of precise data is difficult. The available information derives from short-term studies made in final disposal sites that have heterogeneous composition, different climatic conditions, while management and measuring techniques vary widely [2,31-33]. Table 1 shows the results of some studies of biogas composition. In the present research the composition of landfill gas emission was analyzed at the final disposition site in the city of Morelia (Mexico), the scope was to determine the effect of MSW composition in the production of biogas. The specific objectives were: 1) To determine the physi- cochemical characteristics of confined MSW, and 2) to study the amount and composition of the biogas generated in the studied site. 2. Materials and Methods 2.1. Description of the Studied Site and Sampling of Solid Waste The present study was conducted in final disposal site that was closed for operation four years ago, after 20 years of activity. The dump is located 15 km west of Morelia, the capital city of the state of Michoacán, in Mexico (19˚41′40″N, 101˚20′54″W), at an elevation of 2075 m.a.s.l. (Figure 1). The predominant climate in the area is of the temperate subtype Cwa, with a mean annual temperature of 18.7˚C, intermediate humidity, a summer rainfall re- gime of 700 - 1000 mm and an average of 5 mm of win- ter precipitation. The site has an extension of 17 ha, an irregular topography, an approximate slope of 15˚; dis- posal cells have a maximum depth of 10.1 m and the estimated amount of deposited MSW is of 3,859,642 t [34]. At the time of its closure, 49 venting pipes were installed at a 3 m depth. 2.2. Sampling and Characterization of Solid Waste Composition The study area was divided into four quadrants according to the confinement period of MSW, the oldest being quadrant I and the more recent, quadrant IV. Using a simple random design, 16 boreholes were perforated at a depth of 3 m and from each one approximately 4 kg of refuse were collected in transparent plastic bags. The Table 1. C ompo sition of landfill gas (L FG) in differe nt worl d regions (% volume). LFG composition S D W Landfill location Year CH4 CO2 O2 Balance P. de Montaña, Mexico 2000-2001 46 34.6 2.6 16.86 16 S/D Horizontal Nakhonpatho, Thailand 2003 64.1 31.1 1 3.82 8 3 Vertical Samutprakan, Thailand 2004 50.6 38.9 1.1 8.5 3 50 Horizontal Site of Study 2010-2011 45.5 32.4 3.1 18.9 7 3 Vertical Sources: [2,31,32]. S (Sampling period (months)); D (Depth (meters)); W (Wells). N Figure 1. Location of the Morelia, M ichoacán dump. Copyright © 2011 SciRes. JEP  Effect of Solid Wastes Composition and Confinement Time on Methane Production in a Dump 1312 numbers of boreholes and venting pipes in each quadrant are shown in Table 2. 2.3. Physical and Chemical Analyses of Solid Waste Samples Physical and chemical analyses of samples were con- ducted in triplicate. Samples were grinded to homogenize the components to one inch fractions. These analyses in- cluded: characterization of waste components (NOM-AA- 22-1985) [35], temperature (NMX-AA-25-1984) [36], pH (NMX-AA-25-1984) [36], moisture content (NMX-AA- 016-1984) [37], total solids (TS) (APHA, 1998), volatile solids (VS) [38], ashes (NMX-AA-018-1984) [39] and me- thane emission (using a GEM-2000 plus (Landtec) portable analyzer). 2.4. Measurement of Biogas Emissions Measurement of biogas emissions were made in the 49 venting pipes using a GEM-2000 plus (Landtec) portable analyzer. Measurements for methane (CH4), carbon dio- xide (CO2), oxygen (O2) and hydrogen sulfide (H2S) were periodically made during 52 weeks. Measurements were made during morning time (be- tween 9:00 AM and 13:00 PM) to assure less interference from external factors such as changes in humidity and temperature, placing both plastic connectors of the analyzer inside venting pipes. 2.5. Data Statistical Analysis Field and laboratory data from the physical and chemical analyses of composition of residues and of emission of methane in the dump were captured in the program Excel (Microsoft Office XP). The JMP program (Version: 6.0. SAS Inc. Institute, 2005) was used for the statistical ana- lysis. Descriptive statistics and three series of one-way analysis of variance (ANOVA) were performed to estab- lish the influence between the production of gas and the surveyed variables. Those variables showing a statistically significant difference were analyzed by means of the Tukey test. 3. Results and Discussion 3.1. Composition of Solid Wastes Samples The composition of solid waste included 38 components, Table 2. Number of wells and venting pipes in each quad- rant of the study site. Quadrant Boreholes Ventilation pipes I 5 15 II 4 11 III 3 11 IV 4 12 as described in the Mexican norm. Table 3 shows a high heterogeneity of results among quadrants. It is likely that these differences result from the different factors such as: a seasonal variation in the consumption and the modifica- tion in consumption patterns due to economic and demo- graphic challenges experienced in the country [40,41]. Table 3 also shows a variety of the more abundant com- ponents of the 38 categories, of which, food waste/Un- identifiable fraction was dominant; it is noteworthy that the organic fraction content is inversely proportional to the confinement period of the solid residues, showing the influence in the organic fraction content of time of dis- position of solid wastes in the site. Oldest quadrants have a lower content of organic waste, as can be seen in the quadrant I to the more recent (quadrant IV). Of the total solid waste composition in the site of study, the organic fraction (fine residue, food and yard wastes, hard plant fiber, bone, wood, feces, cardboard, leather, pa- per, cloth, shoes, hair, coating and wax) averaged 63%, a proportion that is relatively high, which reflects that al- though the city of Morelia has experienced economic cha- llenges these have not been widespread for all the po- pulation, and also that a rural life style consumer pattern prevails. Also, despite the implementation in Morelia of MSW separation programs, some recyclable components such as cardboard, rigid and film plastics, and glass, continue to be elevated in the solid waste stream. It was also observed that only those materials having high economic value and demand, such as aluminum, polyethylene terephthalate Table 3. Composition of solid waste in the study site (%, w/w, fresh basis). Quadrant Category I IIIIIIV Food Waste/Unidentifiable fraction* 31.6 36.366.460.3 Paper and Cardboard 7.1 10.24.43.9 Yard Waste 3.3 2.34.71.5 Wood 2.2 1.40.02.4 Cloth 1.3 1.54.12.7 Other Organics** 1.2 1.50.40.6 Diapers 4.6 5.31.42.6 Metals 3.2 3.70.10.1 Glass and Ceramics 4.9 2.52.23.6 Plastics 16.8 21.29.512.2 Stones 19.7 13.26.88.0 Other Inorganic 4.3 0.30.02.1 *Organic components difficult to identify due to the stage of degradation; **Organic components such as cotton, leather, bone, wood, etc; ***Inorganic components, such as synthetic fibers, cellophane, aluminum foil, electrical material, cigarette butts, modeling clay, and shoes, etc. Copyright © 2011 SciRes. JEP  Effect of Solid Wastes Composition and Confinement Time on Methane Production in a Dump1313 and ferrous materials have been diminishing their amounts with respect to previously measurements in the solid waste stream [40]. 3.2. Results of Physical and Chemical Analyses of Solid Waste Samples An increment in temperature was observed related to the depth of the layer and to the season (results no shown). Nonetheless all the studies boreholes presented mesophilic temperatures (35˚C to 40˚C) (Table 4) during the sam- pling period and methane production was detected in all ventilation pipes in the site, which is in agreement with the report of [42] that a mesophilic range of temperature is a critical factor for the optimal degradation of the organic fraction of the wastes. Moisture values ranged between 29% - 38% for all boreholes, commonly this value is 25% - 60% [42], and is linked to its composition. However, obtained data did not show a clear difference in the moisture content be- tween the quadrants within the 3 m depth at which solid wastes samples were taken. Solid waste pH values were detected in the range of 8 - 8.4 (Table 4), which is indeed a suitable range for the optimal degradation of solid wastes; pH is an important parameter in the optimum decomposition of solid wastes because the acidic/basic conditions influence the metha- nogenic phase [19]. The results of TS showed values of between 62% - 68%, the highest being concentrated in stratum III, which is related to the lower content of humidity in that level. Volatile solid values ranged from 33% - 56% (Table 4), an ample range that reflects the level of degradation of MSW among quadrants. Higher values of volatile solids and of the organic fraction in quadrant IV are showing a relation with the stage of degradation of the organic con- tents and the confinement time of the solid wastes. The volatile solid content has been used to express the total organic matter present in solid wastes. According to [43], volatile solids are a reliable parameter to indicate the degradation of the organic materials throughout time, and Table 4. Phys i cal and chemical characteristics of waste sam- ples. Quadrant Parameters I II IIIIV Physical Characteristics Temperature (˚C) 35.7 28.5 28.336.9 pH 8.4 8.4 8.38.0 Moisture Content (%) 34.2 35.0 37.131.7 Chemical Characteristics Total Solids (% w/w) 65.8 65.0 62.968.2 Volatile Solids (% TS) 33.5 47.3 53.555.7 Ash (% TS) 66.5 52.7 46.544.3 consequently, an indicator of the potential for methane production. 3.3. Measurement of Biogas Emissions The biogas generated in the studied site contained an ave- rage of 45.5% CH4, 32.4% CO2, 3.1% O2, 18.9% balance gas (i.e., N2, H2S, CO) and emissions differed between quadrants (Ta ble 5). Figure 2 shows the average methane emissions in the four quadrants during the sampling pe- riod. The observed seasonal variation in methane generation is shown in Figure 2, a fluctuation that reinforces the effe- cts of corresponding changes in temperature and preci- pitation. An increase in methane emission was observed during the rainy season (July-October, weeks 5 to 21) and a decrease in such activity was registered during the dry season (November-June, weeks 23 to 52), the latter due to low water availability. The lower level of methane generation observed in quadrants I and IV suggests the effect of the time of solid wastes confinement and, hence, their degradation stage. In the case of quadrant I, which is the oldest deposit, it was expected that after 20 years a large proportion of the organic fraction had already been degraded. In contrast, in quadrant IV which is the most recent deposit, the methanogenic phase has not yet rea- ched its maximum level. The average generation of methane observed in the stu- dy site (45.5%) was below according with the values re- ported by [33], but some boreholes had values that fall within the range reported in other studies (58% - 64%) [2,31,32]. The aforementioned studies also report the in- fluence on methane generation of climate, solid waste composition and type of cover. Most landfills commonly used in developing countries lack infrastructure for cap- turing methane; nevertheless, being able to identify the level of biogas production is relevant in order to assess both its environmental impact and the economic feasi- bility of building sanitary landfills having methanecap- ture systems. 3.4. Statistical Data Analysis The ANOVA test revealed a statistically significant dif- ference (P < 0.05) among quadrants in temperature, pH, Table 5. Composition of the biogas in the site of study (av- erage per quadrant % volume). Composition of Biogas (% volume) QCH 4SD CO2SD O2 SD B SD I41,315,127,710,3 4,4 4,9 26,521,0 II49,4 8,4 35,4 5,3 2,2 2,9 12,710,6 III48,5 5,9 35,4 4,5 2,7 2,0 13,4 8,4 IV44,5 16,6 32,89,2 2,5 3,3 20,2 22,9 Q (Quadrant); SD (Standard Deviation); B (Balance). Copyright © 2011 SciRes. JEP 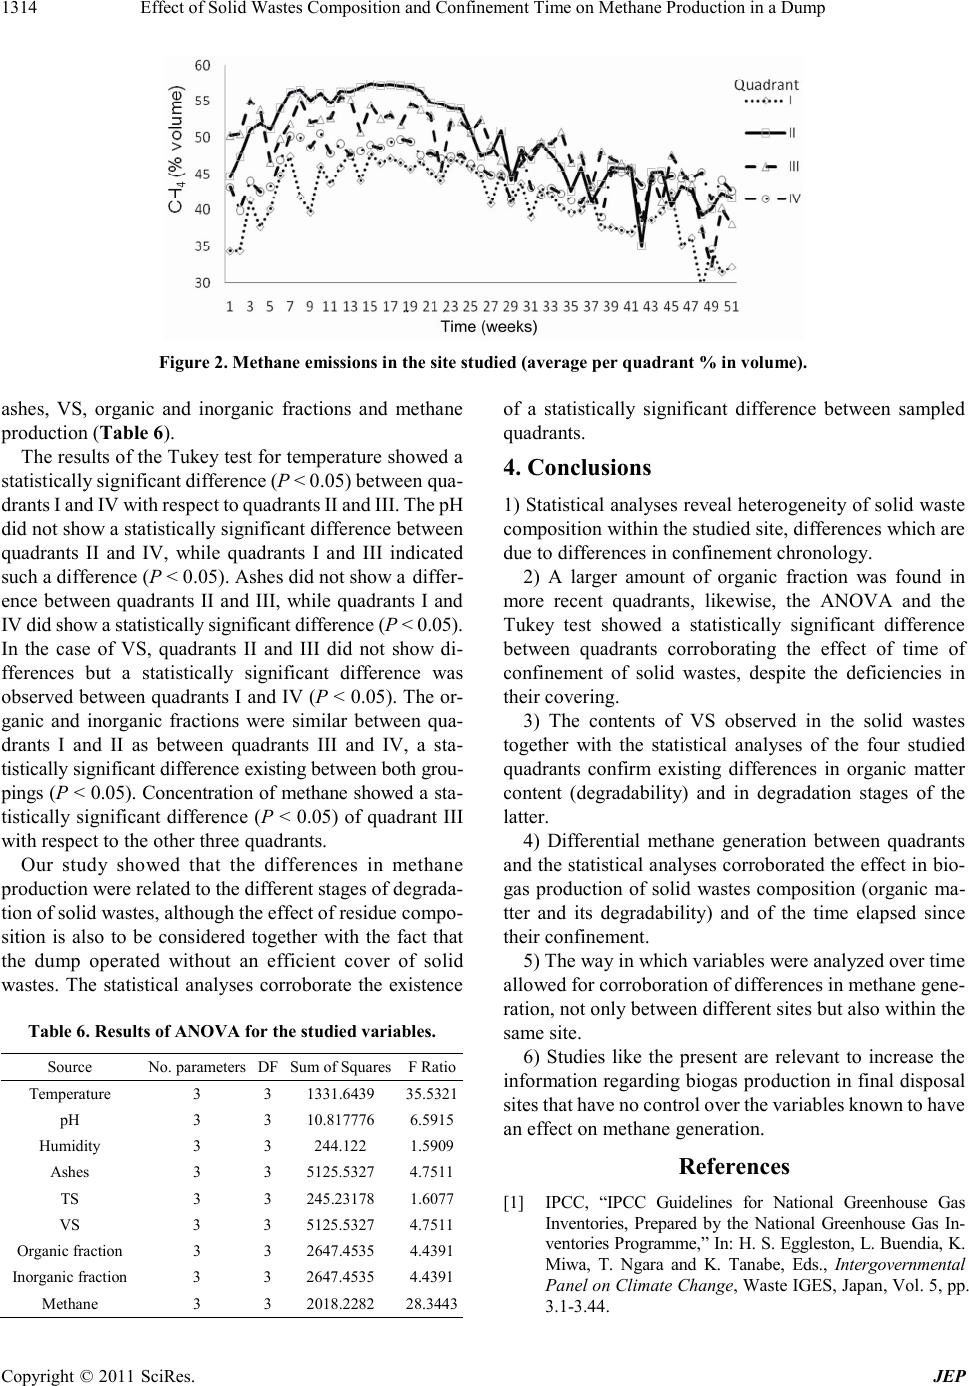 Effect of Solid Wastes Composition and Confinement Time on Methane Production in a Dump Copyright © 2011 SciRes. JEP 1314 Figure 2. Methane emissions i n the site studied (average per quadrant % in volume). ashes, VS, organic and inorganic fractions and methane production (Table 6). of a statistically significant difference between sampled quadrants. The results of the Tukey test for temperature showed a statistically significant difference (P < 0.05) between qua- drants I and IV with respect to quadrants II and III. The pH did not show a statistically significant difference between quadrants II and IV, while quadrants I and III indicated such a difference (P < 0.05). Ashes did not show a differ- ence between quadrants II and III, while quadrants I and IV did show a statistically significant difference (P < 0.05). In the case of VS, quadrants II and III did not show di- fferences but a statistically significant difference was observed between quadrants I and IV (P < 0.05). The or- ganic and inorganic fractions were similar between qua- drants I and II as between quadrants III and IV, a sta- tistically significant difference existing between both grou- pings (P < 0.05). Concentration of methane showed a sta- tistically significant difference (P < 0.05) of quadrant III with respect to the other three quadrants. 4. Conclusions 1) Statistical analyses reveal heterogeneity of solid waste composition within the studied site, differences which are due to differences in confinement chronology. 2) A larger amount of organic fraction was found in more recent quadrants, likewise, the ANOVA and the Tukey test showed a statistically significant difference between quadrants corroborating the effect of time of confinement of solid wastes, despite the deficiencies in their covering. 3) The contents of VS observed in the solid wastes together with the statistical analyses of the four studied quadrants confirm existing differences in organic matter content (degradability) and in degradation stages of the latter. 4) Differential methane generation between quadrants and the statistical analyses corroborated the effect in bio- gas production of solid wastes composition (organic ma- tter and its degradability) and of the time elapsed since their confinement. Our study showed that the differences in methane production were related to the different stages of degrada- tion of solid wastes, although the effect of residue compo- sition is also to be considered together with the fact that the dump operated without an efficient cover of solid wastes. The statistical analyses corroborate the existence 5) The way in which variables were analyzed over time allowed for corroboration of differences in methane gene- ration, not only between different sites but also within the same site. Table 6. Result s of ANOVA for the studied variables. 6) Studies like the present are relevant to increase the information regarding biogas production in final disposal sites that have no control over the variables known to have an effect on methane generation. Source No. parametersDF Sum of SquaresF Ratio Temperature 3 3 1331.6439 35.5321 pH 3 3 10.817776 6.5915 Humidity 3 3 244.122 1.5909 Ashes 3 3 5125.5327 4.7511 TS 3 3 245.23178 1.6077 VS 3 3 5125.5327 4.7511 Organic fraction 3 3 2647.4535 4.4391 Inorganic fraction 3 3 2647.4535 4.4391 Methane 3 3 2018.2282 28.3443 References [1] IPCC, “IPCC Guidelines for National Greenhouse Gas Inventories, Prepared by the National Greenhouse Gas In- ventories Programme,” In: H. S. Eggleston, L. Buendia, K. Miwa, T. Ngara and K. Tanabe, Eds., Intergovernmental Panel on Climate Change, Waste IGES, Japan, Vol. 5, pp. 3.1-3.44.  Effect of Solid Wastes Composition and Confinement Time on Methane Production in a Dump1315 [2] C. Chiemchaisri, W. Chiemchaisri, S. Kumar and J. Het- tiaratchi, “Solid Waste Characteristics and Their Rela- tionship to Gas Production in Tropical Landfill,” Envi- ronmenta l Mon itorin g Assessmen t, Vol. 135, No. 1-3, 2007, pp. 41-48. doi:10.1007/s10661-007-9706-2 [3] S. E. Borglin, T. C Hazen, C. M. Oldenburg and P. T. Zawislanski, “Comparison of Aerobic and Anaerobic Biot- reatment of Municipal Solid Waste,” Journal of the Air and Waste Management, Vol. 54, 2004, pp. 815-822. [4] E. R. Fielding, D. B. Archer, E. C. Demacario and A. J. L. Macario, “Isolation and Characterization of Methano- genic Bacteria from Landfills,” Environmental Microbi- ology, Vol. 54, No. 3, 1988, pp. 835-836. [5] J. H. Wilshusen, J. P. A. Hettiaratchi and V. B. Stein, “Long-Term Behavior of Passively Aerated Compost Me- thanotrophic Biofilter Columns,” Waste Management, Vol. 24, No. 7, 2004, pp. 643-653. doi:10.1016/j.wasman.2003.12.006 [6] S. Kalyuzhny, M. Gladchenko and E. Epov, “Combined Anaerobic-Aerobic Treatment of Landfill Leachates Un- der Mesophilic, Submesophilic and Psychrophilic Condi- tions,” Water Science and Technology, Vol. 48, No. 6, 2003, pp. 311-318. [7] R. Rajasekaran, R. Muragesan and A. Palanisamy, “In- fluence of Temperature on Microbiological Numbers and Biogas Production of Some Anaerobically Digested Wa- ste,” Agricultural Wastes, Vol. 17, No. 2, 1986, pp. 83-89. doi:10.1016/0141-4607(86)90047-8 [8] F. L. Wang and J. R. Bettany, “Methane Emissions from Canadian Prairie and Forest Soils under Short Term Flood- ing Conditions,” Nutrient Cycling in Agroecosyste ms, Vol. 49, 1997, pp. 197-202. doi:10.1023/A:1009758308457 [9] R. Munasinghe, “Effect Hydraulic Retention Time on Land- fill Leachate and Gas Characteristics,” Ph.D. Thesis, Uni- versity of British Columbia, Vancouver, 2003. [10] M. T. Orta, R. R. Cruz, V. N. Rojas, R. I. Monje and G. J. Sánchez, “Determination of Field Capacity of Municipal Solid Waste with Surcharge Simulation,” Waste Manage- ment & Research, Vol. 21, No. 2, 2003, pp. 137-144. doi:10.1177/0734242X0302100207 [11] C. Zeiss and W. Major, “Moisture Flow through Munici- pal Solid Waste: Patterns and Characteristics,” Journal En- vironmental Systems, Vol. 22, No. 3, 1993, pp. 211- 231. [12] M. S. Hossain, M. A. Gabr, F. Asce and M. A Barlaz, “Relationship of Compressibility Parameters to Municipal Solid Waste Decomposition,” Journal of Geotechnical and Geoenvironmental Engineering, Vol. 129, No. 12, 2003, pp. 151-1158. doi:10.1061/(ASCE)1090-0241(2003)129:12(1151) [13] I. Bergman, M. Klarqvist, and M. Nilsson, “Seasonal Variation in Rates of Methane Production from Peat of Various Botanical Origins: Effects of Temperature and Substrate Quality,” Microbiology Ecology, Vol. 33, No. 3, 2000, pp. 181-189. doi:10.1111/j.1574-6941.2000.tb00740.x [14] C. Bernard and G. Merlin, “The Contribution of Ammo- nia and Alkalinity to Landfill Leachate Toxicity to Duck- weed,” The Science of the Total Environment, Vol. 170, No. 1-2, 1995, pp.71-79. doi:10.1016/0048-9697(95)04563-G [15] L. Márquez and C. I. Watson, “Effect of Intermediate Soil Cover on Municipal Solid Waste Decomposition,” Water Science Technology, Vol. 48, No. 4, 2003, pp. 245-248. [16] N. R. E. Méndez, S. R. Cachón, R. M. Sauri and B. Casti- llo, “Influencia del Material de Cobertura en la Composi- ción de Lixiviados de un Relleno Sanitario,” Revista de Ingeniería, Vol. 6, No. 2, 2002, pp. 7-12. [17] R. E. Klink and R. K. Ham, “Effects of Moisture Move- ment on Methane Production in Solid Waste Landfill Sam- ples,” Resource Recovery and Conservation, Vol. 8, No. 1, 1982, pp. 29-41. [18] G. P. Korfiatis, A. C. Demetracopoulus, E. Bourodimos and E. G. Nawy, “Moisture Transport in a Solid Waste Co- lumn,” Journal of Environmental Engineering, Vol. 110, No. 4, 1984, pp. 780-796. doi:10.1061/(ASCE)0733-9372(1984)110:4(780) [19] V. Francois, G. Feuillade, G. Matejka, T. Lagier and N. Skhiri, “Leachate Recirculation Effects on Waste Degra- dation: Study on Columns,” Waste Management and Re- search, Vol. 27, No. 9, 2007, pp. 1259-1272. doi:10.1016/j.wasman.2006.07.028 [20] M. Swati, J. Kurgan and R. Nagendran, “Bioreactor Land- fill Lisymeter Studies on Indian Urban Refuse,” Proceed- ings of the Tenth International Waste Management and Landfill Symposium, Sardinia, 3-7 October 2005, pp. 229- 237. [21] G. T. Ellis, J. Park, E. Debik and S. Smith, “Evaluation of Leachate Treatment and Recycle Options at the Boone County Landfill,” Proceedings of the Twenty International Conference on Solid Waste Technology and Management, Philadelphia, 3-6 April 2005, pp.102-156. [22] N. Sanphoti, S. Towprayoon, P. Chaiprasert and A. No- pharatana, “The Effects of Leachate Recirculation with Sup- plemental Water Addition on Methane Production and Wa- ste Decomposition in a Simulated Tropical Landfill,” Jour- nal of Environmental Management, Vol. 81, No. 1, 2006, pp. 27-35. doi:10.1016/j.jenvman.2005.10.015 [23] S. S. Chung and C. S. Poon, “Characterization of Mu- nicipal Solid Waste and Its Recyclable Contents of Guang- zhou,” Waste Management & Research, Vol. 19, No. 6, 2001, pp. 473-485. doi:10.1177/0734242X0101900603 [24] D. R. Reinhart and A. B. Al-Yousfi, “The Impact of Leachate Recirculation on Municipal Solid Waste Land- fill Operating Characteristics,” Waste Management & Re- search, Vol. 14, No. 4, 1996, pp. 337-346. [25] B. M. Sinan, A. Demir and B. Ozkaya, “Influence of Lea- chate Recirculation on Aerobic and Anaerobic Decompo- sition of Solid Wastes,” Journal of Hazardous Materials, Vol. 143, No. 2, 2007, pp. 177-183. doi:10.1016/j.jhazmat.2006.09.012 [26] D. T. Sponza and O. N. Agdag, “Impact of Leachate Re- circulation and Recirculation Volume on Stabilization of Municipal Solid Wastes in Simulated Anaerobic Biore- actors,” Process Bioch emistry, Vol. 39, No. 12, 2004, pp. Copyright © 2011 SciRes. JEP  Effect of Solid Wastes Composition and Confinement Time on Methane Production in a Dump Copyright © 2011 SciRes. JEP 1316 2157-2165. doi:10.1016/j.procbio.2003.11.012 [27] M. A. Barlaz, “Microbiology of Solid Waste Landfills,” In: A. C. Palmisano and M. A. Barlaz, Eds., Microbiology of Solid Waste, CRC Press, Boca Raton, 1996, pp. 541- 557. [28] D. R. Reinhart, P. T. McCreanor and T. G. Townsend, “The Bioreactor Landfill: Its Status and Future,” Waste Management and Research, Vol. 20, No. 2, 2002, pp. 172- 186. doi:10.1177/0734242X0202000209 [29] A. Gendebien, M. Constant, E. Ledrut-Damanet, H. Nyns, J. Willumsen, R. Butson, G. Fabry and Ferrero, “Lanfill Gas from Environment to Energy,” Commission of the European Communities, Luxembourg, 1992. [30] H. Scharff and J. Jacobs, “Applying Guidance for Meth- ane Emission Estimation for Landfills,” Waste Manage- ment, Vol. 26, No. 4, 2006, pp. 417-429. [31] G. Hernández and C. Duran, “Biogas Production in a Closed- Down Sanitary Landfill,” In gen i erí a y Ci encias A m b i e n t al e s: Investigación, Desarrollo y Práctica, Vol. 1, No. 1, 2006, pp. 1-15. [32] K. Wang-Yao, S. Towprayoon and S. Jaroenpoj, “Estima- tion of Landfill Gas Production Using Pumping Test,” Pro- ceedings of the Joint International Conference on Sustain- able Energy and Environment (SEE), Hua Hin, 1-3 De- cember 2004, pp. 340-343. [33] T. Tolaymat, R. Green, G. Hater, M. Barlaz, P. Black, D. Bronson and J. Powell, “Evaluation of Landfill Gas De- cay Constant for Municipal Solid Waste Landfills Oper- ated as Bioreactors,” Journal of the Air and Waste Man- agement Association, Vol. 60, No. 1, 2010, pp. 91-97. doi:10.3155/1047-3289.60.1.91 [34] I. Israde, O. Buenrostro and A. Carrillo, “Geological Cha- racterization and Environmental Implications of the Place- ment of the Morelia Landfill, Michoacán, Central México,” Journal of the Air and Waste Management Association, Vol. 55, No. 6, 2005, pp. 755-764. [35] Secretaría de Comercio y Fomento Industrial, “Mexican Norm NMX-AA-022-1985. Environmental Protection-Soil Pollution-Municipal Solid Residues by-Products Selection and Quantification,” San Ysidro, 1985, pp. 1-5. [36] Secretaría de Comercio y Fomento Industrial, “Mexican Norm NMX-AA-025-1984. Environmental Protection-Soil Contamination-Solid Residues-pH Determination-Potentio- metric Method,” San Ysidro, 1984a, pp. 1-5. [37] Secretaría de Comercio y Fomento Industrial, “Mexican Norm NMX-AA-016-1984. Environmental Protection-Soil Pollution-Municipal Solid Residues-Humidity Determina- tion,” San Ysidro, 1984b, pp. 1-5. [38] APHA, American Public Health Association, “Standard Methods for the Examination of Water and Wastewater,” 12th Edition, Washington DC, 1998. [39] Secretaría de Comercio y Fomento Industrial, “Mexican Norm NMX-AA-018-1984. Environmental Protection-Soil Pollution-Municipal Solid Residues-Ashes Determination,” San Ysidro, 1984c, pp. 1-5. [40] O. Buenrostro, G. Bocco and G. Bernache, “Urban Solid Waste Generation and Disposal in Mexico. A Case Stu- dy,” Waste Management & Research, Vol. 19, No. 2, 2001, pp. 169-176. doi:10.1177/0734242X0101900208 [41] O. Buenrostro and G. Bocco, “Solid Waste Management in Municipalities in México: Goals and Perspectives,” Re- sources Conservation and Recycling, Vol. 39, No. 3, 2003, pp. 251-263. doi:10.1016/S0921-3449(03)00031-4 [42] A. Yilmaz and F. Atalay, “Modeling of the Anaerobic Decomposition of Solid Waste,” Energy Sources, Vol. 25, No. 11, 2003, pp. 1063-1072. doi:10.1080/00908310390233586 [43] R. Mehta, M. A. Barlaz, M. Asce, R. Yazdani, D. Augen- stein, M. Bryars and L. Sinderson, “Refuse Decomposi- tion in the Presence and Absence of Leachate Recircula- tion,” Journal of Environmental Engineering, Vol. 128, No. 3, 2002, pp. 228-236. doi:10.1061/(ASCE)0733-9372(2002)128:3(228)
|