 Journal of Environmental Protection, 2011, 2, 1331-1340 doi:10.4236/jep.2011.210153 Published Online December 2011 (http://www.SciRP.org/journal/jep) Copyright © 2011 SciRes. JEP 1331 Sources of Polycyclic Aromatic Hydrocarbons in Street Dust from the Chang-Zhu-Tan Region, Hunan, China Yongzhen Long1*, Guoxiang Chi2, Hairuo Qing2, Tagen Dai1, Qianhong Wu1 1Educational Key Laboratory of Non-Ferrous Metal Materials Science and Engineering, Central South University, Changsha, China; 2Department of Geology, University of Regina, Regina, Canada. E-mail: *Jilllongyz@163.com Received September 15th, 2011; revised October 16th, 2011; accepted November 18th, 2011. ABSTRACT Street dusts collected from 20 sites as well as three special dust samples collected from chimney of coal-fired plant, smelter and refinery of nonferrous metals and automobile exhaust, respectively, in the Chang-Zhu-Tan (Changsha, Zhuzhou and Xiangtan) urban region, Hunan, China, in May to August 2009, were investigated for sources of polycylic aromatic hydrocarbons (PAHs). The ΣPAHs16 levels were in the range of 3515 - 24488 ng/g, with a mean of 8760 ng/g. The sources of PAH inputs to street dusts were determined by isomer ratios, principal components analysis and REE geochemical analysis. The isomer ratios suggested a rather uniform mixture of coal combustion and petroleum PAH sources. Factor analysis indicated that the main sources of 16 PAHs were coal combustion/vehicle exhaust and coking/ petroleum. Rare earth elements (REE) and Factor score analysis further indicated the possible dust sources were from background soil, coal or coking combustion, nonferrous metal factories, traffic exhaust. Keywords: Street Dust, Polycclic Aromatic Hydrocarbons, Rare E arth Eleme nt, Sources of Pollution 1. Introduction The number and diversity of contaminants in our urban environment have significantly increased in recent years [1]. Current evaluations show that increases of urban dust load, alone or in combination with other pollutants, lead to different health effects [2]. Near-surface atmospheric dust was a mixture of particles of the atmosphere and surface dust of the ground which provided important information for pollution management. These substances can be absorbed or taken in by the body through the res- piratory tract and skin, and digested, absorbed, and ac- cumulated in the human body. These harmful substances can also be washed out by precipitated water into the soil and rivers leading to direct pollution of the urban envi- ronment [3]. The distribution and concentration of poly- cyclic aromatic hydrocarbons (PAHs) coated to the dust were paid special attention because of their carcinogenic- ity, mutagenicity and toxicity, and consequently had been put into the list of priority monitoring pollutants by the United States Environment Protection Agency (USEPA) [4,5]. Monitoring and protecting the atmosphere against the adverse effects of persistent organic pollutants (POPs) were also the main aims of the European Monitoring and Evaluation Programme (EMEP) on long-range transmis- sion of air pollutants [6]. The widespread distributions of PAHs in dust had been intensively investigated [7-9], especially in industrialized countries. PAHs in the envi- ronment largely are a product of the incomplete combus- tion of petroleum, oil, coal, and wood [10]. Sources in the urban environment include industrial emissions and wastes, power plants, wood and coal, home heating with fuel oil, vehicles, mineral/crude oil extraction and petro- leum refining processes [11] as well as pavement seal- ants, also known as sealcoat [12].The recognition of these anthropogenic sources was very important for improving city management. In this respect, PAH isomer pair ratios had been widely used to elucidate the possible sources. The ratios between low and high molecular weight PAHs [9] and those of specific compounds, such as Flu/(Flu + Pyr), BaA/(BaA + Chry), Flu/Pyr and BaA/Chry have been proposed as valuable source indicators [13]. Factor analysis has also been used to identify the sources of par- ticulate matter in the atmosphere [14]. The rare earth ele- ments (REEs) are well known for their unique, chemically  Sources of Polycyclic Aromatic Hydrocarbons in Street Dust from the Chang-Zhu-Tan Region, Hunan, China 1332 coherent behavior which makes them ideal geochemical tracers for many geologic processes [15]. Recently, Gab- rielli used rare earth elements to tracer the continental dust origin in EPICA Dome C ice during glacial and in- terglacial periods [16]. Here, we present REE to trace the sources of street dust as well as PAH isomer pair ratios and Factor Analysis to trace the sources of PAHs in dust. The different methods can be integrated in order to better understand the PAH pollu- tion sources in urban areas [9]. The Chang-Zhu-Tan region, one of the pioneers of urban agglomeration in China as well as the hub of communi- cation in the middle and south China, includes the cities of Changsha, Zhuzhou and Xiangtan, where lots of inter- state highways cross these metropolitan areas. The Chang- Zhu-Tan region covers an area of approximate 28,088 km2, with its inhabitants population swelling from 12.76 millions in 2005 to 13.10 millions in 2008 [17]. Chang- sha is the capital and the largest city of Hunan Province, as well as the centre of politics, economy, technology, culture and transportation in Hunan province. Zhuzhou is the second largest city and the largest industry city in Hunan province. Xiangtan is the third largest city and an important industry and transportation center in Hunan pro- vince. In the mean time, Hunan is well known for its richness of mineral resources and has the name of “the country of nonferrous metals”. Hunan is the number one producer of lead and zinc and among the top three pro- ducers of ten nonferrous metals in China [18]. Major nonferrous metals industries are distributed in this region. The major sources of combustion-related organic com- pounds in this region were coal, crude oil and coking, with annual consumption of 11.79 million tons of coal in 2000 [19], 3.83 million tons of crude oil and 1.93 million tons coking in 2007 [17], followed by natural gas, kero- sene, gasoline, liquefied petroleum gas and other fuels, with annual consumption of 41.76, 28.66, 19.83 and 15 million tons, respectively [17]. Coal is largely used for thermal power plants in Zhuzhou and Xiangtan, while coking is largely used for Xiangtan iron and steel works, Zhuzhou Smelter and Refinery of nonferrous metals, Zhicheng Chemical plant and other plants. All sorts of plants with their numerous coal or coking ovens were dis- tributed in this region, especially in Zhuzhou and Xiang- tan industrial areas. However, in most case, no distinct borderline existed between industrial areas and other func- tion areas, such as residential and office areas. In the re- cent years, with the accelerating integration process of Chang-Zhu-Tan region, the concomitant increase in traf- fic circulation (the annual rate of vehicle numbers in- crease has maintained 15.5% in the recent 10 years [20], industry productions and population density have ad- versely impacted the air quality in many quarters of this region. Large amount of data on concentration levels for suspended particulate Matter (SPM), NOx, SO2 and CO are available for these urban areas, which have been found to be consistently much higher than the permissi- ble limit. As things stand, air pollution in this region is largely due to industries and vehicles have also been tar- geted for tacking air pollution. However, not much atten- tion has been paid to measurements of toxic and muta- genic compounds such as PAHs which affect human health. Relatively little information about these com- pounds in the dust is available. Therefore, measurements of their levels in the urban dust are of great interest. This paper reports the sources of PAHs in street dust of the Chang-Zhu-Tan area (longitude from 110˚53′ to 114˚15′ and latitude from 26˚3′ to 28˚40′). The concen- trations of PAHs were analyzed and their spatial varia- tions were evaluated. The possible sources of PAH con- tamination were studied using the methods of isomer ratios, principal components analysis and REE analyses. The purpose of the study is to evaluate the current situa- tion of PAHs pollution in this area and their potential controlling factors and to provide a reference for regula- tory action to improve environmental quality in this re- gion. 2. Materials and Methods 2.1. Sample Collection Method Sampling sites were selected in the centre of the three cities, based on different anthropogenic activities such as vehicular traffic density and industrial, commercial as well as other local activities. Sets of stainless steel plates (area 60 × 40 cm2, height 5 cm, flat bottom) for collect- ing bulk deposition (dry and wet depositions mixed to- gether) were placed at eight sites in Changsha, six sites in Xiangtan and Zhuzhou respectively. Sampling was con- ducted from May 15 to August 5, 2009, with sampling sites described in Table 1, while the height of all sam- pling sites to the ground was about 1.5 m. Besides, the special dust samples ZDD, ZYD and CWG were taken from the chimney of Xiangtan coal-fired power plant, the chimney of Zhuzhou Smelter and Refinery of Nonferrous Metals and automobile exhaust, respectively. Dust parti- cles were wiped off from the bottom of plates with a brush, dried in a desiccator for 48 hours, and then ground using a mortar and pestle and sieved (200 mesh). The samples were refrigerated (4˚C) during transport to the laboratory, where they were stored at –20˚C until ana- lyzed. 2.2. PA H s Analys is A PAH analysis procedure was developed after modify- ations of several PAH analysis methods in the literature c Copyright © 2011 SciRes. JEP  Sources of Polycyclic Aromatic Hydrocarbons in Street Dust from the Chang-Zhu-Tan Region, Hunan, China Copyright © 2011 SciRes. JEP 1333 Table 1. Sa mple sites and environmental data for street dust in Chang-Zhu-Tan region. Number Sample ID Sample site Representative environment 1 C1 Jinfan district Densely populated with residential house 2 C2 Wuyi Square The centre of Commercial and residential in Changsha city 3 C3 Changsha Evening Paper Commercial area, with heavy traffic intersection 4 C4 Dongtun Ferry Traffic area near Xiangjiang River 5 C5 Yanzi Nest Residential area 6 C6 Changsha Southern Bus Station Area of heavy traffic 7 C7 Changsha Municipal Government Office area with higher percentage of greenery coverage 8 C8 Changsha Western Bus Station Traffic area, under the Yulu Mountain 9 Z1 Baoting village Residential area 10 Z2 Zhicheng Chemical plant Industrial region of chemical plants 11 Z3 Luojiachong Residential area, between two high ways 12 Z4 Qinyun village Restaurant near one main road 13 Z5 Zhuzhou Municipal Government officer area and shopping center , near one main road 14 Z6 Geological Survey of Zhuzhou Institute Office area 15 X1 Bantangpu Industry area, near one main road 16 X2 Jianshe Road Residential area 17 X3 Xiangtan Eastern Bus Station Area of traffic 18 X4 Yuetang Industrial area, near one main road. 19 X5 Xiangtan coal-fired power plant Industrial area 20 X6 Xiangtan Municipal Government Office area, at the west of Xiangtan coal-fired power plant 21 ZDD Xiangtan the chimney of Xiangtan coal-fired power plant 22 ZYD Zhuzhou the chimney of Zhuzhou Smelter and Refinery of Nonferrous Metals 23 CWG Changsha automobile exhaust [8]. Analytical procedure, samples extraction, separation, cleanup and concentrating were carried out in the Key Laboratory of Organic in Guangzhou Institute of Geo- chemistry, Chinese Academy of Sciences. Dust sample (5 g dry weight) was weighed into a Soxhelt extractor, while 200 mL dichloromethane, 2 g activated Cu mesh and surrogate standards were added into a 250-mL flask. Activated Cu was added for desulphurization. A mixture of deuterated PAH surrogate standards (NAP-d8, ACE- d10, PHE-d10, CHR-d12) was added into each sample prior to extraction. Then the sample was Soxhlet-ex- tracted continuously for 48 h at a temperature of 46˚C. The extract for each sample was concentrated and sol- vent-exchanged to hexane, and further purified using 1:2 aluminum/silica column chromatography. The first frac- tion containing aliphatic hydrocarbons was eluted with 15 ml n-hexane. The second fraction containing PAHs and organochlorine pesticides (OCPs) was eluted with 70 ml of a mixture dichloromethane and n-hexane (V:V = 40:60). The third fraction containing PAEs (phthalate esters) was eluted with 40 ml of a mixture acetone and n- hexane (V:V = 20:80), and the mixture was then concen- trated with the rotary evaporator and rationed to 1 ml finally. The PAH fraction was analyzed on a Hewlett- Packard (HP) 6890II GC with a 5973 MSD operated on the scan mode. The separation was carried out on a 30 m × 0.25 mm i.d.HP-5 (film thickness 0.25 μm) fused-silica capillary column from J&W Co. The column temperature was initially set at 70˚C for 6 s, raised to 285˚C at the speed of 5˚C/min, and then held at 285˚C for 12 min. The injection port, interface line, and ion source temperature were maintained at 300˚C, 300˚C, and 230˚C, respect- tively. Helium with high purity was the carrier gas at a flow of 1.2 ml/min and a linear velocity of 25.4 cm/s at 300˚C. The operation time lasted for up to 73 min. The instrument was calibrated daily with calibration stan- dards and the relative percent difference between the five-point calibration and daily calibration was less than 20%. The procedure was also checked for recovery effi- ciencies by analyzing street dusts spiked with PAH stan- dards. Procedural blanks, spiked blanks (standards spiked into solvent) and sample duplicates were analyzed rou- tinely. Surrogate standards were added to all the samples (including QA samples) to monitor procedural perform- ance and matrix effects. The average recoveries were between 85% - 112%. 2.3. REE Analysis 0.1 g of dried sample (mesh 200) was decomposed in a  Sources of Polycyclic Aromatic Hydrocarbons in Street Dust from the Chang-Zhu-Tan Region, Hunan, China 1334 polyterafluoroethylene (PTFE) pressure container by means of a combined HF/HClO4 (10 mL HF and 4 mL HClO4). After digestion, the samples were evaporated to incipient dryness and redissolved with HNO3 for 2 times. The final sample dissolution was performed with 2% HNO3. Be- fore analysis, Ru and Re solutions were added as internal standards to compensate for instrumental drift. Induc- tively coupled plasma (ICP) mass spectrometry (MS) ana- lysis of the obtained sample solutions was carried out with an externally calibrated Thermo Electron VG PQ EXCELL quadrupole ICP mass spectrometer. Details on the interference corrections applied to correct analytic iso- topes for molecular and isobaric interferences are given by Dulski [21]. The analytical procedure was validated by analysis of international reference standards and re- peated independent sample preparation. The relative de- viations of the standard analyses to the reference values are below ±6%. 2.4. Data Analysis Techniques Isomer ratios of Flu/(Flu + Pyr) vs BaA/(BaA + Chry), and BaA/(BaA + Chry) vs InP/(InP + BgP) were used to identify the possible sources of PAHs. The principal com- ponent analysis (PCA) was conducted to quantify the sour- ce contributions of PAHs. The significance level and KMO and Bartlett’s test of sphericity were performed to test the adaptability of PCA. The number of significant factors was determined during the stepwise multiple linear regre- ssion which identified the factors that significantly im- proved the regression between the factors and the meas- ured total PAH concentrations [8]. PCA with Varimax rotation was performed using PASW statistics 18 for Win- dows. The REE patterns of the dust samples are chon- drite-normalized concentrations. 3. Results and Discussion 3.1. PA Hs Concentrat io ns The concentrations of individual PAHs ranged from 10 to 4316 ng/g, the most serious species were phenanthrene, fluorene, benzo[b]fluoranthene, pyrene and chrysene, the maximal values of which were 13,947 ng g-1 at site of X5, followed by 9910 and 9372 ng/g at site Z2 and C4, respectively. However, acenaphthene, acenaphthylene, an- thracene and dibenz[a,h]anthracene had relatively lower concentration in this regions, which was below 200 ng g- 1 in most cases, while many of which had less than 3- ring in their structures. The high molecular weight (HMW) PAHs (4 - 6 rings), ranging from 47.51% to 82.11% (mean of 74.79%), were the dominant PAH compounds in al- most all of the dust samples. The ΣPAH16 concentrations ranged from 3515 to 14,470 ng/g in Changsha, 4190 to 13,197 ng/g in Zhuzhou and 9530 to 24,488 ng/g in Xiangtan and the average concentrations of ΣPAH16 were 8760 ng/g in Chang-Zhu-Tan, 6539 ng/g in Chang- sha, 6953 ng/g in Zhuzhou and 13,527 ng/g in Xiangtan. The highest ΣPAH16 concentrations corresponded to Xiangtan sampling site X5 (24,488 ng/g), then followed by C4 (14,470 ng/g), X1 (13,337 ng/g) and Z2 (13,197 ng/g). The lowest ΣPAH16 concentrations (3515 ng/g) were observed in site C7, then followed by C8 (3935 ng/g) and C1 (4105 ng/g). The PAH concentrations have been compared with results in street dust from other sites reported in literature (Table 2). The ΣPAH16 concentra- tions in this study were higher than those of Shanghai (3180 to 17,090 ng/g, Mean 8480 ng/g [5]), Beijing (660 to 12,100 ng/g [9]), Berlin (2400 to 21,000 ng/g, Mean 6400 ng/g [1]) and USA (Mean 4520 ng/g Max 15,200 ng/g [22]). However, they were lower than those of in- door dust of Macao (2720 to 24,830 ng/g, Mean 10,660 ng/g [23]). The sum of seven carcinogenic PAHs (Benz- [a]anthracene, Chrysene, Benzo[b]fluoranthene, Benzo- [k]fluoranthene, Benzo[a]pyrene, Indeno[1,2,3-cd] pyre- ne and Dibenz[a,h]anthracene) ranged from 1293 to 11,709 ng/g, with a mean of 3527 ng/g. Benzo[a]pyrene, which is considered to be the most hazardous of all PAHs (Os- borne and Crosby 1987; Cerna et al. 2000; Benford et al. 2010), was detected in all samples analyzed (ranged from 129 to 1827 ng/g, with a mean of 547 ng/g) and was more than two times higher in Xiangtan (971 ng/g) than those in Changsha (309 ng/g) and Zhuzhou (441 ng/g) cities. Compared with the results in street from other sites reported in literature (Table 2), the average concen- tration of Benzo[a]pyrene in this region (547 ng/g) was higher than those in USA (260 ng/g, [22]) and Macao (300 ng g-1, [23]), however, it was lower than the con- centration of Shanghai (1280 ng/g [5]). 3.2. PAH Isomer Ratios PAH ratios were widely used as directors to detect PAH sources [5,9,13]. Some PAH pairs ratios, such as Fluo/ (Flu + Pyr), BaA/(BaA + Chry) and InP/(InP + BgP), had been used as distinct chemical tracers to infer possible sources of PAHs in environmental samples [8,13]. For Fluo/(Flu + Pyr), ratios < 0.4, 0.4 - 0.5 and >0.5 suggest petroleum origins, petroleum combustion, and combus- tion origins of coal, grasses and wood, respectively. For InP/(InP + BgP), ratios < 0.2, 0.2 - 0.5, and >0.5 indi- cated petroleum, petroleum combustion and combustion origins of coal, grasses and wood, respectively [13]. For BaA/(BaA + Chry), ratios < 0.2, 0.2 - 0.35 and 0.35 im- plied petroleum origins, petroleum or combustion (mixed sources), combustion origins of coal, grasses and wood, respectively. In this study, the corresponding cross plots of the ratios of Fluo/(Flu + Pyr), InP/(InP + BgP) and aA/(BaA + Chry) are shown in Figure 1 and Figure 2. B Copyright © 2011 SciRes. JEP  Sources of Polycyclic Aromatic Hydrocarbons in Street Dust from the Chang-Zhu-Tan Region, Hunan, China Copyright © 2011 SciRes. JEP 1335 Table 2. Comparison of PAHs measurements (ng/g ) i n street dusts from out door colle cted in different regions in the world. Chang-Zhu-Tan Changsha Zhuzhou Xiangtan Shanghai Macao Berlin USA Mean Max Mean Max Mean Max MeanMax Mean MaxMeanMaxMedianMax Mean Max Nap 459 2212 249 418 375 973 8252212530131070 1402001900 330 4300 Acy 61 194 51 170 61 194 72 100Nd55050 90 30 100 80 270 Ace 45 190 20 38 49 190 74 11233058020 20 50 260 50 180 Flo 158 720 100 214 194 720 199311390 5006 15090 240 120 1220 Phe 1380 4316 1066 1917 1468 4316 171122601640358066016209602110 440 2150 Ant 125 534 82 183 137 534 17127038037012037070 210 120 750 Flu 1541 3831 1222 2728 1234 2786 22733831 520560134042409603190 520 1890 Pyr 1026 2873 737 1769 845 1826 1593287314602980196061506702280 430 1650 BaA 363 1411 228 501 200 340 7061411720105045012002901410 220 690 Chry 790 2146 634 1443 546 650 1243214610601840192040005502000 390 2410 BbF 917 2881 866 1578 656 969 12472881970144088018805401900 #550 #1340 BkF 277 883 217 804 140 220 494883 83010803909203701910 *250 *610 BaP 547 1827 309 807 441 1292 9711827128019203007002901390 260 750 InP 499 2013 363 973 291 591 8872013850 28064015103302110 230 630 DbA 135 548 96 227 79 148 24254854093020052050 290 230 700 BgP 438 1543 299 765 239 466 8211543760 680160032003501280 100 410 ΣPAH16 8760 24,488 6539 14,470 6953 13,19713,52724,488848017,09010,66026,710800☆22☆,580 4520☆ 15☆,200 Note: #: Sum of Benzo(b)fluoranthene and Benzo(k)fluoranthene; *: the concentration of Coronene; : Sum of ∑PAH16 and Benzo(e)fluoranthene and ☆ Coronene. Figure 1. PAH cross plots for the ratio InP/(InP + BgP) vs BaA/(B aA + Chry). As shown in Figure 1, except for the street dusts at the sites of Z5, C8, X3, X4, X1 and X5, the InP/(InP + BgP) Vs BaA/(BaA + Chry) ratios for all the samples within a relatively narrow range of values indicate a major mixed sources of petroleum and combustion, while Z5 and C8, X3 and X4 and X5, X1 indicate a major sources of un- burned petroleum, a major combustion of coal, grasses and wood, petroleum combustion, respectively. The re- sults of InP/(InP + BgP) Vs BaA/(BaA + Chry) ratios analysis were confirmed by plotting Fluo/(Flu + Pyr) Vs BaA/(BaA + Chry) values except at the site of X1 which indicated a major combustion of coal, grasses and wood source (Figure 2). 3.3. PCA Analysis Principal component analysis (PCA) was performed to separate PAHs having similar sources and modes of in- put [8]. PCA of the PAHs for Chang-Zhu-Tan dusts re- sulted in the first two factors (62.49, 23.28, respectively) accounting for 85.77% of the total variability (Table 3). Factor 1 was heavily weighted by pyrene, benz[a]anthra- cene, chrysene, benzo[b]fluoranthene, benzo[k]fluoran- thene, benzo[a]pyrene, indeno[1,2,3-cd]pyrene, dibenz- [a,h]anthracene, and benzo[ghi]perylene. Benz[a]anthra-  Sources of Polycyclic Aromatic Hydrocarbons in Street Dust from the Chang-Zhu-Tan Region, Hunan, China 1336 Figure 2. P A H cross plots for the ratio BaA/(BaA + Chry) vs Fl u/(F lu + Pyr). Table 3. Rotat ed component Matrix of PAHs in street dusts of Chang-Zhu-Tan region. Nap Acy Ace Flo Phe Ant FluPyrBaAChryBbFBkFBaPInP DbA BgP Variance (%) Factor1 0.46 0.19 0.22 –0.04 0.15 0.16 0.69 0.750.900.920.780.91 0.84 0.93 0.95 0.96 62.49 Factor2 0.42 0.85 0.93 0.99 0.97 0.98 0.69 0.65 0.330.300.060.22 0.10 0.05 0.06 0.17 23.28 cene, chrysene, benzo[k]fluoranthene, benzo[a]pyrene, in- deno[1,2,3-cd]pyrene, dibenz[a,h]anthracene, and benzo- [ghi]perylene were consistent with the emission characte- ristics of PAHs from coal combustion and vehicle emi- ssion in China [24], while benzo[b]fluoranthene was con- sistent with the emission of diesel [7] (Simcik et al . 1999). Factor 2 had a significant positive loading of 2 - 3 ring acenaphthylene, acenaphthene, fluorene, phenanthrene, and anthracene (Table 3), which could be considered as combined components of petroleum [7] and coking sour- ces [25]. Table 4 showed that at sites of X5, C4, X6 and X2 were characterized by higher score of factor 1 as well as at sites of Z2 and X1 were characterized by higher score of Factor 2. 3.4. REE Distribution The concentration of REEs and the chondrite-normalized REE patterns in dust samples, background soils [26] and the three special dust samples from Chang-Zhu-Tan re- gion were presented in Table 5 and Figure 3, respect- tively. The content of total rare earth elements (ΣREE) of dust samples varied from 47.3 to 261.09 µg/g which were lower than that of the background soil samples ex- cept for the sample at the site of Z2 (261.09 µg/g) and higher than the values of CWG (8.11 µg/g) and ZYD (65.49 µg/g) except for the sample at the site of C4 (47.30 µg/g). The concentration of the light rare earth elements (LREEs) was higher than that of the heavy rare earth elements (HREEs). The LREE/HREE ratios of the dust samples varied from 3.34 to 10.92, which were similarly to those of ZYD, ZDD and the background soil samples except for the sample at the site C4 which was similar to that of CWG. Almost all the samples showed a negative Ce and Eu anomaly except samples at the sites of X1 and X4, C-soil and ZYD showed positive Ce anomaly and sam- ples at sites of C2, C4, Z6, X1, X3 and X4, CWG and ZYD showed positive Eu anomaly. 3.5. Sources Trace by REE and PCA Analysis The sample at site of C4 showed a negative Ce and a positive Eu anomaly with a similar chondrite-normalized REE pattern to that of CWG (Figure 3 Changsha) which suggested similar dust sources between the sample at site Table 4. Factor scores for PAHs in street dusts of Chang-Zhu-Tan region in principal component analysis (P CA). Changsha Zhuzhou Xiangtan C1 C2 C3 C4 C5 C6 C7C8Z1Z2Z3Z4Z5Z6X1 X2 X3 X4X5X6 Score of F1 –0.62 –0.38 0.00 1.04 –0.41 –0.56 –0.80 –0.66 –0.54 –1.54 –0.41 –0.58 –0.320.010.39 0.73 0.44 0.243.35 0.62 Score of F2 –0.70 –0.22 –0.05 0.57 –0.58 –0.64 –0.57 –0.62 –0.283.73–0.47 –0.70 –0.74–0.45 0.93 –0.08 0.23 –0.070.500.20 Copyright © 2011 SciRes. JEP 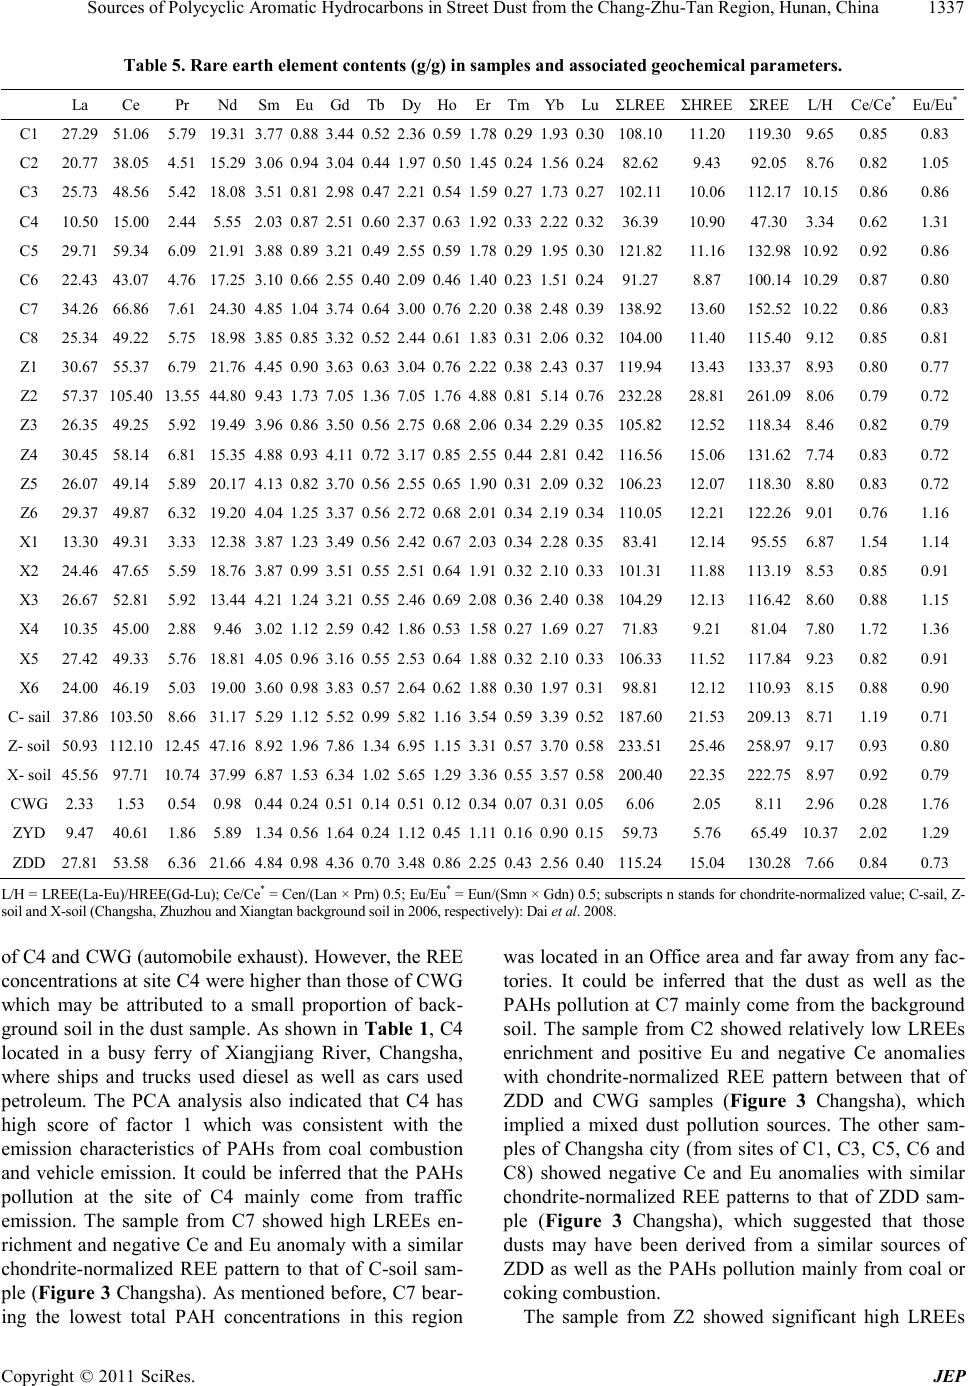 Sources of Polycyclic Aromatic Hydrocarbons in Street Dust from the Chang-Zhu-Tan Region, Hunan, China1337 Table 5. Rare earth element contents (g/g) in samples and associated geochemical p arameters. La Ce Pr NdSm Eu Gd TbDyHoErTmYbLuΣLREE ΣHREE ΣREE L/H Ce/Ce*Eu/Eu* C1 27.29 51.06 5.79 19.313.77 0.88 3.44 0.52 2.36 0.59 1.78 0.29 1.93 0.30108.1011.20119.30 9.65 0.85 0.83 C2 20.77 38.05 4.51 15.293.06 0.94 3.04 0.44 1.97 0.50 1.45 0.24 1.56 0.2482.629.43 92.05 8.76 0.82 1.05 C3 25.73 48.56 5.42 18.083.51 0.81 2.98 0.47 2.21 0.54 1.59 0.27 1.73 0.27102.1110.06112.17 10.15 0.86 0.86 C4 10.50 15.00 2.44 5.552.03 0.87 2.51 0.60 2.37 0.63 1.92 0.33 2.22 0.3236.3910.9047.30 3.34 0.62 1.31 C5 29.71 59.34 6.09 21.913.88 0.89 3.21 0.49 2.55 0.59 1.78 0.29 1.95 0.30121.8211.16132.98 10.92 0.92 0.86 C6 22.43 43.07 4.76 17.253.10 0.66 2.55 0.40 2.09 0.46 1.40 0.23 1.51 0.2491.278.87 100.14 10.29 0.87 0.80 C7 34.26 66.86 7.61 24.304.85 1.04 3.74 0.64 3.00 0.76 2.20 0.38 2.48 0.39138.9213.60152.52 10.22 0.86 0.83 C8 25.34 49.22 5.75 18.983.85 0.85 3.32 0.52 2.44 0.61 1.83 0.31 2.06 0.32104.0011.40115.40 9.12 0.85 0.81 Z1 30.67 55.37 6.79 21.764.45 0.90 3.63 0.63 3.04 0.76 2.22 0.38 2.43 0.37119.9413.43133.37 8.93 0.80 0.77 Z2 57.37 105.40 13.55 44.809.43 1.73 7.05 1.36 7.05 1.76 4.88 0.81 5.14 0.76232.2828.81261.09 8.06 0.79 0.72 Z3 26.35 49.25 5.92 19.493.96 0.86 3.50 0.56 2.75 0.68 2.06 0.34 2.29 0.35105.8212.52118.34 8.46 0.82 0.79 Z4 30.45 58.14 6.81 15.354.88 0.93 4.11 0.72 3.17 0.85 2.55 0.44 2.81 0.42116.5615.06131.62 7.74 0.83 0.72 Z5 26.07 49.14 5.89 20.174.13 0.82 3.70 0.56 2.55 0.65 1.90 0.31 2.09 0.32106.2312.07118.30 8.80 0.83 0.72 Z6 29.37 49.87 6.32 19.204.04 1.25 3.37 0.56 2.72 0.68 2.01 0.34 2.19 0.34110.0512.21122.26 9.01 0.76 1.16 X1 13.30 49.31 3.33 12.383.87 1.23 3.49 0.56 2.42 0.67 2.03 0.34 2.28 0.3583.4112.1495.55 6.87 1.54 1.14 X2 24.46 47.65 5.59 18.763.87 0.99 3.51 0.55 2.51 0.64 1.91 0.32 2.10 0.33101.3111.88113.19 8.53 0.85 0.91 X3 26.67 52.81 5.92 13.444.21 1.24 3.21 0.55 2.46 0.69 2.08 0.36 2.40 0.38104.2912.13116.42 8.60 0.88 1.15 X4 10.35 45.00 2.88 9.463.02 1.12 2.59 0.42 1.86 0.53 1.58 0.27 1.69 0.2771.839.21 81.04 7.80 1.72 1.36 X5 27.42 49.33 5.76 18.814.05 0.96 3.16 0.55 2.53 0.64 1.88 0.32 2.10 0.33106.3311.52117.84 9.23 0.82 0.91 X6 24.00 46.19 5.03 19.003.60 0.98 3.83 0.57 2.64 0.62 1.88 0.30 1.97 0.3198.8112.12110.93 8.15 0.88 0.90 C- sail 37.86 103.50 8.66 31.175.29 1.12 5.52 0.99 5.82 1.163.54 0.59 3.39 0.52187.6021.53209.13 8.71 1.19 0.71 Z- soil 50.93 112.10 12.45 47.168.92 1.96 7.86 1.34 6.95 1.15 3.31 0.57 3.70 0.58233.5125.46258.97 9.17 0.93 0.80 X- soil 45.56 97.71 10.74 37.996.87 1.53 6.34 1.02 5.65 1.29 3.36 0.55 3.57 0.58200.4022.35222.75 8.97 0.92 0.79 CWG 2.33 1.53 0.54 0.980.44 0.24 0.51 0.14 0.51 0.120.34 0.070.31 0.056.06 2.05 8.11 2.96 0.28 1.76 ZYD 9.47 40.61 1.86 5.891.34 0.56 1.64 0.241.120.451.110.160.900.1559.735.76 65.49 10.37 2.02 1.29 ZDD 27.81 53.58 6.36 21.664.84 0.98 4.36 0.70 3.48 0.862.25 0.43 2.56 0.40115.2415.04130.28 7.66 0.84 0.73 L/H = LREE(La-Eu)/HREE(Gd-Lu); Ce/Ce* = Cen/(Lan × Prn) 0.5; Eu/Eu* = Eun/(Smn × Gdn) 0.5; subscripts n stands for chondrite-normalized value; C-sail, Z- soil and X-soil (Changsha, Zhuzhou and Xiangtan background soil in 2006, respectively): Dai et al. 2008. of C4 and CWG (automobile exhaust). However, the REE concentrations at site C4 were higher than those of CWG which may be attributed to a small proportion of back- ground soil in the dust sample. As shown in Ta ble 1, C4 located in a busy ferry of Xiangjiang River, Changsha, where ships and trucks used diesel as well as cars used petroleum. The PCA analysis also indicated that C4 has high score of factor 1 which was consistent with the emission characteristics of PAHs from coal combustion and vehicle emission. It could be inferred that the PAHs pollution at the site of C4 mainly come from traffic emission. The sample from C7 showed high LREEs en- richment and negative Ce and Eu anomaly with a similar chondrite-normalized REE pattern to that of C-soil sam- ple (Figure 3 Changsha). As mentioned before, C7 bear- ing the lowest total PAH concentrations in this region was located in an Office area and far away from any fac- tories. It could be inferred that the dust as well as the PAHs pollution at C7 mainly come from the background soil. The sample from C2 showed relatively low LREEs enrichment and positive Eu and negative Ce anomalies with chondrite-normalized REE pattern between that of ZDD and CWG samples (Figure 3 Changsha), which implied a mixed dust pollution sources. The other sam- ples of Changsha city (from sites of C1, C3, C5, C6 and C8) showed negative Ce and Eu anomalies with similar chondrite-normalized REE patterns to that of ZDD sam- ple (Figure 3 Changsha), which suggested that those dusts may have been derived from a similar sources of ZDD as well as the PAHs pollution mainly from coal or coking combustion. The sample from Z2 showed significant high LREEs Copyright © 2011 SciRes. JEP  Sources of Polycyclic Aromatic Hydrocarbons in Street Dust from the Chang-Zhu-Tan Region, Hunan, China 1338 Figure 3. Chondrite-nornalized patterns for Chang-Zhu- Tan dust and background soil samples. Note: C-soil, REE Values of Changsha background soil in 2006 (Dai et al., 2009); Z-soil REE Values of Zhuzhou background soil in 2006 (Dai et al., 2009); X-soil, REE Values of Xiangtan background soil in 2006 (Dai et al., 2009). enrichment and characteristic negative Ce and Eu anoma- lies (Figure 3 Zhuzhou), however, its chondrite-norma- lized REE pattern was different from that of the Z-soil (whose L/H was lower than that of Z-soil) and approxi- mately parallel to that of ZDD sample (Figure 3 Zhu- zhou), as mentioned before, Z2 located in Zhicheng Chemical plant (Table 1) and characterized by high score of Factor 2 (Table 5) which was attributed to petroleum and coking sources. It could be inferred that the chemical production and coking combustion used in the chemical production should be its major PAH sources. The other samples in Zhuzhou city showed similar chondrite nor- malized REE patterns to that of ZDD sample (Figure 3 Zhuzhou). Thereby, a good connection between the dust samples at sites of Z1, Z3, Z4, Z5, Z6 and the sample ZDD must be assumed. It would be inferred that the sources of PAHs pollution mainly come from coal or coking combustion. The samples from X1 and X4 showed positive Ce and Eu anomalies with similar chondrite-normalized REE patterns to that of the ZYD sample (Figure 3 Xiangtan), which suggested the samples from X1 and X4 have been derived from a similar source of ZYD. Table 1 showed that X1 and X4 were located in Bantang industrial area and Yuetang industrial area, respectively, and near main highways. PAC analysis also showed high score of factor 2 at site of X1 and moderate scores of factor 1 at sites of X1 and X4. It could be inferred that the sources of PAHs pollution at X1 and X4 mainly come from industrial production (Smelter and Refinery of Nonferrous Metals production), then from the petroleum emission of vehi- cles. At the sites of X2, X5 and X6, the samples showed negative Ce and Eu anomalies with similar REE patterns to that of the ZDD sample. As Table 1 showed, X5 lo- cated in Xiangtan coal-fired power plant and X6 located in an office area but near the Xiangtan coal-fired power plant, while X2 located in a residential area where coal was the main fuel for the residents. The PCA analysis also indicated that at sites of X2, X5 and X6 had high scores of factor 1. It should be inferred that the dust as well as the PAHs pollution mainly come from coal com- bustion. The sample from X3 showed negative Ce and positive Eu anomalies with chondrite-normalized REE patterns between ZDD and ZYD (Figure 3 Xiangtan). As mentioned before, X3 was located in Xiangtan Eastern Bus Station, a traffic area and shopping centre, charac- terized by moderate high scores of factor1 and factor 2 (Table 4), which suggested a mixed PAHs pollution sources. The present study also indicates that the heavy PAHs pollution sites corresponded to the areas where factories, heavy traffic were interweaved, while the light PAHs pollution sites corresponded to the areas where far away from any factories. However, the boundaries among the industry areas, resident area, office areas and traffic areas were not distinct. They always weaved together and al- most all of the PAHs in this region had mixing sources, which corresponds to the results of the PAH isomer ra- tios, PCA and REE analysis as well as the energy struc- ture of this region. 4. Conclusions The PAH levels in dust of Chang-Zhu-Tan urban region were relatively high worldwide. The spatial variation of the PAH concentrations was significantly connected to the distribution of factories which was associated with coal or coking combustion and traffic circulation. Isomer ratios and factor analysis indicated that the main sources of PAHs were the mixing of coal combustion/traffic emissions and coking/petroleum combustion, REE analy- sis and Factor scores concretely showed the possible dust sources of each sample sites. The major PAHs pollution was coal or coking combustion from all sorts of factories and families, then, followed by traffic exhaust. The PAHs pollution in dust of Chang-Zhu-Tan urban region should be reduced by means of reducing coal and coking combustion, controlling the number of cars as well as planning residential areas away from the Indus- Copyright © 2011 SciRes. JEP  Sources of Polycyclic Aromatic Hydrocarbons in Street Dust from the Chang-Zhu-Tan Region, Hunan, China1339 trial and traffic zones. 5. Acknowledgements The authors thank Profession Dr. Xi Zhaozhuang and Dr. Gong Jianhua for collecting the samples. This research was funded by the China Geological Survey for ecosys- tem geochemistry assessment in cities of Changsha, Zhu- zhou and Xiangtan. REFERENCES [1] H. Fromme, T. Lahrz, M. Piloty, H. gebbhardt, A. Oddoy and H. Rϋden, “Polycylic Aromatic Hydrocarbons Inside and Outside of Apartments in an Urban Area,” Science of the Total Environment, Vol. 326, No. 1-3, 2004, pp. 143- 149. doi:10.1016/j.scitotenv.2004.02.002 [2] A. Krein, T. Udelhoven, J. N. Audinot, C. Hissler, C. guignard, L. Pfister, H. N. Migeon and L. Hoffmann, “Imaging Chemical Patches on Near-Surface Atmosphe- ric Dust Particles with NanoSIMS 50 to Identify Material Sources,” Water Air Soil Pollut , Fo cu s, Vol. 8, No. 5, 2008, pp. 495-803. doi:10.1007/s11267-008-9182-x [3] W. J. Aalker, R. P. McNutt and C. A. Maslanka, “The Potential of Urban Runoff to Surface Sediments of the Passaic River: Sources and Chemical Characteristics,” Chemosphere, Vol. 38, No. 2, 1999, pp. 363-377. doi:10.1016/S0045-6535(98)00186-6 [4] A. S. Mohamed, O. S. Tarek, I. A. E. M. Mohamed, M. I. F. Eiman and E. M. Mohamed, “PAHs in Sediments along the Semi-Closed Areas of Alexandria, Egypt,” Jour- nal of Environmental Protection, Vol. 2, 2011, pp. 700- 709. [5] Y. Ren, Q. Zhang and J. Chen, “Distribution and Source of Polycyclic Aromatic Hydrocarbons (PAHs) on Dust Collected in Shanghai, People’s Republic of China,” Bul- letin of Environmental Contamination and Toxicology, Vol. 76, No. 3, 2006, pp. 442-449. do i:1 0.10 07/ s0012 8 -006 -09 41- y [6] A. Gusev, E. Mantseva, Q. Rozovskaya, V. Shatalov, W. Aas and K. Breivik, “Persistent Organic Pollutants in the Environment,” EMEP Status Report 3, 2009. [7] M. F. Simcik, S. J. Eisenreich and P. J. Lioy, “Source Apportionment and Source/Sink Relationships of PAHs in the Coastal Atmosphere of Chicago and Lake Michi- gan,” Atmospheric Environment, Vol. 33, No. 30, 1999, pp. 5071-5078. doi:10.1016/S1352-2310(99)00233-2 [8] C. K. Wang, Y. X. Li, J. L. Liu, L. Xiang, J. H. Shi and Z. F. Yang, “Characteristics of PAHs Adsorbed on Street Dust and the Correlation with Specific Surface area and TOC,” Environmental Monitoring and Assessment, Vol. 169, No. 1-4, 2010, pp. 661-670. do i:1 0.10 07/ s1066 1 -009 -12 05- 1 [9] L. Xiang, Y. X. Li, Z. F. Yang and N. H. Shi, “Influence of Traffic Conditions on Polycyclic Aromatic Hydro- carbon Abundance in Street Dust,” Journal of Environ- mental Science and Health Part A, Vol. 45, No. 3, 2010, pp. 339-347. doi:10.1080/10934520903467923 [10] N. T. Edwards, “Polycyclic Aromatic Hydrocarbons (PAHs) in the Terrestrial Environment—A Review,” Journal of Environmental Quality, Vol. 12, 1983, pp. 427-441. doi:10.2134/jeq1983.00472425001200040001x [11] N. Yassaa and A. Cecinato, “Composition of Torched Crude Oil Organic Particulate Emitted by Refinery and Its Similarity to Atmospheric Aerosol in the Surrounding Area,” Chemosphere, Vol. 60, No. 11, 2005, pp. 1660- 1666. doi:10.1016/j.chemosphere.2005.02.041 [12] C. V. M. Peter, M. Barbaraj and W. Jennifert. “PAHs Underfoot: Contaminated Dust from Coal-Tar Sealcoated Pavement Is Widespread in the United States,” Environ- mental Science & Technology, Vol. 43, No. 1, 2009, pp. 20-25. doi:10.1021/es802119h [13] M. B. Yunker, R. W. Macdonald, R. Vingarzan and R. H. Mitchell, “PAHs in the Fraser River Basin, a Critical Ap- praisal of PAH Ratios as Indicators of PAH Source and Composition,” Organic Geochemistry, Vol. 33, No. 4, 2002, pp. 489-515. doi:10.1016/S0146-6380(02)00002-5 [14] Y. T. Shen, K. Y. Wang, S. C. Zhang, Y. B. Ye, Q. Shen and X. J. Huang, “Source Apportionment of Polycyclic Aromatic Hydrocarbons in Surface Soil of Beijing, China,” Journal of Agro- Env ir onme nt Sc ienc e, Vol. 27, No. 2, 2008, pp. 549-554. [15] K. H. Johannesson and W. B. Lyons, “The Rare Earth Element Geochemistry of Mono Lake Water and the Im- portance of Carbonate Complexing,” Limnology and Ocea- nography, Vol. 39, No. 5, 1994, pp. 1141-1154. doi:10.4319/lo.1994.39.5.1141 [16] P. Gabrielli, C. F. Boutron, A. Marteel, J. R. Petit, B. Delmonte, V. Gaspari, P. Cescon and C. Barbante, “Rare Earth Elements as Tracers of Continental Dust Origin in EPICA Dome C Ice during Glacial and Interglacial Peri- ods,” Geophysical Research Abstracts, Vol. 9, 2007, pp. 3374. [17] Z. F. Tan, G. J. Liu, W. Zhang and Y. Y. Zhou, “Optinum Population Capacity forecast Based on Ecological Foot- print Analysis of the Changsha-Zhuzhou-Xiangtan City Cluster,” Journal of Wuling, Vol.35, No. 1, 2010, pp. 66- 69. [18] B. L. Pan, “Suggest the Ecological Environment of Xiang- jiang Drainage Basin Be one of Key Pollution Control Ar- eas in China,” Association Central Committee Propaganda Department, August 20, 2010, p. 1. http://www.mj.org.cn/mjzt/2009lhzt/jyxc/hjzy/200903/t20 090304_33853.htm [19] J. P. Yin, “Comprehensive Development of the Xiangji- ang River and Building with Two Types of Society in Chang-Zhu-Tan Region,” Hunan Traffic Technology, Vol. 4, 2010, pp. 103-107. [20] P. Zhang, Y. M. Shi, Z. W. Zhan, B. S. Hu and Y. W. Hu, “Annual Report on Development of Changsha-Zhuzhou- Xiangtan City Cluster, Blue Book of Changsha-Zhuzhou- Xiangtan City Cluster,” Social Sciences Academic Press, Beijing, 2010. [21] P. Dulski, “Reference Materials for Geochemical Studies: New Analytical Data by ICP-MS and Critical Discussion of Reference Values,” Geostandards Newsletter, Vol. 25, Copyright © 2011 SciRes. JEP  Sources of Polycyclic Aromatic Hydrocarbons in Street Dust from the Chang-Zhu-Tan Region, Hunan, China Copyright © 2011 SciRes. JEP 1340 No. 1, 2001, pp. 87-125. doi:10.1111/j.1751-908X.2001.tb00790.x [22] J. C. Chuang, G. A. Mack, M. R. Kuhlmann and N. K. Wilson, “Polycyclic Aromatic Hydrocarbons and Their Derivatives in Indoor and Outdoor Air in an Eight-Home Pilot Study,” Atmospheric Environment. Part B. Urban Atmosphere, Vol. 25, No. 3, 1991, pp.369-380. do i:1 0.10 16/ 0957 -12 72( 91) 9000 8-3 [23] S. H. Qi, J. M. Fu, G. Y. Sheng, Z. S. Wang, S. W. Tang, Y. Min, G. Zhang and Y. H. Deng, “Study on Priority Polycyclic Aromatic Hydrocarbons (PAHs) in Dustfall at Macao,” Research of Environmental Sciences, Vol. 14, No. 1, 2001, pp. 9-13. [24] S. C. Zhang, W. Zhang, K. Y. Wang, Y. T. Shen, L. W. Hu and X. J. Wang, “Concentration, Distribution and Source Apportionment of Atmospheric Polycyclic Aro- matic Hydrocarbons in the Southeast Suburb of Beijing, China,” Environmental Monitoring and Assessment, Vol. 151, No. 1-4, 2009, pp. 197-207. do i:1 0.10 07/ s1066 1 -008 -02 61- 2 [25] N. R. Khalili, P. A. Scheff and T. M. Holsen, “PAH Source Fingerprints for Coke Ovens, Diesel and Gasoline Engines, Highway Tunnels, and Wood Combustion Emis- sions,” Atmospheric Environment, Vol. 9, No. 4, 1995, pp. 533-542. doi:10.1016/1352-2310(94)00275-P [26] T. G. Dai, Q. H. Wu, J. Q. Deng and Y. Z. Long, “As- sessment of Ecological Geochemistry in Chang-Zhu-Tan Urban Region,” Central South University Press, Chang- sha, 2009, p. 175.
|