Vol.3, No.12, 1011-1021 (2011) Natural Science
http://dx.doi.org/10.4236/ns.2011.312126
Copyright © 2011 SciRes. OPEN ACCESS
Molecular dynamics simulation of the interaction of
ethanol-water mixture with a Pt surface
Kholmirzo Kholmurodov1,2*, Ermuhammad Dushanov1,3, Kenji Yasuoka4, Hagar Khalil5,
Ahmed Galal5, Sameh Ahmed6, Nasser Sweilam6, Hatem Moharram6
1Laboratory of Radiation Biology, Joint Institute for Nuclear Research, Dubna, Russia; *Corresponding Author: mirzo@jinr.ru
2Dubna International University, Dubna, Moscow Region, Russia;
3Institute of Nuclear Physics, Tashkent, Uzbekistan;
4Department of Mechanical Engineering, Keio University, Yokohama, Japan;
5Chemistry Department, Faculty of Science, Cairo University, Cairo, Egypt;
6Mathematics Department, Faculty of Science, Cairo University, Cairo, Egypt.
Received 9 November 2011; revised 29 November 2011; accepted 14 December 2011.
ABSTRACT
An analysis of the molecular dynamics of ethanol
solvated by water molecules in the absence and
presence of a Pt surface has been performed
using DL_POLY_2.19 code. The structure and
diffusion properties of an ethanol–water system
have been studied at various temperatures from
250 to 600 K. We have measured the self-diffu-
sion coefficients of the 50:50% ethanol-water
solution; in the absence of a Pt surface our re-
sults show an excellent agreement—within an
error of 7.4%—with the experimental data. An
increase in the self-diffusion coefficients with
the inclusion of a Pt surface has been observed.
The estimation of the diffusion coefficients of
both water and ethanol in the presence of a Pt
surface shows that they obey the Arrhenius
equation; the calculated activation energies of
diffusion of ethanol and water are 2.47 and 2.98
Kcal/mole, respectively. The radial distribution
function graphs and density profiles have been
built; their correlations with the self-diffusion
coefficients of both ethanol and water mole-
cules are also illustrated.
Keywords: Molecular Dynamics Simulations;
Ethanol Molecule; Water Active Solvent; Diffusion
Coefficient; Pt Surface; RDF Graphs
1. INTRODUCTION
In recent years, there has been a great interest in
studying the chemical and physical properties of ethanol
on a Pt surface, as ethanol is one of the most important
renewable fuels [1]. The intensive utilization of fossil
fuels has led to an increase in the generation of polluting
gases released into the atmosphere, which has caused
changes in the global climate. The solution to this prob-
lematic depends on how the development and imple-
mentation of technologies based on alternative sources
of energy will be undertaken. Among the renewable en-
ergetic resources, ethanol (ethyl alcohol, bioethanol) is
the most practical liquid biofuelboth as a fuel and a
gasoline enhancer. It is not toxic, does not contaminate
water sources [2], and can be produced in large quanti-
ties from agricultural products or biomass, which will
not change the natural balance of carbon dioxide in the
atmosphere in contrast to the use of fossil fuels [3].
Ethanol has been considered in recent years, and it has
a lot of applications. The most popular application is
fuels because of a decrease in the available petroleum
resources. For ethanol to be a fuel, the water content in
ethanol should be less than 1.3% [4], which is hard to
reach by crystallization. Pervaporation separation is a
valuable method that can save money, and therefore
much research is focused on it. Direct ethanol fuel cells
(DEFCs) are another important application for the con-
versation of chemical energy to electricity [5,6]. Water
and ethanol can be used not only in fuels, but also in
other applications, such as being a solvent to accelerate
the aging of some polymeric materials [7] and being
used in commercial cooling systems because of their
good thermophysical and technological characteristics
[8]. An alcohol-water mixture often shows quite differ-
ent properties than the corresponding pure components.
Of particular interest are the structure and diffusion
properties, which play important roles in the theoretical
study and technological applications involving mass
transfer [9]. In addition, from a microscopic viewpoint,
the knowledge of solution structure behavior is very
K. Kholmurodov et al. / Natural Science 3 (2011) 1011-1021
Copyright © 2011 SciRes. OPEN ACCESS
1012
fundamental to understanding and elucidating the mix-
ture diffusion phenomenon.
Molecular dynamics simulation is a powerful tool in
investigating the structure properties of solutions at the
molecular level, and it has been widely used to study
aqueous solutions [10,11]. Metal surfaces are often used
in the synthesis of oxygen containing compounds, such
as alcohols, and in the degradation of these oxygen-
containing compounds, where carbon-carbon (C-C) and
carbon-oxygen (C-O) bond formation and breakage are
the elementary steps in this type of process, and the
metal surface plays a primary role in the efficiency and
selectivity of these steps [12]. Platinum is the most
known catalyst for the oxidation of such molecule. It is
known to activate the dissociative adsorption of ethanol
at an appreciable rate [13]. Thus, studying the adsorption
of ethanol on a platinum surface can give more informa-
tion about the kinetics of this process. Molecular dy-
namics (MD) simulation is one of the most important
computational tools to study the liquid-surface interac-
tion. At a high temporal resolution, MD processes may
provide information about the dynamics of the system
and the events which take place on the surface within a
few picoseconds [14]. The application of molecular dy-
namics to liquids or solvent-solute systems allows the
computation of properties such as diffusion coefficients
or radial distribution functions for use in statistical me-
chanical treatments [15].
Few researches were performed on ethanol-water sur-
face. C. Zhang and X. Yang studied the structure behav-
ior and diffusion properties for an ethanol-water solution
and investigated the concentration dependence of prop-
erties [9]. Wang Yao-Chun et al. used MD simulation to
investigate the behavior of pure water molecules, ethanol
molecules, and water-ethanol mixture with various
weight fractions inside Au nanotubes [7]. D. J. Cooke et
al. studied the interface between the {1014} surface of
calcite and pure ethanol, pure water, and 50:50 mixture
(by amount) of water and ethanol [16].
To the best of our knowledge, little is known from lit-
erature surveys about the interesting ethanol-water in-
teractions in the presence of Pt surfaces. In the present
work, using the MD method, we have simulated ethanol-
water system in the absence and presence of a platinum
surface through a wide temperature rangefrom 250 to
600 Kand calculated self-diffusion coefficients. The
enhancement of the self-diffusion coefficients of both
water and ethanol molecules correlating with the etha-
nol-water structure has been well established in the
presence of a Pt surface.
2. SIMULATION METHOD
We have studied the molecular dynamics of a wa-
ter-ethanol solution system in the absence and presence
of a platinum surface using the DL_POLY_2.19 code,
which was developed by the Molecular Simulation
Group at the Daresbury Laboratory (England) with the
support of the Research Council for the Engineering and
Physical Sciences (project CCP5 of the simulation of
condensed phases). DL_POLY is a general-purpose MD
simulation package developed by W. Smith, T. P. For-
ester and I. T. Todorov [17,18].
2.1. Simulation Details
Ethanol and water molecules are described using the
force field from the DL_POLY data base [17,18], where
bonding, angular, and dihedral parameters are incorpo-
rated into standard molecular mechanics potentials.
Nonbonding interactions are accounted for via Len-
nard-Jones (LJ) potentials and Coulombic interactions
based on the partial charges associated in each atom. For
water, the SPC model is used. The computer simulations
have been performed for a MD cell of a volume V =
(54.92, 54.92, 63.8) Å3 under the energy and tempera-
ture control at T = 298 K and other temperatures. Start-
ing with a 50:50 (by molecules) water-ethanol solution,
with a corresponding density of about 0.78 g/cm3 and
588 Pt4 molecules of 2352 atoms, the total number of
atoms in the system was N = 16176; the chemical bonds
are constrained within a flexible bond with a length of
about 1 Å. The integration of the equations of motion
was performed using the Verlet integration scheme in
quaternion. The integration step was 1 fs (fem- tosecond);
a microcanonical (nvt) ensemble was used for the simu-
lated system, and the Nose-Hoover algorithm was em-
ployed to keep the desired temperature. The intermo-
lecular chemical bonds were estimated on the basis of
the Shake algorithm with an accuracy of 10–8. The
Ewald summation with a convergence parameter of 10–6
was used for the calculation of electrostatics forces in
the periodic system. The total number of steps was
100,000 for each temperature, and all simulations were
periodic in three dimensions.
The configuration energy of the molecular model is
represented as a sum of the energies of the bonding (Eval)
and non-bonding (Enb) interactions:
val nb
EE E
. (1)
The energy of the valence (bonding) interactions Eval
is given by the following formula:
valbondangdih teth
EE EEE
, (2)
where Ebond is the energy of chemical bonds, Eang is the
energy of angular bonds, Edih is the energy of dihedral
bonds, and Eteth is tether energy.
The energy of the non-valence (non-bonded) interac-
K. Kholmurodov et al. / Natural Science 3 (2011) 1011-1021
Copyright © 2011 SciRes. OPEN ACCESS
101
1013
tions is a sum of the energies of the van-der-Waals
(vdW), electrostatics (Coulomb), and hydrogen bonds:
nbvdW coul
EE E. (3)
During the MD simulations, the following potential
types, which represent the topology of the molecular
field for an ethanol-water system, were used [18]:
Harmonic bond potential:
 
2
0
1
2
ij ij
UrKr r. (4)
Harmonic bond angle potential:
 
2
0
1
2
ijk ijk
UK

. (5)
Harmonic dihedral potential:
 
2
0
1
2
ijkn ijkn
UK

. (6)
The Lennard-Jones potential:

12 6
4ij ij
ij ijij
ij ij
Ur rr










. (7)
Coulombic interaction:

0
1
4π
ij
ij
ij
qq
Ur r
. (8)
Quadratic tether potential:

24
11
24
Urkr kr
. (9)
The tether potential suggests that the momentum wills
no longer be a conserved quantity of the simulation. The
force on the atom “i” arising from the tether potential is
obtained using the general formula:
0
0
00
1
ii
i
ii
F
Ur
rr

 

, (10)
where σij is the size parameter, εij the energy parameter,
σij = (σi + σj)/2 and iji j

, qi is the charge of site i
and rij the distance between sites i and j. We choose the
values of k = 0.2 and k' = 0.4 to avoid the destruction of
our surface during heating process.
Water was represented by the constrained OW–HW
bond potential; thus a SPC model was used. Tables 1-4
contain charges, bond lengths and intermolecular Len-
nard-Jones parameters for ethanol, water molecules, and
a Pt surface respectively.
2.2. Metal Potential
DL_POLY_2 includes density-dependent potentials
suitable for calculating the properties of metals. One of
the potentials used in our MD simulation is the one de-
scribed by Sutton and Chen (SC or st-ch) [19]:
i
i
UU
, (11)
1
2
n
ii
ji ij
a
Uc
r





. (12)
Here
i is a density-like term for atom i:
m
i
ji ij
a
r




. (13)
Here the potential has three dimensionless parameters
adjustable for the material. They are c, n, and m, and can
be chosen for various materials, especially metals. The
variable ε sets the energy scale; a is the lattice constant.
Table 3 contains the potential parameters of SC of Pt
surface which were used.
2.3. Simulation System
We have two simulated systems one for 50:50% etha-
nol-water in the absence and the other in presence of
platinum surface. The number of molecules of Pt surface
was kept constant (588 molecules), the density of water-
ethanol mixture in the two systems was 0.78 g/cm3. The
temperature of the system was varied from 250 to 600 K
using the annealing process starting with 250 K then
Table 1. The effective charges of atoms of ethanol, water and a
Pt surface.
Atom q/e, proton charge
C1 0.05
C2 –0.27
Oe –0.66
He 0.43
H 0.09
OW –0.82
HW 0.41
Pt 0.00
K. Kholmurodov et al. / Natural Science 3 (2011) 1011-1021
Copyright © 2011 SciRes. OPEN ACCESS
1014
Table 2. The potential parameters used for ethanol molecules.
Harmonic bond potential

2
02
ij
Kr r
Bond
K (kcalmol–1Å) r0 (Å)
C1-C2 222 1.52
C-H 309 1.11
C1-Oe 428 1.42
Oe-He 545 0.94
Angular potential

2
02
ijk
K


Group
K (kcalmol–1rad–2)
0 (˚)
H1-C1-Oe 45.90 109.44
H1-C1-C2 34.60 109.46
H1-C1-H1 35.50 120.00
Oe-C1-C2 75.70 109.00
He-Oe-C1 57.50 109.50
H2-C2-H2 35.50 109.50
H2-C2-C1 34.60 109.46
Dihedral potential

2
02
ijkn
K


Group
K (kcalmol–1)
0 (˚)
C2-C1-Oe-He 1.30 180
H12-C1-Oe-He 0.14 60
H11-C1-Oe-He 0.14 –60
Oe-C1-C2-H21 0.16 180
Oe-C1-C2-H22 0.16 60
Oe-C1-C2-H23 0.16 –60
H11-C1-C2-H21 0.16 –60
H11-C1-C2-H22 0.16 180
H11-C1-C2-H23 0.16 60
H12-C1-C2-H21 0.16 60
H12-C1-C2-H22 0.16 –60
H13-C1-C2-H23 0.16 –180
Table 3. The Sutton-Chen (st-ch) potential parameters of
platinum (Pt).
(kcalmol–1) a (Å) N m C
0.226 3.92 11.0 7.0 71.336
Table 4. Intermolecular Lennard-Jones parameters for ethanol,
water, and a Pt surface, water, and 588 Pt4 molecules contain-
ing a total of 16176 atoms in a volume V = (54.92, 54.92,
63.801) Å3.
Group
(kcalmol–1)
(Å)
C-C 0.12 3.30
C-H 0.00 2.54
C1-Oe 0.16 3.08
H-H 0.00 1.78
H-O 0.00 2.32
Oe-Oe 0.20 2.85
C-Pt 0.94 2.90
Oe-Pt 0.92 2.70
C-OW 0.14 3.43
Oe-OW 0.18 3.20
OW-OW 0.22 3.17
raises the temperature by 25 K in each simulation.
2.4. Metal Surface
The metallic substrate used was cubic Pt, which has
the formula Pt4; and it was arranged in 6 layers number-
ing a total of 2352 atoms. The surface area was 60.38 Å2;
and the lattice constant was a = 3.923 Å. All the pa-
rameters of platinum were taken from EIM databases
and datasets website supported by the Russian Founda-
tion for Basic Research [20].
3. RESULTS AND DISCUSSION
Figure 1 shows a snapshot of an equilibrated state of
a water-ethanol-Pt system with a total of N = 2892
molecules where the locations of water and ethanol
molecules on the surface are clearly seen.
From the MD simulation results, we first estimated
the self-diffusion coefficient D for both ethanol and wa-
ter molecules. We measured D in the absence and pres-
ence of a Pt surface. The diffusion coefficient D was
estimated for a 50:50% ethanol-water solution at 298 K
in the absence of Pt; the results were compared with
those of experimental [9] and other MD simulations [21,
22]. The diffusion coefficient of ethanol molecules De
derived from [21] was ranged from 0.98 to 1.0 × 10⁻⁹
m2s–1. The experimental De, at the same conditions as in
our simulations, was about 0.7 × 10⁻⁹ m
2s–1; from our
simulation, we have obtained De to be around 0.65 ×
10–9 m
2s–1, which is in agreement with experimental
K. Kholmurodov et al. / Natural Science 3 (2011) 1011-1021
Copyright © 2011 SciRes. OPEN ACCESS
101
1015
Figure 1. Snapshot of an ethanol-water-Pt system at 298 K
which consists of 1152 ethanol, 1152 water, and 588 Pt4
molecules containing a total of 16176 atoms in a volume V =
(54.92, 54.92, 63.80) Å3.
results with an accuracy of 7.4%. At the same time, the
self-diffusion coefficient of water Dw is about 1.5 × 10⁻⁹
m2s–1, which is in good agreement with the results of
[22], but still higher than the experimental one: 0.88 ×
10–9 m2s–1.
As regards the presence of a Pt surface, neither simu-
lation nor experimental data are available in the litera-
ture. From our MD simulations, the diffusion coeffi-
cients De and Dw of both ethanol and water have to in-
crease in comparison with the results on the absence of a
Pt surface. De reaches 1.07 × 10⁻⁹ m2s–1 and Dw reaches
2.1 × 10⁻⁹ m2s–1, which indicates that the presence of a
Pt surface essentially affects the mobility of the ethanol
and water molecules. The ethanol and water molecules
form an adsorption layer on the Pt surface. So, we ob-
serve competition between the adsorption and diffusion
processes as the molecules reach the metal surface; the
surface and bulk molecules exhibit different behavior.
Next, in Figure 2 we present the self-diffusion coeffi-
cients for water (a) and ethanol (b). The temperature of
the system was varied, and the temperature effect on the
self-diffusion coefficient for both water and ethanol
molecules were investigated. It is shown that the diffu-
(a)
(b)
Figure 2. A temperature dependence of the diffusion coeffi-
cient for water (a) and ethanol (b). The solid line represents an
ethanol-water-Pt system in the presence of a Pt surface; the
dashed lines represent an ethanol-water system in the absence
of a Pt surface.
sion coefficients decrease with decreasing temperature,
which is consistent with the formation of longer H-bonded
chains at low temperatures. Initially, at a low tempera-
ture (250 K), the presence of a Pt surface had no effect
on the value of D for both water and ethanol. After that,
the role of Pt appears, and the enhancement of the D
value in the presence of a Pt surface is clearly observed
especially at higher temperatures, which is consistent
with Pt being a good catalyst for such molecules.
It is believed that the self-diffusion coefficient follows
an Arrhenius-like relation with temperature [23]. The
relationship is

0expDD ERT
. (14)
As seen from Figure 3, the diffusion coefficient of
both water and ethanol in the presence of a Pt surface
obeys the Arrhenius equation; the calculated apparent
K. Kholmurodov et al. / Natural Science 3 (2011) 1011-1021
Copyright © 2011 SciRes. OPEN ACCESS
1016
Figure 3. Relation between ln D and reciprocal of temperature
in Kelvin, solid line for water and the dashed line for ethanol,
the inset figures represent the same relation at higher tempera-
ture range.
activation energies (E) of diffusion are 2.47 and 2.98
Kcal/mole for ethanol and water, respectively. These
low E values explain the higher self-diffusion coeffi-
cients of both ethanol and water.
From our MD simulations, the diffusion coefficient is
higher in the presence of a Pt surface than in its absence.
Apparently, as experimental and theoretical results indi-
cate, the diffusion coefficient is always higher in the
presence of many metallic surfaces than in their absence.
We observe a similar regularity in the presence of a Pt
surface because it is a good catalyst of ethanol oxidation
or dissociative adsorption. Such adsorption process
makes the bulk of ethanol to adsorb on the surface, so it
actively increases the mobility of the solution molecules
toward the surface. In this aspect, a good correlation of
our MD simulation results with experimental observa-
tions is clear.
It should be noted that all of the results presented
above are constructed for a bulk solution, and they are
not related specifically to the adsorbed molecules. It is
well known that the 2D surface diffusion is different
from that of a bulk solution.
3.1. Intermolecular Structure
The structure of liquids is ordinarily expressed in
terms of radial distribution functions (RDF) g(r). The
most structured and interesting g(r) functions for liquid
ethanol correspond to the O-H and O-O bonding. Fig-
ures 4(a) and 4(b) show the OW-HW and Oe-He RDF
graphs of 50:50% ethanol-water mixtures. It is shown
that Pt presence does not affect the RDF peak positions.
However, the inclusion of a Pt surface notably affects
the RDF amplitudes; the first peak at around 2 Å is a
strong evidence of hydrogen bonding in the bulk of the
(a)
(b)
Figure 4. The radial distribution functions (RDF) of 50:50%
ethanol-water mixtures for OW-HW (a) and Oe-He (b). The
solid line indicates the presence of a platinum surface; the dot-
ted line corresponds to the absence of a platinum surface.
solution. Figures 5(a) and 5(b) represent RDF graphs
for Oe-HW and OW-He atomic pairs. It is clear that a Pt
surface enhances the value of g(r), thereby making it
easier for ethanol and water to approach each other and
to establish a strong interaction between them. Such a
strong ethanol–water interaction results in a more pre-
ferred ethanol–water structure formation. The O-O
RDFs are shown in Figure 6, where O-O RDFs have
maximum peaks at around 2.4 - 2.8 Å. In contrast to the
O-H RDFs, the second O-O peak located around 3.2 -
3.5 Å is not very obvious, indicating that there is a weak
second correlation.
As we discussed before, the temperature of the system
was raised by the annealing process by 25 K in each
simulation, starting from 250 K to 600 K. The RDF
graphs representing the temperature effect on the water-
water, ethanol-ethanol and water-ethanol interactions
K. Kholmurodov et al. / Natural Science 3 (2011) 1011-1021
Copyright © 2011 SciRes. OPEN ACCESS
101
1017
(a)
(b)
Figure 5. The radial distribution functions (RDF) of 50:50%
ethanol-water mixtures for Oe-HW (a) and OW-He (b). The
solid line indicates the presence of a platinum surface; the
dashed line corresponds to the absence of a platinum surface.
are shown in Figure 7. It is seen that the liquids become
more structured when T decreases. Also, the temperature
changes do not affect significantly the peak positions,
but only the height and depth of the peaks. The corre-
sponding coordination numbers NC(r) for OW-He and
Oe-HW, which are determined by the integration of the
pair radial distribution functions, are plotted in the insets
of (Figures 7(c) and 7(d), respectively). The O-H coor-
dination number is associated with hydrogen bonding
information in the mixtures [24] up to first valleys
(around 2.5 Å). The NC(r) functions for OW-He and
Oe-HW show a clear plateau at low temperatures, while
at higher temperatures the NC(r) functions do not have a
horizontal plateau in the region of g(r) minima; their
values decrease with increasing temperature. It is worth
mentioning that the values of the NC(r) functions of both
OW-He and Oe-HW are lower than unity, which can
(a)
(b)
(c)
Figure 6. The radial distribution functions (RDF) of 50:50%
ethanol-water mixtures for OW-Oe (a), OW-OW (b) and
Oe-Oe (c). The solid line indicates the presence of a platinum
surface; the dashed line corresponds to the absence of a plati-
num surface.
K. Kholmurodov et al. / Natural Science 3 (2011) 1011-1021
Copyright © 2011 SciRes. OPEN ACCESS
1018
(a) (b)
(c) (d)
Figure 7. The effect of temperature on RDF graphs of (a) OW-HW; (b) Oe-He; (c) OW-He and (d) Oe-HW in presence of Pt surface
and the corresponding NC(r) of OW-He and Oe-HW, the temperature was raised by 25 K in each simulation starting from 250 K to
600 K.
also be a proof of our last conclusion: the hydrogen
networks between water and ethanol are disrupted.
3.2. Interaction with Pt Surface
During the molecular dynamics simulation, the inter-
facial structure of ethanol and water adsorption on Pt
was analyzed by calculating the normalized ethanol and
water density profiles as functions of the distance from a
Pt surface. The first highly ordered adsorption layer is
seen in Figure 8, where a simulation snapshot is shown
together with a plot of the density of both ethanol and
water molecules as a function of the perpendicular dis-
tance from the surface. From the density profile, there is
a well-defined first adsorption layer from ~2 to 5 Å and
one more diffuse layer from ~5 to 8 Å. For distances
beyond ~10 Å, the relative density approaches unity as
it would be expected in a bulk environment with no elec-
trode influence. According to the present results, the
interfacial region for ethanol adsorption on a Pt surface
covers the range of 2 - 9 Å with disorganization in-
creasing towards the bulk liquid. On the other hand, it is
observed that the relative density of water in the first
adsorption layer is very low relative to that of ethanol,
but for the second layer it is different. From this result,
we can suggest that hydrogen networks between water
and ethanol are disrupted as the solution mixture ap-
proaches the Pt surface. At a large distance from the
surface, the relative density of the liquids-ethanol and
water-approaches unity as it would be expected in a bulk
environment with no electrode influence. The results
K. Kholmurodov et al. / Natural Science 3 (2011) 1011-1021
Copyright © 2011 SciRes. OPEN ACCESS
101
1019
(a)
(b)
Figure 8. (a) Snapshot of the MD simulation of the water-
ethanol-Pt and (b) the density profile of ethanol-water system
in presence of Pt-surface, the densities of both ethanol and
water were normalized relative to the bulk density of solution
which is about 0.8 g/cm3.
also imply that ethanol molecules push the water mole-
cules away from the surface, thereby forming a strongly
adsorbed layer on the Pt surface. It is important to note
that the density profile falls to zero between the adsorp-
tion peak and the secondary peak, which means there is
little or no movement of ethanol molecules between the
adsorption layer and the bulk solvent within the time
scale of the simulation.
It is known that the diffusion coefficient of pure water
or ethanol is larger than that of the 50:50 liquid. From
the density profile illustrated above, the density of etha-
nol molecules on the first layer is higher than that of
water molecules. But for the second layer it is different;
the law is opposite. From this we can suggest that the
hydrogen networks between water and ethanol are dis-
rupted; then, near the surface, the liquid mixture is more
like either water or ethanol. The diffusion coefficient
will become larger. For the RDF, its amplitude in the
50:50 cases is larger. Thus, water-water or ethanol-
ethanol molecule interaction will intensify, thereby gov-
erning the total system’s dynamics.
The effect of temperature on the ethanol-Pt and wa-
ter-Pt interaction is shown in Figure 9. As we discussed
before, the liquids become more structured when T de-
creases. Also, temperature changes affect only the peak
amplitudes. By comparing g(r) for Pt-Oe and that for
Pt-OW, we can find that g(r) for Pt-OW shows a marked
decrease in the heights of peaks with increasing tempera-
(a)
(b)
Figure 9. The effect of temperature on The RDF graphs of (a)
Pt-Oe and (b) Pt-OW, the temperature was raised by 25 K in
each simulation starting from 250 K to 600 K.
K. Kholmurodov et al. / Natural Science 3 (2011) 1011-1021
Copyright © 2011 SciRes. OPEN ACCESS
1020
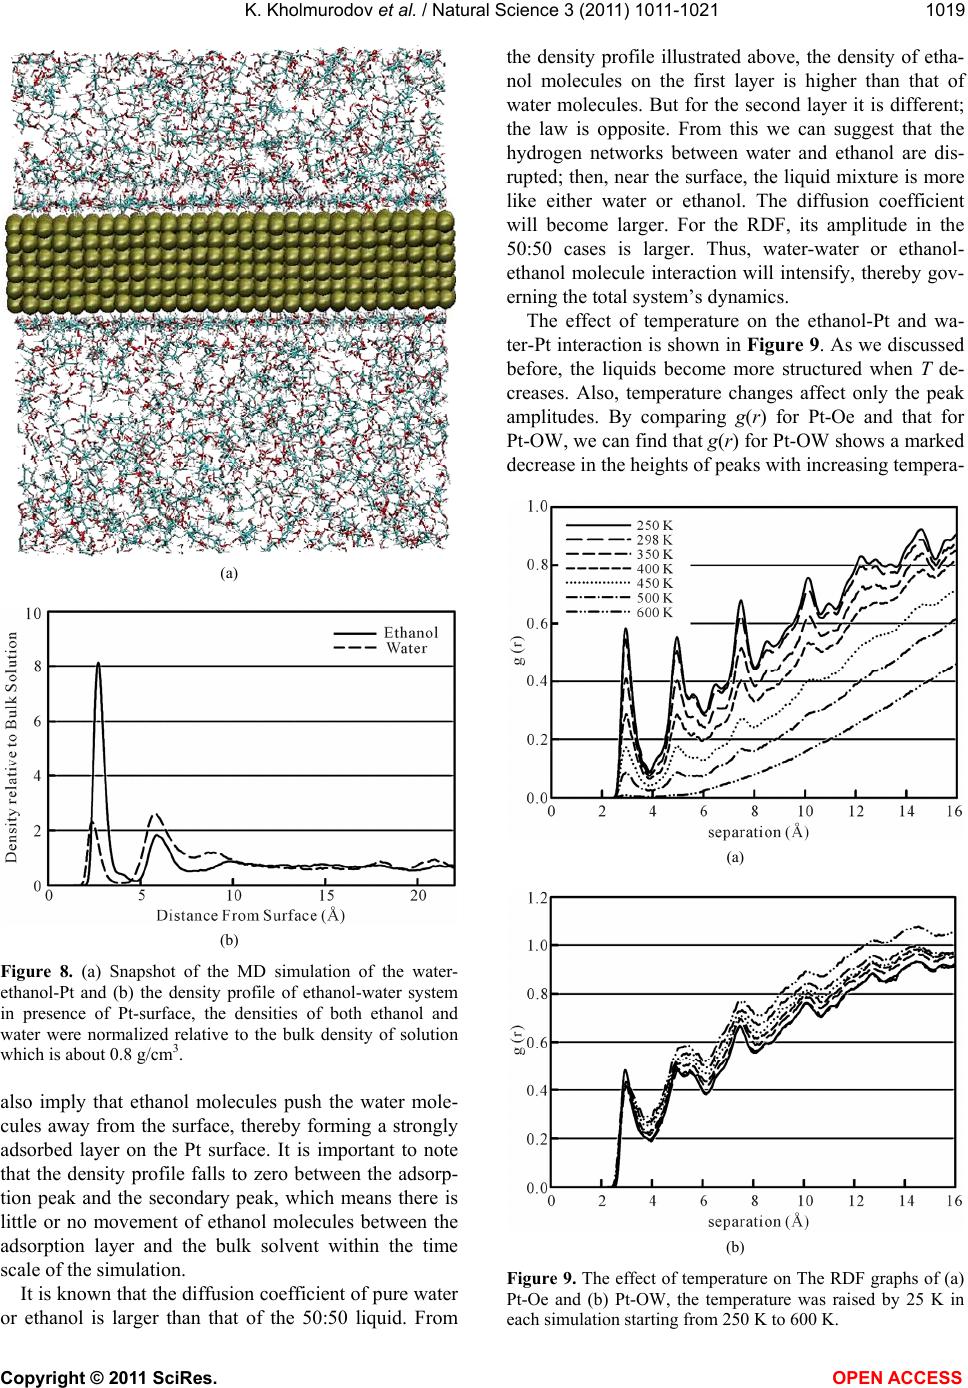
ture; finally, no peaks are observed in its RDF graph at
600 K. In contrast to the RDF of Pt-OW, the heights of
the peaks in the RDF graph of Pt-Oe do not behave so:
only the height of the first peak slightly decreases, and
the other peaks show slight increases in their heights
with increasing temperature. All these results prove that
at high temperatures most of water molecules get re-
moved from the surface by ethanol molecules until only
ethanol molecules are found at the Pt surface at 600 K
(supplementary videos visualizing our system at 600 K
are provided). The height of the first peak in the RDF
graph of Pt-Oe slightly decreases with increasing tem-
perature, which is due to the desorption process that can
occur at higher temperatures.
4. CONCLUSION REMARKS
We simulated a water-ethanol mixture in the presence
and absence of a Pt surface using DL_POLY version
2.19. The self-diffusion coefficients of both water and
ethanol in the presence and absence of a Pt surface were
calculated; an excellent agreement with the experimental
results has been found within an error of 7.4%. From our
MD simulations the enhancement of the self-diffusion
coefficients of both water and ethanol molecules related
to the ethanol-water structure have been well-established
in the presence of a Pt surface. As experimental and
theoretical results indicate, the diffusion coefficient is
always higher in the presence of many metallic surfaces
than in their absence. The temperature of the system was
varied using annealing process and its effects on self-
diffusion coefficient and radial distribution functions
(RDF) graphs were illustrated. The RDF graphs in
addition to the density profile have been built, and RDF
correlations with the self-diffusion coefficients of both
ethanol and water molecules are illustrated.
5. ACKNOWLEDGEMENTS
This work has been performed in the framework of joint collabora-
tive agreement Arab Republic of Egypt (ARE)—Joint Institute for
Nuclear Research (JINR) (project #302 “Molecular Dynamics Re-
search of Radiobiological Problems”). This work was supported in part
by the Grant in Aid for the Global Center of Excellence Program of the
Center for Education and Research of Symbiotic, Safe and Secure
System Design from Japan’s Ministry of Education, Culture, Sport,
and Technology.
Supporting Information Available: A visualization video of our
system, ethanol-water in presence of a Pt surface, at 600 K, this video
was created using VMD program. This material is available free of
charge via the internet at http://pubs.acs.org
REFERENCES
[1] Carlos, A.C. and Óscar, J.S. (2007) Fuel ethanol produc-
tion: process design trends and integration opportunities.
Bioresource Technology, 98, 2415-2457.
doi:10.1016/j.biortech.2007.01.002
[2] Carlos, A.C. and Óscar, J.S. (2008) Trends in biotechno-
logical production of fuel ethanol from different feed-
stocks. Bioresource Technology, 99, 5270-5295.
doi:10.1016/j.biortech.2007.11.013
[3] Shen, S.Y., Zhao, T.S. and Xu, J.B. (2010) Carbon sup-
ported PtRh catalysts for ethanol oxidation in alkaline
direct ethanol fuel cell. International Journal of Hydro-
gen Energy, 35, 12911-12917.
doi:10.1016/j.ijhydene.2010.08.107
[4] Vasudevan, V.N. and Leland, M.V. (2007) High perme-
ability membranes for the dehydration of low water con-
tent ethanol by pervaporation. Journal of Membrane
Science, 306, 209-215.
doi:10.1016/j.memsci.2007.08.050
[5] Song, S.Q. and Tsiakaras, P. (2006) Recent progress in
direct ethanol proton exchange membrane fuel cells (DE-
PEMFCs). Applied Catalysis B, 63, 187-193.
doi:10.1016/j.apcatb.2005.09.018
[6] Song, S.Q., Zhou, W.J., Zhou, Z.H., Jiang, L.H., Sun,
G.Q., Xin, Q., Leontidis, V., Kontou, S. and Tsiakaras, P.
(2005) Direct ethanol PEM fuel cells: The case of plati-
num based anodes. International Journal of Hydrogen
Energy, 30, 995-1001.
doi:10.1016/j.ijhydene.2004.11.006
[7] Yao-Chun, W., Chaun, C. and Shin-Pon, J. (2008) Ad-
sorption mechanism and dynamic behavior of water and
ethanol molecules inside Au nanotubes. Chinese Journal
of Catalysis, 29, 1099-1106.
doi:10.1016/S1872-2067(09)60008-5
[8] Kousksou, T., Jamil, A., Zeraouli, Y. and Dumas, J.P.
(2007) Equilibrium liquidus temperatures of binary mix-
tures from differential scanning calorimetry. Chemical
Engineering Science, 62, 6516-6523.
doi:10.1016/j.ces.2007.07.008
[9] Zhang, C., and Yang, X. (2005) Molecular dynamics
simulation of ethanol/water mixtures for structure and
diffusion properties. Fluid Phase Equilibria, 231, 1-10.
doi:10.1016/j.fluid.2005.03.018
[10] Kusalik, P.G., Lyubarts, A.P., Bergman, D.L. and Laak-
sonen, A. (2000) Computer simulation study of tertbutyl
alcohol. Structure in aqueous solution. Journal of Physi-
cal Chemistry B, 104, 9533-9539.
doi:10.1021/jp001887o
[11] Soper, A.K. and Finney, J.L. (1993) Hydration of metha-
nol in aqueous solution. Physical Review Letters, 71,
4346-4350. doi:10.1103/PhysRevLett.71.4346
[12] Sachtler, W.M.H. and Ichikawa, M. (1986) Catalytic site
requirements for elementary steps in syngas conversion
to oxygenates over promoted rhodium. Journal of Physi-
cla Chemistry, 90, 4758-4764.
doi:10.1021/j100411a009
[13] Ahmed, G., Atta, N.F., Darwesh, S.A. and Ali S.M. (2008)
Electrodeposited metals at conducting polymer elec-
trodes. II: Study of the oxidation of methanol at poly
(3-methylthiophene) modified with Pt-Pd Co-catalyst.
Topics in Catalysis, 47, 73-83.
[14] Kholmurodov, Kh., Puzynin, I., Smith, W., Yasuoka, K.
and Ebisuzaki, T. (2001) MD simulation of cluster-sur-
face impacts for metallic phases: soft landing, droplet
K. Kholmurodov et al. / Natural Science 3 (2011) 1011-1021
Copyright © 2011 SciRes. OPEN ACCESS
102
1021
spreading and implantation. Computer Physics Commu-
nications, 141, 1-16.
doi:10.1016/S0010-4655(01)00292-2
[15] David, C.Y. (2001) Computational Chemistry: A practi-
cal guide for applying techniques to real-world problems.
Chapter 7John Wiley & Sons, Inc., New York.
[16] Cooke, D.J., Gray, R.J., Sand, K.K., Stipp, S.L.S. and
Elliott, J.A. (2010) Interaction of ethanol and water with
the {1014} surface of calcite. Langmuir, 26, 14520-
14529. doi:10.1021/la100670k
[17] Smith, W. and Forester, T.R. (1996) A general-purpose
parallel molecular dynamics simulation package. Journal
of Molecular Graphics, 14, 136-141.
doi:10.1016/S0263-7855(96)00043-4
[18] Smith, W., Forester, T.R. and Todorov, I.T. (2008) The
DL POLY 2 User Manual, Version 2.19. STFC Daresbury
Laboratory, Daresbury, Warrington WA4 4AD Cheshire,
UK.
[19] Sutton, A.P. and Chen, J. (1990) Long-range Finnis-
Sinclair potential. Philosophical Magazine Letters, 61,
139-146. doi:10.1080/09500839008206493
[20] WWW-MINCRYST, Crystallographic and crystal-
lochemical database for minerals and their Structural
Analogues. http://database.iem.ac.ru/mincryst/
[21] Price, W.S., Ide, W.S. and Arata, Y. (2003) Solution dy-
namics in aqueous monohydric alcohol systems. Journal
of Physical Chemistry A, 107, 4784-4789.
doi:10.1021/jp027257z
[22] Wensink, E.J.W., Hoffmann, A.C., van Maaren, P.J. and
van der Spoel, D. (2003) Dynamic properties of wa-
ter/alcohol mixtures studied by computer simulation.
Journal of Chemical Physics, 119, 7308-7317.
doi:10.1063/1.1607918
[23] Li, W., Chen, C. and Yang, J. (2008) Molecular dynamics
simulation of self-diffusion coefficient and its relation
with temperature using simple Lennard-Jones potential.
Heat Transfer—Asian Research, 37, 86-93.
[24] Dixit, S., Crain, J., Poon, W.C.K., Finney, J.L. and Soper,
A.K. (2002) Molecular segregation observed in a con-
centrated alcohol-water solution. Nature, 416, 829-832.
doi:10.1038/416829a