 J. Biomedical Science and Engineering, 2011, 4, 774-787 doi:10.4236/jbise.2011.412096 Published Online December 2011 (http://www.SciRP.org/journal/jbise/ JBiSE ). Published Online December 2011 in SciRes. http://www.scirp.org/journal/JBiSE EEGcorco: a computer program to simultaneously calculate and statistically analyze EEG coherence and correlation Miguel Angel Guevara, Marisela Hernández-González*, Araceli Sanz-Martin, Claudia Amezcua Instituto de Neurociencias, CUCBA, Universidad de Guadalajara, Guadalajara, México. E-mail: mguevara@cencar.udg.mx, *mariselh@cencar.udg.mx, aracelisanz@yahoo.com, camezcu@cencar.udg.mx Received 30 September 2011; revised 7 November 2011; accepted 26 November 2011. ABSTRACT EEGcorco is a computer program designed to ana- lyze the degree of synchronization between two elec- troencephalographic signals (EEG) by mean the analysis of correlation and coherence index. The cor- relation and coherence values permit the quantitative determination of the similarity among EEG signals from homologous areas of the cerebral hemispheres (interhemispheric), and among localized areas within one cerebral hemisphere (intrahemispheric). EEG coherence is a function of frequency; thus it is com- monly presented in a spectral manner (coherence values in every frequency of the spectrum), in con- trast, the correlation function has been employed mainly to search periodic components of bioelectrical signals, and normally appears as punctual values defined in time, hence it is not common calculate correlation spectra. EEGcorco offers an easy and novel way to calculate correlation spectra by mean the application of the Fast Fourier Transformation (FFT) to digitized EEG signals. Both, correlation and coherence spectra are obtained in both independent frequencies and frequencies grouped in wide bands. Moreover, the program applies parametric statistical analyses to those coherence and correlation spectra also, for each individual frequency and for the fre- quencies grouped in bands. The program functions on any PC-compatible computer equipped with a Pentium or superior processor and a minimum of 512 Mb of RAM memory (though the higher the capacity the better). The space required on the hard disk de- pends on the signals to be analyzed, as the output takes the form of files in text format that occupy very little space. The program has been elaborated com- pletely in the Delphi environment for the Windows operating system. The efficacy and versatility of EEGcorco allow it to be easily adapted to different experimental and clinical needs. Keywords: EEG; EEG Coherence; EEG Correlation 1. INTRODUCTION The electroencephalogram (EEG) is defined as a mixture of rhythmic sinusoidal-like fluctuations in voltage gen- erated by the brain that, it has been suggested, represent the global activity of the pyramidal cells of the cortex and the activity of the neurons in the subcortical struc- tures [1]. It has been used for many years as a sensitive tool that makes it possible to examine brain functionality with no invasive intervention under many physiological conditions, during hormonal and pharmacological ma- nipulations, and while subjects are resolving different tasks [2,3]. This technique has an excellent temporal resolution that allows the researcher to obtain recordings of brain electrical activity from milliseconds to hours, days and even months; hence, it is probably due to this advantage that the EEG is still used in numerous labora- tories around the world. Although qualitative EEG analysis is still used in medicine, quantitative analysis of EEGs has become even more common due to the advances offered by per- sonal computers. Such computerized analyses require digitized EEG signals (discreet in amplitude and time) and can be based on two techniques: coherence, in the frequency domain; and correlation, in the time domain. Coherence and correlation are two mathematical in- dexes that allow the determination of the degree of simi- larity between two electroencephalographic signals and the establishment of a possible functional relation among different regions of the brain. Though the two methods are frequently considered equivalent, there are some important differences in the procedures used to calculate them and in the results they provide. Coherence is cal- culated by dividing the numerical square of the cross- spectrum by the product of the autospectra. Therefore, it is sensitive to changes in power as well as to alterations in phase relationships. Consequently, if either power or  M. A. Guevara et al. / J. Biomedical Science and Engineering 4 (2011) 774-787 775 phase changes in one of the signals, the coherence value is affected. Another important distinction is that the value of coherence for a single epoch or segment is al- ways 1, regardless of the true phase relationship and the differences in power between the two signals. Over suc- cessive epochs, the measure of coherence is dependent on the power and phase of the two signals through the epochs. If there is no variation over time in the original relationship between the two signals, then the coherence value will equal 1. This means that coherence does not give direct information on the true relationship between the two signals, but only on the stability of this relation- ship with respect to power asymmetry and phase rela- tionships. In contrast, correlation may be calculated over a sin- gle epoch or over several epochs and is sensitive to both phase and polarity, regardless of amplitude. The calcula- tion of coherence involves squaring the signal, which results in coherence values of 0 to 1, and a loss of polar- ity information. Unlike coherence, correlation is sensi- tive to polarity; hence correlation values rank from –1 to 1 [4]. From a historical point of view, correlation and co- herence have evolved in different ways: the former is a product of work carried out by statisticians and mathe- maticians; whereas the latter has been developed princi- pally by engineers, as it is based on spectral analysis, which is a fundamental tool in diverse areas of engi- neering [5]. The mathematical method for calculating the coefficient of punctual correlation was created by Karl Pearson [6]. Early publications related to the use of coherence in the analysis of EEG signals appeared after the publica- tion of Cooley and Tukey’s work [7], which reported the algorithm required to rapidly calculate the Discrete Fou- rier Transformation. Since then, EEG coherence has evolved as a method that involves the spectra of the cal- culation of the signals in a reasonably short time. EEG coherence, meanwhile, is a function of frequency; thus it is commonly presented in a spectral manner (co- herence values in every frequency of the spectrum) (Figure 1). On the other hand, the correlation function was em- ployed mainly to search for the periodic components of bioelectrical signals, and normally appears as punctual values defined in time. This analysis can be applied if there are two continuous variables whose relation is lin- ear and whose punctuations have been obtained in inde- pendent couples [8]. In recent years, interest in investigating the functional relationships among different cortical areas has in- creased, especially the way that this relationship changes from one physiological state to another. This interest is based on the assumption that electroencephalographic similarity between two cortical areas reflects similarity in the underlying neurophysiological processes, such as the same inputs, similar information processing, or broad connections between them. In the opposite case, when the underlying neurophysiological processes of two cor- tical areas are different, then EEG signals from the two areas are different as well [9-12]. In other words: the greater the functional relation between the two areas, the greater the similarity in their respective activity [11,13]. Both correlation and coherence have been used to compare electroencephalographic activity among differ- ent cortical regions under several behavioral conditions. Figure 1. Coherence spectrum of EEG signals; frequencies are grouped in 7 broad bands: delta, theta, alpha1, alpha2, beta1, beta2 nd gamma. a C opyright © 2011 SciRes. JBiSE  M. A. Guevara et al. / J. Biomedical Science and Engineering 4 (2011) 774-787 776 For example, changes in interhemispheric or intrahemi- spheric functional coupling have been observed during sleep as compared to wakefulness [14-18], as well as during the performance of voluntary movements and cognitive tasks [19-25]. In the clinical context, correla- tion and coherence have proven useful in investigating alterations in the functional relations among cortical regions in several pathologies, including cerebral tumors [26], epilepsy [27], schizophrenia [28-30], Asperger syndrome [31], autism [32], Alzheimer’s disease [33,34], and sleep apnea [35-37], among others. Also, differences in correlation or coherence have been found between the sexes [38-41] and among distinct age groups [42-44]. Considering the broad utility and application of these brain synchronization methods in both basic and clinical research, this report describes a computer program— EEGcorco—that has been designed to obtain rapidly and simultaneously, the coherence and correlation spectra of EEG signals, as well as statistical comparisons (para- metric) among groups or conditions of the signals in- volved. 2. COMPUTATIONAL METHODS AND THEORY 2.1. Algorithm for Calculating Coherence The program calculates coherence from the Fast Fourier Transformation (FFT). Figure 2 presents a diagram in- dicating the steps necessary to make this calculation: Coherence is defined in the frequency domain and its spectrum can be calculated by the Eq.1: 2 AB AA BB Sx coh xSxSx (1) where: 0,1, 2,,1xN (N frequencies into which signals A and B are decomposed). AB Sx is the crossed spectrum between signals A and B in the x frequency. AA Sx is the autospectrum of signal A in the x fre- quency. BB Sx is the autospectrum of signal B in the x fre- quency. 2 AB AA AB S COH SS Figure 2. Method for calculating coherence. The analog signals A and B are digitized through the analogical-digital convertor (A/D). From the digital signals, the instantaneous spectrum (1 segment) of each signal is obtained and, later, the autospectra (SAA and SBB) and crossed spectrum (SAB) (nd segments). The coherence spectrum is calculated on the basis of the autospectra and crossed spec- rum. t C opyright © 2011 SciRes. JBiSE  M. A. Guevara et al. / J. Biomedical Science and Engineering 4 (2011) 774-787 777 2.2. Algorithm for Calculating Correlation Having ascertained each of the components (frequencies) of the bioelectrical signals in the time domain, the Pear- son product-moment coefficient of punctual correlation for each frequency can be calculated using the following Eq.2: cov var var AB AA BB x rx x (2) where: 0,1, 2,,1 xN ( N frequencies into which signals A and B are decomposed). covAB is the covariance between signals A and B, in the x frequency. varAA is the variance of signal A in the x fre- quency. varBB is the variance of signal B in the x fre- quency. The correlation coefficient can also be calculated fol- lowing a method similar to that used in the coherence calculation. It involves the use of the spectra amplitudes of the signals, and is illustrated in Figure 3, and ex- plained following steps 1 to 4: 1) Discrete Direct Fourier Transformation: Eq.3 indi- cates how, from Eqs.4 and 5, it is possible to obtain the instantaneous spectrum of a digitized sign. 2 Instantaneus spectrum2 re Fim (3) 1 0 2π cos N n nx Fre xfnN (4) 1 0 2π N n nx Fimxfn senN (5) where: rex , imx : 0,1,2,,1xN (N frequencies into which the signals are decomposed) n: 0,1, 2,1,Nn (N samples that compose signals in time) Due to the properties of Discrete Fourier Transforma- tion, we know that the number of frequencies into which AA Sx AB Sx BB Sx AAreal AA AB Sx rx SxSx Correlation Figure 3. Method for calculating Pearson’s punctual correlation in each x frequency. Analog signals A and B are digitized through an analogical-digital convertor (A/D). From those digital signals, the instantaneous (1 segment) autospectra (SAA and SBB) and crossed spectrum (SAB) are calculated. Correlation in each x frequency is calculated on the basis of the autospectra and real part crossed spec- rum for this x frequency. t C opyright © 2011 SciRes. JBiSE  M. A. Guevara et al. / J. Biomedical Science and Engineering 4 (2011) 774-787 778 it is possible to separate the elements to a digital signal is N/2 plus an element that represents the average level of data (known as the level of direct current, or “DC” level); the remaining N/2 – 1 frequencies are an image of the first ones. 2) Discrete Inverse Fourier transformation: Eq.6 makes it possible to return to a digitized signal from the fre- quency domain to the time domain. 1 0 12π2π cos N x nx nx fnFre xFim x sen NN N (6) where: rex , imx : (N frequencies into which the signals are decomposed) 0,1,2,,1xN n: (N samples that compose to signals in time) 0,1,2,1,Nn 3) The autospectra and crossed spectrum equations for digitized signs are (Eqs.7-1 6): Signal A Autospectrum: 1 1 lim nd AAndi i i SA nd xAx (7) 1 1 lim nd AA ndiiii i SFreA xFimA xFreA xFimA x nd (8) 2 1 1 lim nd AA ndii i SFreAxF nd 2 imAx (9) Signal B Autospectrum: 1 1 lim nd BBndi i i SB nd xBx (10) 1 1 lim nd BB ndiiii i SFreB xFimB xFreB xFimB x nd (11) 2 1 1 lim nd BB ndii i SFreBxF nd 2 imBx (12) Crossed spectrum between signals A and B: 1 1 lim limnd ABi i i nd nd S nd AxBx (13) 1 1 lim nd AB ndiiii i SFreAxFimAxFreB xFimB x nd (14) 1 1 lim nd ABre ndiiii i SFreAxFreB xFimAxFimBx nd (15) 1 1 lim nd ABim ndiiii i SFreAxFimBx FimAxFreBx nd (16) where: nd = number of segments i x, i = instantaneous spectra of signals A and B in the x frequency Bx i x , i = conjugates from the instantaneous spectra of signals A and B in the x frequency (the conju- gate of a complex number is obtained by reversing the sign of the imaginary part) Bx 4) By applying the Fourier Inverse Transformation to the crossed spectrum of a signal the crossed correlation function is obtained; as expressed in the following Eq.17: 1 0 12π cos 2π N x nx rn Frex NN nx Fim x senN (17) with respect to this correlation function, the only ele- C opyright © 2011 SciRes. JBiSE  M. A. Guevara et al. / J. Biomedical Science and Engineering 4 (2011) 774-787 779 ment is the correlation at time zero for each x frequency; thus n will always be zero. In other words, the only fac- tor of interest is the first place (correlation at time zero) of the correlation function. Thus, the equation is as fol- lows (Eq.18): 1 0 1 0N x rF N rex (18) This simplification was made possible due to n = 0, so: 2π coscos 01.0 nx N 2π00.0 nx Fim x senFim x sen N It is clear that calculating the first place of the correla- tion function does not require the use of the imaginary part of the crossed spectrum. Moreover, if it is supposed that for each x frequency all others are zero (as in an ideal filter, where the signals contain only one fre- quency), then for each x frequency, the correlation func- tion at time zero will be calculated by Eq.19 : 1 rx Frex N (19) where: 1, 2,,2 N (2N frequencies into which the signals are decomposed) (x initiates at one because the “DC” component is not considered) As we know that in the previous equation re x is equal to the real part of the crossed spectrum, Eq.20: 1 1 lim nd ABre ndiiii i rexSFreA xFreBxFimA xFimBx nd (20) Upon considering a single segment (nd = 1, which is possible for the correlation), Eqs.21 and 22 are obtained: 1 ABre rx S N (21) 1 rxFreA x FreBxFimA xFimBx N (22) with these correlation values for each one of the N/2 frequencies, it becomes possible to calculate the correla- tion spectrum for the two signals involved. However, their values are not between –1 and +1, which is the best way of seeing them. To obtain values in the aforemen- tioned range, the values of every must be divided by the square root of the product of place zero of the inverse transformation of the autospectra signals for the same x frequency; i.e., the autocorrelation at time zero of each one of the A and B signals [FacA and facB ]), as indicated in Eq.23 : rx ABre Sx rx acA xfacBx (23) where facA and facB are defined by Eqs.2 4 and 25: 1 0 12π2π cos N x nx nx facAFreA xFimAx sen NN N (24) 1 0 12π2π cos N x nx nx facBFreB xFimB x sen NN N (25) However, considering that the only point of interest is the place zero of the Inverse Transformation (n = 0), then Eqs .2 6 and 27 are developed: 1 0 1N x acAFreA x N (26) 1 0 1N x acBFreB x N (27) Since the autospectra do not contain an imaginary part, and considering a value of zero for all the different fre- quencies of X, then reAx and reBx are equiva- lent to the autospectra of the A and B signals, respect- tively (Eqs.28 and 29): 22 1 1 lim AA nd ndi i i FreA xS FreA xFimA x nd (28) 22 1 1 lim BB nd ndi i i FreB xS FreB xFimB x nd (29) Therefore, for one segment (nd = 1), Eqs.30 and 31 re developed: a C opyright © 2011 SciRes. JBiSE  M. A. Guevara et al. / J. Biomedical Science and Engineering 4 (2011) 774-787 780 1 acAFreAxFreAx FimAxFimAx N (30) 1 acBFreBxFreBx FimBxFimBx N (31) Upon substituting Eqs.20, 30 and 31 in number 32, we obtain: FreAxFreBx FimAxFimBx rx reAx FreAxFimAxFimAxFreB xFreB xFimB xFimB x (32) In this way, it is possible to calculate the correlation spectrum (correlation values for every frequency into which the signal is decomposed) between two cerebral areas. 3. DESCRIPTION OF THE PROGRAM EEGcorco is a flexible program since it works with EEG signals transformed to ASCII format. The most com- mercial computer programs designed to acquire EEG signals (i.e. Neuroscan Scan IV, Grass Technology PolyVIEW or Medicit Track Waker) allow exporting their data to ASCII format. Use of the EEGcorco program is very simple. It re- quires a text file (“file of names”) which contains the name of the data files in every line (also in text format). Each data file contains only one datum per line. All sig- nals provided to the program must first be examined in order to eliminate all segments contaminated with arti- facts. Parametric Statistical Tests Before executing the program, it is necessary to know precisely which statistical design is suitable for the data that is to be analyzed. EEGcorco compares the correla- tion or coherence values among groups using the next parametrical statistical test: correlated and uncorrelated Student’s t, correlated and uncorrelated ANOVA of one and two factors, and Split-plot ANOVA of two factors). Besides, when ANOVAs tests are realized, the program calculates automatically Duncan and Tukey’s post hoc test. In Figure 4 , different designs in which the data can be arranged are represented graphically; in each design Figure 4. Schematic representation of different statistical designs that can be applied by means of the EEGcorco program. In each esign is indicated the statistical test used. d C opyright © 2011 SciRes. JBiSE  M. A. Guevara et al. / J. Biomedical Science and Engineering 4 (2011) 774-787 781 is presented the parametrical statistical test used. It is important to clarify that in all those designs it is indispensable that the number of subjects in every cell be the same (i.e., no mismatches are allowed). As Fig- ure 4 shows, cells are numbered in sequential order from left-to-right and from top-down. Each signal (registered channel) must be in an individual file (in text format, with a specific name). The names of the individual files will then be arranged in a main file in ASCII format, which we call the “file of names”. In this file, the indi- vidual files will be arranged following the order of the cells. Figure 5 exemplifies a “file of names” that contains data from a two-factor mixed design (2 × 2). First, the names of the files that constitute the first cell (group 1 in the first condition) appear, followed by cell 2 (group 1 in the second condition), cell 3 (group 2 in the first condition) and, finally, cell 4 (group 2 in the second condition). It is important to clarify that EEGcorco does not func- tion if any files are missing; that is, it is necessary to have all the files for all subjects (and all must appear in the “file of names”). EEGcorco transforms the coherence and correlation data to Z of Fisher values for the purpose of bringing them over, as far as possible, to a normal distribution (a requirement to permit the application of parametric sta- tistics) [45]. When the program is executed, an initial screen ap- pears in which the user must provide the parameters for program execution. Figure 6 shows an initial screen in which those parameters have been filled in. The user must indicate if there are 2 or 4 channels (in other words, if 2 or 4 derivations will be analyzed); the level number of the factors to be considered (for the statistics); if sam- pling was done at 256, 512 or 1024 Hz (the only sam- pling rates allowed); if the point number for each seg- ment is 256, 512 or 1024 (the only segment durations allowed by the program); and must always respect the condition that each segment have a duration of at least one second. By default, the program determines the lim- its of the EEG bands to: band 1, from 1 to 3 Hz; band 2, from 4 to 7 Hz; band 3, from 8 to 10 Hz; band 4, from 11 to 13 Hz; band 5, from 14 to 19 Hz; band 6, from 20 to 30 Hz; and, band 7, from 31 to 50 Hz. Nevertheless, in the initial screen the user can modify the limits of the first six bands of analysis (but the limits of band 7 can- not be modified). If the user works with correlated or mixed designs, it is possible to choose to subtract the first cell from the other ones, since it is considered to be the baseline. 4. PROGRAM PERFORMANCE When the user presses the “Start the analysis” button, the Figure 5. The order in which the file names must be arranged in the “file of names” assigned to the EEGcorco pro- gram. Subjects 01, 21, 22 and 24 belong to the first group, while subjects 09, 10, 12 and 14 belong to the second one. Each group was recorded in 2 condi- tions, HABA and HAHA (hence, there are 4 cells). Also, each subject was re- corded in 4 regions (derivations): F3, F4, P3 and P4. The extension of the files is N10 (but can be of any length). program initiates calculations and then the result files of Table 1 are obtained. All these files are in text format C opyright © 2011 SciRes. JBiSE  M. A. Guevara et al. / J. Biomedical Science and Engineering 4 (2011) 774-787 782 Figure 6. In this example of an initial screen, the user has indicated to the program that there are 4 channels, which are segments signals divided into 512 points and were sampled at a rate of 512 Hz. The decision was taken to join the 7 bands in the pre-established limits without subtracting the first cell. This is a mixed 2 × 2 design (4 cells). The “file of names” is EEGcorco.DIR. and they are arranged in matrices form (columns and rows) which do them easy to process in programs as excel or SPSS. As can be seen in Table 1, there are 20 exit files; all of which contain the name indicated at “file of names”, though their terminations (the last 3 characters) are dif- ferent. The ERR file contains the interhemispherical cor- relation spectrum for each frequency (from 1 to 30 Hz); ERH has the interhemispherical coherence spectrum for these frequencies; the EZR and EZH files contain, re- spectively, the interhemispherical correlation spectrum and interhemispherical coherence spectrum for each frequency transformed to Z of Fisher. TER has the in- terhemispherical correlation spectrum of the 7 bands with both transformed and non-transformed data; TEH con- tains the equivalent coherence spectrum. ARR and ARH contain the intrahemispherical spectra (1 to 30 Hz) of correlation and coherence for each frequency (in the anterior and posterior areas of the same hemisphere); AZR and AZH contain the respective correlation and coherence spectra transformed to Z of Fisher. TRR and TRH show the correlation and coherence intrahemi- spherical spectra grouped in the 7 bands considered. Each file contains both transformed and non-transformed values. Table 1. Names of EEGcorco’s exit files. Files ending in R contain the names of the correlation files, while those ending in H show the names of the coherence files. The rest of files con- tain both correlation and coherence. 1, 2 EEGcorco.ERR EEGcorco.ERH 3, 4 EEGcorco.EZR EEGcorco.EZH 5, 6 EEGcorco.TER EEGcorco.TEH 7, 8 EEGcorco.ARR EEGcorco.ARH 9, 10 EEGcorco.AZR EEGcorco.AZH 11, 12 EEGcorco.TRR EEGcorco.TRH 13, 14 EEGcorco.RES EEGcorco.RET 15, 16 EEGcorco.AVA EEGcorco.AVT 17, 18 EEGcorco.TES EEGcorco.TET 19, 20 EEGcorco.TUK EEGcorco.TUT The RES file contains the results of all the calculated spectra, both for frequency and bands, without trans- forming, while RET contains the transformed values. Figure 7 shows the results of applying divided plots variance analysis to each variable (columns) contained C opyright © 2011 SciRes. JBiSE  M. A. Guevara et al. / J. Biomedical Science and Engineering 4 (2011) 774-787 783 Figure 7. Part of the AVA and AVT result files, in which the correlation and coherence spectra were calculated from 4 channels employing a 2 × 2 mixed statistical design. The columns present the sig- nificant values for factor A [p (FA)], factor B [p (FB)], and A × B interaction [p (FAB)]. in the RES and RET result files. The tests that turned out to be significant (p < 0.05) for the AVA and AVT files are indicated by an asterisk When the statistical design contains only 2 cells, the Student’s t test for independent or correlated groups should be applied. Figure 8 shows part of the result files: TES (for non-transformed data) and TET (for trans- formed data), obtained upon applying the Student’s t test to cells that contain independent groups. If the user applies variance analysis, then EEGcorco will bring both the TUK files (for non-transformed data) and TUT (for transformed data). These contain the comparisons among cells, using both the Duncan and Tukey tests, in order to determine the significant differ- ences among groups (or among conditions). 5. HARDWARE AND SOFTWARE SPECIFICATIONS EEGcorco has been written in Delphi and will run in the Windows environment in any PC-compatible computer that has at least a Pentium processor and 512 Mb of RAM memory (though program performance improves with more RAM). The program requires little space on the hard disk because both the signals to be analyzed and the exit files are in text format (ASCII) and thus occupy only a small amount of disk space. Memory require- ments or limitations are determined by the amount of data to be processed. The program requires that the signals be digitized (discreet in amplitude and time) from analog signals (continuous in amplitude and time); hence, it is neces- sary to take “N” points (samples) that are spread equally over time for every signal segment. Another requirement is that several of the segments that represent the condi- tions of interest be taken. 6. LESSONS LEARNED AND AVAILABILITY In the present article, we have presented the computa- ional program EEGcorco, which offers an easy and novel t C opyright © 2011 SciRes. JBiSE  M. A. Guevara et al. / J. Biomedical Science and Engineering 4 (2011) 774-787 784 Figure 8. Parts of both the TES and TET results files. A comparison has been made among the cells where the Student’s t test was applied for independent groups. way to obtain complex quantitative analyses of EEG synchronization. This program allows one to calculate, in a fast and simultaneous manner, the correlation and coherence spectra of EEG signals, as well as their re- spective statistical parametric analyses. The calculation of correlation and coherence spectra can be obtained for both narrow and broad bands in a very short time by applying several parametric statistical tests. Dissimilarly to the most commercial programs de- signed to analyze the EEG, EEGcorco allows extracts the coherence and correlation. This last analysis has many advantages on coherence, since it is sensitive to both phase and polarity, regardless of amplitude. The coherence not provide direct information as to the true relationship between two signals and it only reflects the stability of this relationship with respect to power asymmetry and the phase relationship, For these reasons, when interest focuses on waveform and time coupling between two brain regions, correlation is a better choice than coherence. The main contribution of EEGcorco is that it allows simultaneous inter- and intrahemispheric correlation and coherence spectra calculations, and the application of adequate parametric statistical analyses for which, to our knowledge, there are no commercially available pro- grams. EEGcorco offers numerous advantages: it runs on any PC, requires no complex equipment, and its output files take up little memory space on the hard disk. The versa- tility and flexibility of this program make it easily adaptable to diverse experimental and clinical needs. Moreover, the fact that EEGcorco can also be easily adapted to portable computers means that it can solve the problems that may arise when analyzing signals in locations outside the laboratory; for example, in hospi- tals or schools. EEGcorco has been used for our work group as well as for other researchers in both, basical and clinical studies. For example, in a previous study we demon- strate that the functional coupling between the prefrontal and parietal cortices shows a characteristic pattern, spe- cific to each age group (male children, teenagers and young adults) during performance of the Hanoi task, which is neuropsychological test widely used to evaluate C opyright © 2011 SciRes. JBiSE  M. A. Guevara et al. / J. Biomedical Science and Engineering 4 (2011) 774-787 785 executive functions as planning [46]. In other studies, we found that alcohol decreases the correlation between frontal and parietal areas in humans, and between sub- cortical structures in rats [47,48]. Although in those in- vestigations only the correlation analysis was used, in futures studies we will use and compare both correlation and coherence analysis in clinical populations, particu- larly female adolescents with posttraumatic stress disor- der and children abused. Finally, we believed that the analysis exposed in the present paper could be useful in clinical practice since the coupling between cortical ar- eas could predict the cognitive functioning in neurode- generative states as Alzheimer disease [49,50]. Although EEGcorco offers several advantages, it has some limitations. One very important condition is that the data of the different derivations and conditions of each subject must be very well organized in their respec- tive files; but, if this condition is followed adequately, the program will run the statistical test (s) required with no problem. Another limitation of this program is the impossibility of analyzing more than four derivations simultaneously. Nevertheless, for studies that require more than four derivations, the program can be run sev- eral times, until all the comparisons of interest have been carried out. This program was created in order to answer specific questions about functional similitude among two or four brain regions. EEGcorco is available upon request. REFERENCES [1] Lopes Da Silva, F.H. and Van Rotterdam, A. (1999) Bio- physical aspects of EEG and Megnetoencephalogram generation. In: Niedermeyer, E. and Lopes Da Silva, F.H. Eds., Electroencephalography: Basic principles, clinical applications and related fields, Lippicott Williams & Wlikins, Baltimore, 93-109. [2] Andreassi, J.L. (2000) Psychophysiology: Human beha- vior & physiological response. 4th Editon, Lawrence Erl- baum Associates Publishers, Mahwah. [3] Fernández-Harmony, T. and González-Garrido, A. (2001) EEG y cognición. In: Alcaraz-Romero, V. M. and Gumá- Díaz, E. Eds., Texto de Neurociencias Cognitivas, Ma- nual Moderno, Mexico City, 351-369. [4] Guevara, M.A. and Corsi-Cabrera, M. (1996) EEG co- herence or EEG correlation? International Journal of Psy- chophysiology, 23, 145-153. doi:10.1016/S0167-8760(96)00038-4 [5] Bendat, J.S. (1989) Engineering Applications of Correla- tion and Spectral Analysis. John Wiley & Sons, USA. [6] Pearson, K. and Lee, A. (1903) On the laws of inheri- tance in man: I. Inheritance of physical characters. Bio- metrika, 2, 357-462. [7] Cooley, J.W. and Tukey J. W. (1965) An algorithm for the machine calculation of complex fourier series. Mathe- matics of Computation, 19, 297-301. doi:10.1090/S0025-5718-1965-0178586-1 [8] Guilford, J.P. and Fruchter, B. (1984) Estadística aplicada a la Psicología y la educación. McGraw-Hill, Mexico City. [9] Brazier, M.A. and Casby, J.U. (1952) Cross-correlation and autocorrelation studies of electroencephalographic poten- tials. Electroencephalography and Clinical Neurophysio- logy, 4, 201-211. doi:10.1016/0013-4694(52)90010-2 [10] French, C.C. and Beaumont, J.G. (1984) A critical review of EEG coherence studies of hemisphere function. Inter- national Journal of Psychophysiology, 1, 241-254. doi:10.1016/0167-8760(84)90044-8 [11] Grindel, O.M. (1965) The significance of correlation analysis for evaluation of the EEG in man Mathematical analysis of the electrical activity of the brain. Harvard University Press, Cambridge. [12] Thatcher, R.W. and Walker, R.A. (1980) EEG coherence and intelligence in children. Electroencephalography & Clinical Neurophysiology, 49, S161. [13] Shaw, J.C. (1981) An introduction to the coherence func- tion and its use in EEG signal analysis. Journal of Medi- cal Engineering & Technology, 6, 279-288. doi:10.3109/03091908109009362 [14] Corsi-Cabrera, M., Guevara, M.A., Arce, C. and Ramos, J. (1996) Inter and intrahemispheric EEG correlation as a function of sleep cycles. Progress in Neuropsychophar- macology and Biological Psychiatry, 20, 387-405. doi:10.1016/0278-5846(96)00004-8 [15] Corsi-Cabrera, M., Munoz-Torres, Z., del Rio-Portilla, Y. and Guevara, M.A. (2006) Power and coherent oscilla- tions distinguish REM sleep, stage 1 and wakefulness. International Journal of Psychophysiology, 60, 59-66. doi:10.1016/j.ijpsycho.2005.05.004 [16] Kobayashi, T., Madokoro, S., Misaki, K., Murayama, J., Nakagawa, H. and Wada, Y. (2002) Interhemispheric dif- ferences of the correlation dimension in a human sleep electroencephalogram. Psychiatry and Clinical Neurosci- ences, 56, 265-266. doi:10.1046/j.1440-1819.2002.01020.x [17] Perez-Garci, E., del-Rio-Portilla, Y., Guevara, M.A., Arce, C. and Corsi-Cabrera, M. (2001) Paradoxical sleep is cha- racterized by uncoupled gamma activity between fron- tal and perceptual cortical regions. Sleep, 24, 118-126. [18] Ramanand, P., Bruce, M.C. and Bruce, E.N. (2010) Mu- tual information analysis of EEG signals indicates age- related changes in cortical interdependence during sleep in middle-aged versus elderly women. Journal of Clini- cal Neurophysiology, 27, 274-284. doi:10.1097/WNP.0b013e3181eaa9f5 [19] Corsi-Cabrera, M., Arce, C., Ramos, J., and Guevara, M.A. (1997) Effect of spatial ability and sex on inter- and intrahemispheric correlation of EEG activity. Electroen- cephalography and Clinical Neurophysiology, 102, 5-11. doi:10.1016/S0013-4694(96)96091-5 [20] Corsi-Cabrera, M., Gutiérrez, S., Ramos, J. and Arce, C. (1988) Interhemispheric correlation of EEG activity dur- ing successful and unsuccessful cognitive performance. International Journal of Neuroscience, 39, 253-259. doi:10.3109/00207458808985712 [21] Portella, C.E., Silva, J.G., Machado, S., Velasques, B., Bas- tos, V.H., Ferreira-Vorkapic, C., Terra, P., Lopes, V., Cagy, M., Carvalho, E., Orsini, M., Basile, L., Piedade, R. and Ribeiro, P. (2007) EEG spectral coherence inter- and in- trahemispheric during catching object fall task. Arquivos C opyright © 2011 SciRes. JBiSE  M. A. Guevara et al. / J. Biomedical Science and Engineering 4 (2011) 774-787 786 de Neuro-psiquiatria, 65, 63-67. doi:10.1590/S0004-282X2007000100014 [22] Ramos, J., Corsi-Cabrera, M., Guevara, M.A. and Arce, C. (1993) EEG activity during cognitive performance in women. International Journal of Neuroscience, 69, 185- 195. doi:10.3109/00207459309003329 [23] Razumnikova, O.M. and Larina, E.N. (2005) Hemi- spheric interactions during a search of original verbal associations: EEG coherence in creative men and women. Zhurnal Vyssheĭ Nervoĭ Deiatelnosti Imeni I P Pavlova, 55, 777-787. [24] Serrien, D.J. (2008) Coordination constraints during bi- manual versus unimanual performance conditions. Neuro- psychologia, 46, 419-425. doi:10.1016/j.neuropsychologia.2007.08.011 [25] Serrien, D.J. (2009) Verbal-manual interactions during dual task performance: An EEG study. Neuropsychologia, 47, 139-144. doi:10.1016/j.neuropsychologia.2008.08.004 [26] Grindel, O.M., Koptelov, M., Masherov, Iu, E. L. and Pronin, I.N. (1998) Foci of pathological activity in the human brain and their influence on the spatial-temporal relationships of the EEG. Zhurnal Vyssheĭ Nervoĭ Dei- atelnosti Imeni I P Pavlova, 48, 671-686. [27] Cespedes-Garcia, Y., González-Hernández, J.A., García-Fi- dalgo, J., Begueria-Santos, R.A. and Figueredo-Rodríguez. P. (2003) Interictal EEG coherence in patients with par- tial temporal lobe epilepsy. Revista de Neurología, 37, 1107-1111. [28] Cerdan, L.F., Guevara, M.A., Sanz, A., Amezcua, C. and Ramos-Loyo, J. (2005) Brain electrical activity changes in treatment refractory schizophrenics after olanzapine treatment. International Journal of Psychophysiology, 56, 237-247. doi:10.1016/j.ijpsycho.2004.12.008 [29] Higashima, M., Takeda, T., Kikuchi, M., Nagasawa, T. and Koshino, Y. (2006) Functional connectivity between hemispheres and schizophrenic symptoms: a longitudinal study of interhemispheric EEG coherence in patients with acute exacerbations of schizophrenia. Clinical EEG and Neurosciences, 37, 10-15. [30] Wada, Y., Nanbu, Z., Jiang, Y., Koshino, Y. and Hashi- moto, T. (1998) Interhemispheric EEG coherence in ne- ver-medicated patients with paranoid schizophrenia: Ana- lysis at rest and during photic stimulation. Clinical EEG (Electroencephalography), 29, 170-176. [31] Lazar, A. S., Lazar, Z. I., Biro, A., Gyori, M., Tarnok, Z., Prekop, C., Keszei, A, Stefanik, K., Gadoros, J., Halasz, P. and Bodizs, R. (2010) Reduced fronto-cortical brain connectivity during NREM sleep in Asperger syndrome: An EEG spectral and phase coherence study. Clinical Neu- rophysiology, 121, 1844-1854. doi:10.1016/j.clinph.2010.03.054 [32] Leveille, C., Barbeau, E.B., Bolduc, C., Limoges, E., Ber- thiaume, C., Chevrier, E., Mottron, L. and Godbout, R. (2010) Enhanced connectivity between visual cortex and other regions of the brain in autism: A REM sleep EEG coherence study. Autism Research, 3, 280-285. doi:10.1002/aur.155 [33] Adler, G., Brassen, S. and Jajcevic, A. (2003) EEG co- herence in Alzheimer’s dementia. Journal of Neural Tran- smission, 110, 1051-1058. doi:10.1007/s00702-003-0024-8 [34] Pogarell, O., Teipel, S. J., Juckel, G., Gootjes, L., Moller, T., Burger, K., Leinsinger, G., Moller, H.J., Hegerl, U. and Hampel, H. (2005) EEG coherence reflects regional corpus callosum area in Alzheimer’s disease. Journal of Neurology, Neurosurgery and Psychiatry, 76, 109-111. doi:10.1136/jnnp.2004.036566 [35] Abdullah, H., Maddage, N.C., Cosic, I. and Cvetkovic, D. (2010) Cross-correlation of EEG frequency bands and heart rate variability for sleep apnoea classification. Me- dical and Biological Engineering and Computing, 48, 1261- 1269. doi:10.1007/s11517-010-0696-9 [36] Abeyratne, U.R., Swarnkar, V., Rathnayake, S.I. and Hu- kins, C. (2007) Sleep-stage and event dependency of brain asynchrony as manifested through surface EEG. Conference Proceedings: Annual International Confer- ence of the IEEE Engineering in Medicine and Biology Society, Lyon, 22-26 August 2007, 709-712. [37] Aksahin, M., Aydin, S., Firat, H., and Erogul, O. (2010). Artificial apnea classification with quantitative sleep EEG synchronization. Journal of Medical Systems, 1-6. [38] Bryzgalov, A.O. and Vol’f, N.V. (2006) Gender-related differences in EEG coherence in Stroop task. Zhurnal Vy- ssheĭ Nervoĭ Deiatelnosti Imeni I P Pavlova, 56, 464-471. [39] Corsi-Cabrera, M., Ramos, J., Guevara, M.A., Arce, C. and Gutierrez, S. (1993) Gender differences in the EEG during cognitive activity. International Journal of Neu- roscience, 72, 257-264. doi:10.3109/00207459309024114 [40] Razumnikova, O.M. (2004) Gender differences in hemi- spheric organization during divergent thinking: an EEG investigation in human subjects. Neuroscience Letters, 362, 193-195. doi:10.1016/j.neulet.2004.02.066 [41] Vol’f, N.V., and Razumnikova, O.M. (2001) Dynamics of interhemispheric asymmetry during perception of verbal information in men and women: EEG analysis. Zhurnal Vyssheĭ Nervoĭ Deiatelnosti Imeni I P Pavlova, 51, 310- 314. [42] Grieve, P.G., Emerson, R.G., Fifer, W.P., Isler, J.R. and Stark, R.I. (2003) Spatial correlation of the infant and adult electroencephalogram. Clinical Neurophysiology, 114, 1594-1608. doi:10.1016/S1388-2457(03)00122-6 [43] Maurits, N.M., Scheeringa, R., van der Hoeven, J.H. and de Jong, R. (2006) EEG coherence obtained from an auditory oddball task increases with age. Journal of Cli- nical Neurophysiology, 23, 395-403. doi:10.1097/01.wnp.0000219410.97922.4e [44] Tarokh, L., Carskadon, M.A. and Achermann, P. (2010) Developmental changes in brain connectivity assessed using the sleep EEG. Neuroscience, 171, 622-634. doi:10.1016/j.neuroscience.2010.08.071 [45] Sánchez-Bruno, A., Borges del Rosal, A. (2005) Trans- formación Z de Fisher para la determinación de in- tervalos de confianza del coeficiente de correlación de pearson. Psic othema, 17, 148-153. [46] Guevara, M. A., Rizo-Martínez, L. E., Robles-Aguirre, F. A., Hernández-González, M. (in press) Prefrontal-parie- tal correlation during performance of the towers of Hanoi task in male children, adolescents and young adults. De- velopmental Cognitive Neuroscience. [47] Sanz-Martin, A., Guevara, M. A., Amezcua, C., Santana, G. and Hernández-González, M. (2011) Effects of red wine on the electrical activity and functional coupling C opyright © 2011 SciRes. JBiSE  M. A. Guevara et al. / J. Biomedical Science and Engineering 4 (2011) 774-787 Copyright © 2011 SciRes. 787 JBiSE between the prefrontal-parietal cortices in young men. Appetite, 57, 84-93. doi:10.1016/j.appet.2011.04.004 [48] Hernández-González, M., Martínez-Pelayo, M., Arteaga- Silva, M., Bonilla-Jaime, H., Guevara, M. A. (2008) Eth- anol changes the electroencephalographic correlation of the ventral tegmental area and nucleus accumbens, com- ponents of the mesoaccumbens system in rats. Pharma- cology, Biochemistry and Behavior, 92, 124-130. [49] Besthorn, C., Förstl, H., Geiger-Kabisch, C., Sattel, H., Gasser, T. and Schreiter-Gasser, U. (1994) EEG coher- ence in Alzheimer disease. Electroencephalography and Clinical Neurophysiology, 90, 242-245. doi:10.1016/0013-4694(94)90095-7 [50] Locatelli, T., Cursi, M., Liberati, D., Franceschi, M., Comi, G. (1998) EEG coherence in Alzheimer´s disease. Elec- troencephalography and Clinical Neurophysiology, 106, 229-237. doi:10.1016/S0013-4694(97)00129-6
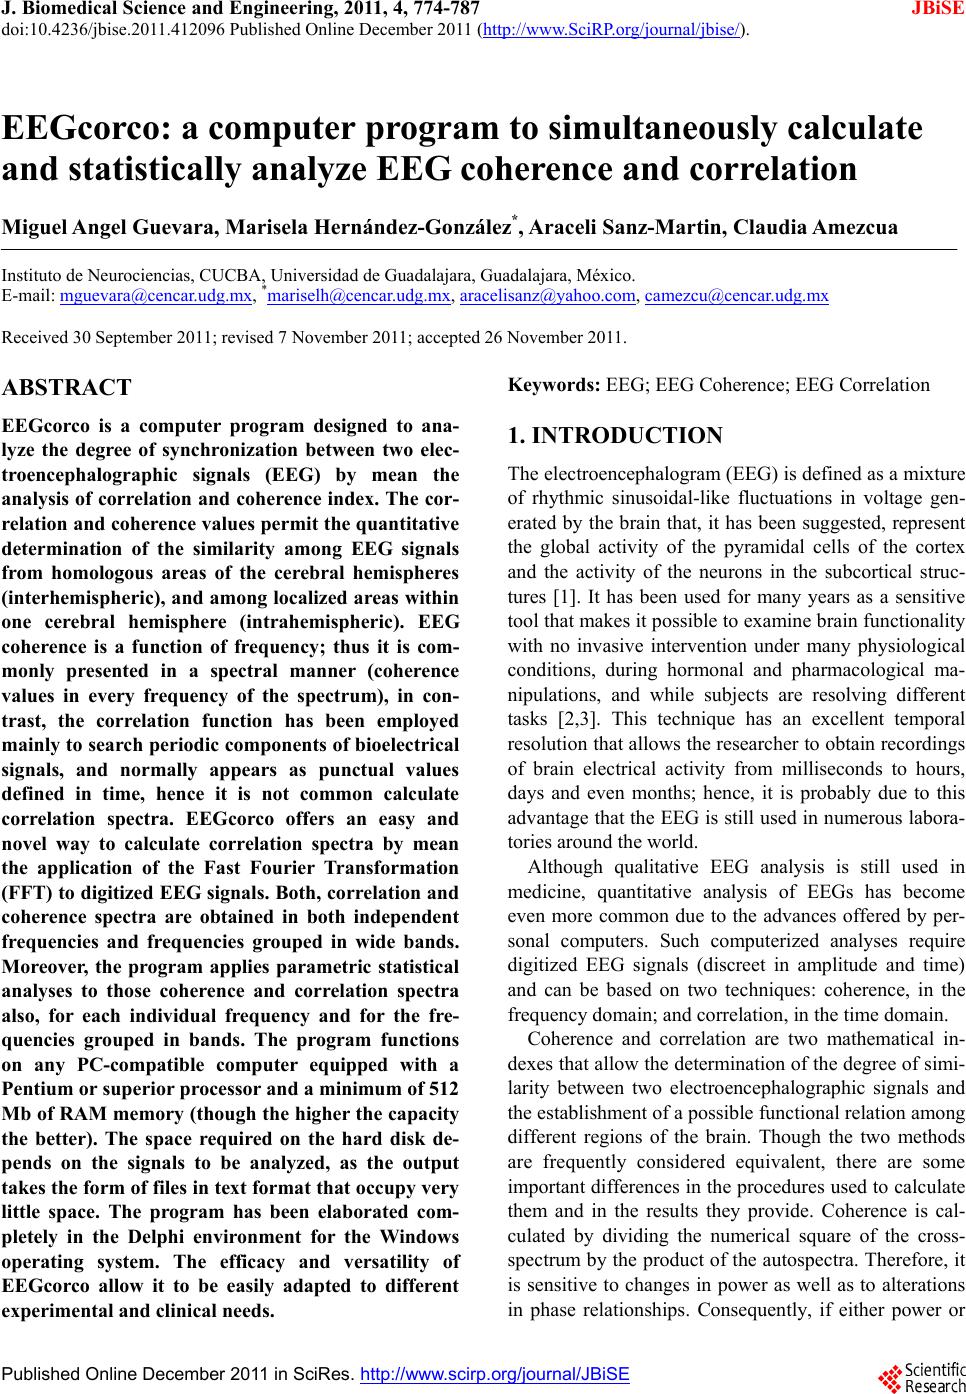
|