 Natural Resources, 2011, 2, 224-233 doi:10.4236/nr.2011.24028 Published Online December 2011 (http://www.SciRP.org/journal/nr) Copyright © 2011 SciRes. NR Two-Stage Dilute Acid Hydrolysis of Dairy Manure for Nutrient Release, Solids Reduction and Reducing Sugar Production S. K. Yawson, P. H. Liao, K. V. Lo* Department of Civil Engineering, University of British Columbia, Vancouver, Canada. Email: *kvlo@civil.ubc.ca Received July 30th, 2011; revised August 15th, 2011; accepted August 22nd, 2011. ABSTRACT The microwave enhanced advanced oxidation process (MW/H2O2-AOP) aided with dilute sulfuric acid was applied in a two-stage treatment of dairy manure for nutrient release, solids reduction, and reducing sugar production. A much higher hydrogen peroxide dosage (1.2 g H2O2/g TS) was used in Stage 2 than that in Stage 1 (0.38 g H2O2/g TS). Most of the reducing sugar was produced in Stage 1, and only a small amount produced in Stage 2. The highest reducing sugar yield of 15.5% was obtained at 160˚C, 0 mL H2O2, and 20 min of heating time. With a high hydrogen peroxide dosage and a higher operating temperature of 160˚C in Stage 2, the nutrient release conversion rate was much higher in Stage 2 than Stage 1. All of total phosphorus was converted to orthophosphate, and a very high ammonia concentration was ob- tained in the treated solution. The results indicated that th e MW/H2O2-AOP operated under the reducing process (with- out hydrogen peroxide) provided the best yield of reducing sugar; however, when operated under an oxidative process (with hydrogen peroxide), it favoured nutrient release and solid s disintegratio n. The concentra tion of tota l chemical oxi- dation demand (TCOD) in the treated solution decreased with an increase of temperature, hydrogen peroxide dosage and heating time. Soluble chemical oxidation demand (SCOD) concentration decreased with a very high hydrogen per- oxide dosage. Volatile fatty acids (VFA) concentration decreased with an increase of hydrogen peroxide dosage. Ammo- nia and orthop hosp hat e co ncentrations increased w i t h an i n crease of t emp erat ure an d hydrogen peroxid e dosage. Keywords: Microwave, Advanced Oxidation, Solids Destruction, Reducing Sugar Generation, Nutrient Solubilization 1. Introduction Dairy manure contains fats, proteins, lignin, carbohydra- tes and inorganic residue, and is rich in a variety of nu- trients including nitrogen, phosphorus, and minerals. It is a bio-resource, which can be converted into valuable pro- ducts, instead of a waste material to be disposed. Carbo- naceous matters in dairy manure can be utilized for eth- anol, methane and bio-fuel conversion, while nutrients and metals, such as phosphorus, nitrogen, and potassium can be used for struvite production. Lignocellulosic com- ponents from dairy manure can be transformed into fer- mentable saccharides via enzyme, or acid hydrolysis, which can further be converted into ethanol and other valuable products [1]. Lignocellulosic biomass is natu- rally resistant to breakdown; a pretreatment step, such as the acid hydrolysis is needed for breaking lignin seal and disrupting crystalline structure of cellulose [2,3]. Acid hydrolysis can be achieved with various combi- nations of acid concentration and operating temperature in a one-stage or a two-stage process. Dilute acid hydro- lysis is the most commonly applied process. It is used either as a pretreatment of lignocellulose for subsequent enzyme hydrolysis or as the actual hydrolysis to produce fermentable sugar. In a one-stage acid hydrolysis, acid breaks the matrix structure of the fiber, and polysaccha- rides are converted into mono sugars [4]. In a two-stage process, dilute acid is used in general in the first stage to solubilize the hemicelluloses, and to reduce cellulose crystallinity. This would effectively remove pentosans prior to the main hydrolysis of cellulose. Concentrated acid (12.5% to 75% of sulfuric acid concentration) is then used to hydrolyze cellulosic materials to produce mainly glucose in the second-stage process [5]. More sugars can be produced from dairy manure in a two-stage hydrolysis than that from a one-st age hydrolysis procedure [6]. 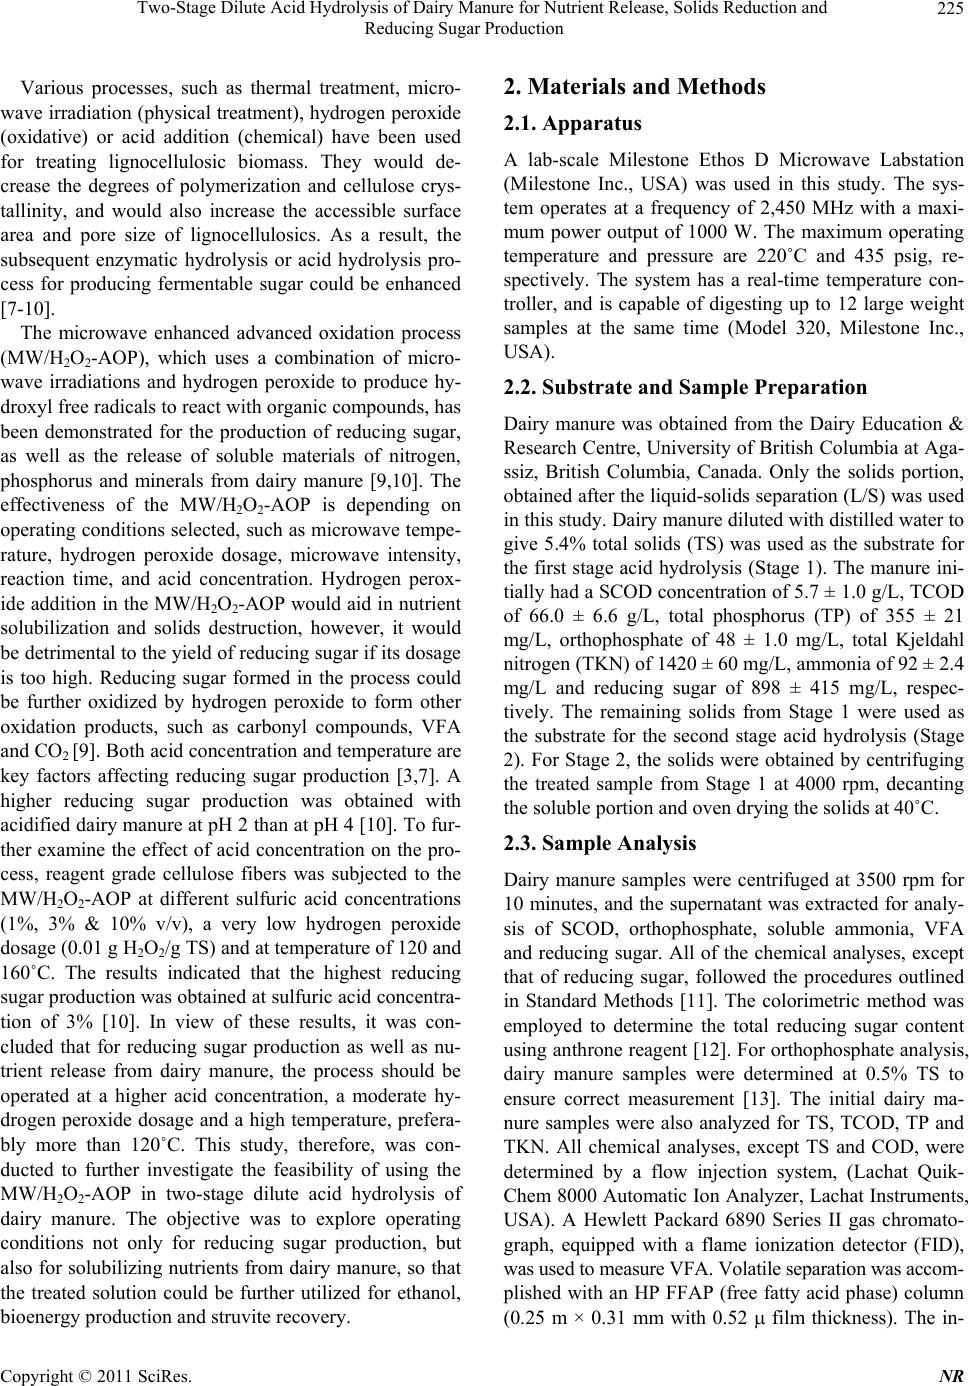 Two-Stage Dilute Acid Hydrolysis of Dairy Manure for Nutrient Release, Solids Reduction and 225 Reducing Sugar Production Various processes, such as thermal treatment, micro- wave irradiation (physical treatment), hydrogen peroxide (oxidative) or acid addition (chemical) have been used for treating lignocellulosic biomass. They would de- crease the degrees of polymerization and cellulose crys- tallinity, and would also increase the accessible surface area and pore size of lignocellulosics. As a result, the subsequent enzymatic hydrolysis or acid hydrolysis pro- cess for producing fermentable sugar could be enhanced [7-10]. The microwave enhanced advanced oxidation process (MW/H2O2-AOP), which uses a combination of micro- wave irradiations and hydrogen peroxide to produce hy- droxyl free radicals to react with organic compounds, has been demonstrated for the production of reducing sugar, as well as the release of soluble materials of nitrogen, phosphorus and minerals from dairy manure [9,10]. The effectiveness of the MW/H2O2-AOP is depending on operating conditions selected, such as microwave tempe- rature, hydrogen peroxide dosage, microwave intensity, reaction time, and acid concentration. Hydrogen perox- ide addition in the MW/H2O2-AOP would aid in nutrient solubilization and solids destruction, however, it would be detrimental to the yield o f reducing sug ar if its dosage is too high. Reducing sugar formed in the process could be further oxidized by hydrogen peroxide to form other oxidation products, such as carbonyl compounds, VFA and CO2 [9]. Bo th acid concen tration and temperature are key factors affecting reducing sugar production [3,7]. A higher reducing sugar production was obtained with acidified dairy manure at pH 2 than at pH 4 [10]. To fur- ther examine the effect of acid concentration on the pro- cess, reagent grade cellulose fibers was subjected to the MW/H 2O2-AOP at different sulfuric acid concentrations (1%, 3% & 10% v/v), a very low hydrogen peroxide dosage (0.01 g H2O2/g TS) and at temperature of 120 and 160˚C. The results indicated that the highest reducing sugar production was obtain ed at sulfu ric acid con centra- tion of 3% [10]. In view of these results, it was con- cluded that for reducing sugar production as well as nu- trient release from dairy manure, the process should be operated at a higher acid concentration, a moderate hy- drogen peroxide dosage and a high temperature, prefera- bly more than 120˚C. This study, therefore, was con- ducted to further investigate the feasibility of using the MW/H 2O2-AOP in two-stage dilute acid hydrolysis of dairy manure. The objective was to explore operating conditions not only for reducing sugar production, but also for solubilizin g nutrients from dairy manure, so that the treated solution could be further utilized for ethanol, bioenergy pr oduction and struvi t e recovery. 2. Materials and Methods 2.1. Apparatus A lab-scale Milestone Ethos D Microwave Labstation (Milestone Inc., USA) was used in this study. The sys- tem operates at a frequency of 2,450 MHz with a maxi- mum power output of 1000 W. The maximum operating temperature and pressure are 220˚C and 435 psig, re- spectively. The system has a real-time temperature con- troller, and is capable of digesting up to 12 large weight samples at the same time (Model 320, Milestone Inc., USA). 2.2. Substrate and Sample Preparation Dairy manure was obtained from the Dairy Education & Research Centre, University of British Columbia at Aga- ssiz, British Columbia, Canada. Only the solids portion, obtained after the liquid-solids separation (L/S) was used in this study. Dairy manure diluted with distilled water to give 5.4% total solids (TS) was used as the substrate for the first stage acid hydrolysis (Stage 1). The manure ini- tially had a SCOD concentration of 5.7 ± 1.0 g/L, TCOD of 66.0 ± 6.6 g/L, total phosphorus (TP) of 355 ± 21 mg/L, orthophosphate of 48 ± 1.0 mg/L, total Kjeldahl nitrogen (TKN) of 1420 ± 60 mg/L, ammonia o f 92 ± 2.4 mg/L and reducing sugar of 898 ± 415 mg/L, respec- tively. The remaining solids from Stage 1 were used as the substrate for the second stage acid hydrolysis (Stage 2). For Stage 2, the solids were obtained by centrifuging the treated sample from Stage 1 at 4000 rpm, decanting the soluble portion and oven drying the solids at 40˚C. 2.3. Sample Analysis Dairy manure samples were centrifuged at 3500 rpm for 10 minutes, and the supernatant was extracted for analy- sis of SCOD, orthophosphate, soluble ammonia, VFA and reducing sugar. All of the chemical analyses, except that of reducing sugar, followed the procedures outlined in Standard Methods [11]. The colorimetric method was employed to determine the total reducing sugar content using anthrone reagent [12]. For orthophosphate analysis, dairy manure samples were determined at 0.5% TS to ensure correct measurement [13]. The initial dairy ma- nure samples were also analyzed for TS, TCOD, TP and TKN. All chemical analyses, except TS and COD, were determined by a flow injection system, (Lachat Quik- Chem 8000 Automatic Ion Analyzer, La chat Instrumen ts, USA). A Hewlett Packard 6890 Series II gas chromato- graph, equipped with a flame ionization detector (FID), was used to measure VFA. Volatile separation was accom- plished with an HP FFAP (free fatty acid phase) column (0.25 m × 0.31 mm with 0.52 film thickness). The in- Copyright © 2011 SciRes. NR 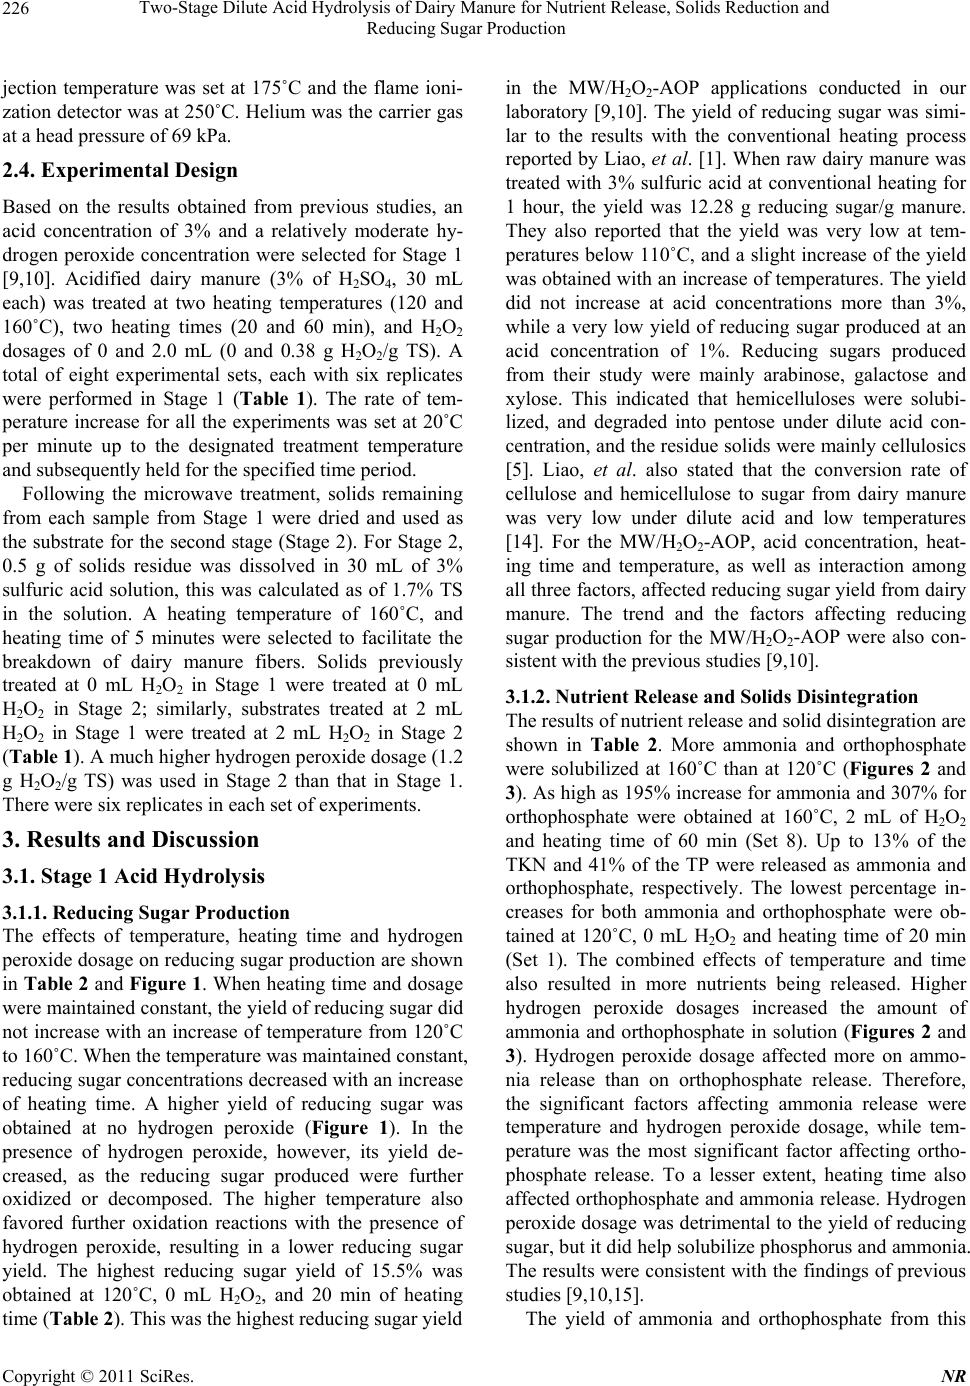 Two-Stage Dilute Acid Hydrolysis of Dairy Manure for Nutrient Release, Solids Reduction and 226 Reducing Sugar Production jection temperature was set at 175˚C and the flame ioni- zation detector was at 250˚C. Helium was the carrier gas at a head pressure of 69 kPa. 2.4. Experimental Design Based on the results obtained from previous studies, an acid concentration of 3% and a relatively moderate hy- drogen peroxide concentration were selected for Stage 1 [9,10]. Acidified dairy manure (3% of H2SO4, 30 mL each) was treated at two heating temperatures (120 and 160˚C), two heating times (20 and 60 min), and H2O2 dosages of 0 and 2.0 mL (0 and 0.38 g H2O2/g TS). A total of eight experimental sets, each with six replicates were performed in Stage 1 (Table 1). The rate of tem- perature increase for all the experiments was set at 20˚C per minute up to the designated treatment temperature and subsequently held for the specified time period. Following the microwave treatment, solids remaining from each sample from Stage 1 were dried and used as the substrate for the second stage (Stage 2). For Stage 2, 0.5 g of solids residue was dissolved in 30 mL of 3% sulfuric acid solution, this was calculated as of 1.7% TS in the solution. A heating temperature of 160˚C, and heating time of 5 minutes were selected to facilitate the breakdown of dairy manure fibers. Solids previously treated at 0 mL H2O2 in Stage 1 were treated at 0 mL H2O2 in Stage 2; similarly, substrates treated at 2 mL H2O2 in Stage 1 were treated at 2 mL H2O2 in Stage 2 (Table 1). A much higher hydrogen peroxide dosage (1.2 g H2O2/g TS) was used in Stage 2 than that in Stage 1. There were six replicates in each set of experiments. 3. Results and Discussion 3.1. Stage 1 Acid Hydrolysis 3.1.1. Re ducing S u gar Prod uc t ion The effects of temperature, heating time and hydrogen peroxide dosage on reducing sugar production are shown in Table 2 and Figure 1. W hen heating time and d osage were maintained constant, the yield of reducing sugar did not increase with an increase of temperature from 120˚C to 160˚C. When the temperatur e was maintain ed cons tant, reducing sugar concentrations decreased with an increase of heating time. A higher yield of reducing sugar was obtained at no hydrogen peroxide (Figure 1). In the presence of hydrogen peroxide, however, its yield de- creased, as the reducing sugar produced were further oxidized or decomposed. The higher temperature also favored further oxidation reactions with the presence of hydrogen peroxide, resulting in a lower reducing sugar yield. The highest reducing sugar yield of 15.5% was obtained at 120˚C, 0 mL H2O2, and 20 min of heating time (Table 2). This was the highest reducing sugar yield in the MW/H2O2-AOP applications conducted in our laboratory [9,10]. The yield of reducing sugar was simi- lar to the results with the conventional heating process reported by Liao, et al. [1]. When raw dairy manure was treated with 3% sulfuric acid at conventional heating for 1 hour, the yield was 12.28 g reducing sugar/g manure. They also reported that the yield was very low at tem- peratures below 110˚C, and a slight increase of the yield was obtained with an increase of temperatures. The yield did not increase at acid concentrations more than 3%, while a very low yield of reducing sugar produced at an acid concentration of 1%. Reducing sugars produced from their study were mainly arabinose, galactose and xylose. This indicated that hemicelluloses were solubi- lized, and degraded into pentose under dilute acid con- centration, and the residue solids were mainly cellulosics [5]. Liao, et al. also stated that the conversion rate of cellulose and hemicellulose to sugar from dairy manure was very low under dilute acid and low temperatures [14]. For the MW/H2O2-AOP, acid concentration, heat- ing time and temperature, as well as interaction among all three factors, affected reducing sugar yield from dairy manure. The trend and the factors affecting reducing sugar production for the MW/H2O2-AOP were also con- sistent with the previous studies [9,10]. 3.1.2. Nutrien t R e lease and S olids Disintegrat i on The results of nutrient release and solid disintegration are shown in Table 2. More ammonia and orthophosphate were solubilized at 160˚C than at 120˚C (Figures 2 and 3). As high as 195% increase for ammonia and 307% for orthophosphate were obtained at 160˚C, 2 mL of H2O2 and heating time of 60 min (Set 8). Up to 13% of the TKN and 41% of the TP were released as ammonia and orthophosphate, respectively. The lowest percentage in- creases for both ammonia and orthophosphate were ob- tained at 120˚C, 0 mL H2O2 and heating time of 20 min (Set 1). The combined effects of temperature and time also resulted in more nutrients being released. Higher hydrogen peroxide dosages increased the amount of ammonia and orthophosphate in solution (Figures 2 and 3). Hydrogen peroxide dosage affected more on ammo- nia release than on orthophosphate release. Therefore, the significant factors affecting ammonia release were temperature and hydrogen peroxide dosage, while tem- perature was the most significant factor affecting ortho- phosphate release. To a lesser extent, heating time also affected orthophosphate and ammonia release. Hydrogen peroxide dosage was detrimental to the yield of reducing sugar, but it did help solubilize phosphorus and ammonia. The results were consistent with the findings of previous studies [9,10,15]. The yield of ammonia and orthophosphate from this Copyright © 2011 SciRes. NR 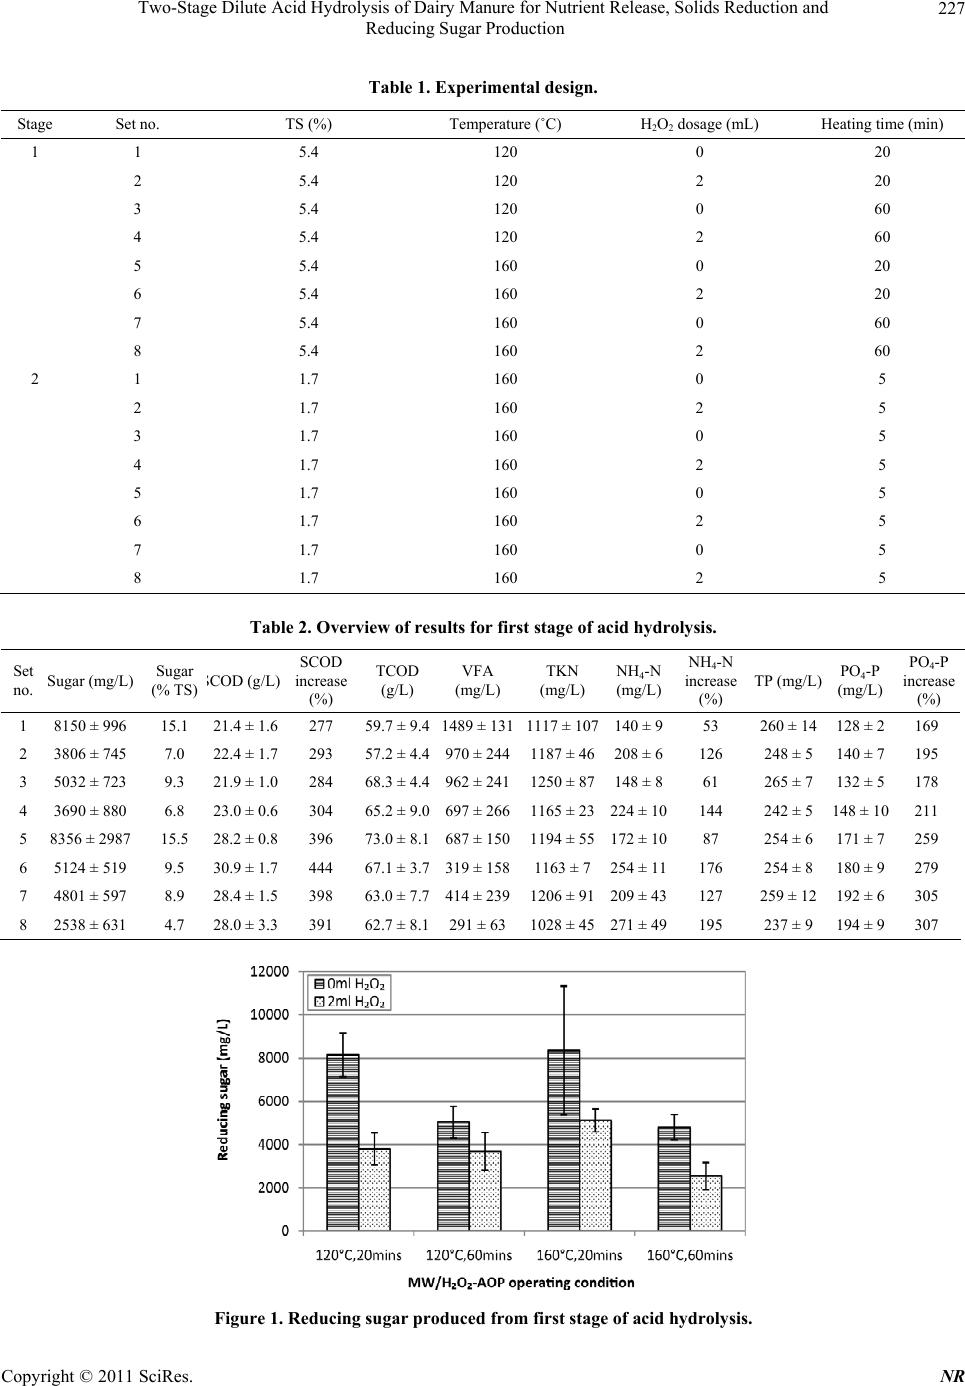 Two-Stage Dilute Acid Hydrolysis of Dairy Manure for Nutrient Release, Solids Reduction and Reducing Sugar Production Copyright © 2011 SciRes. NR 227 Table 1. Experimental design. Stage Set no. TS (%) Temperature (˚C) H2O2 dosage (mL) Heating time (min) 1 1 5.4 120 0 20 2 5.4 120 2 20 3 5.4 120 0 60 4 5.4 120 2 60 5 5.4 160 0 20 6 5.4 160 2 20 7 5.4 160 0 60 8 5.4 160 2 60 2 1 1.7 160 0 5 2 1.7 160 2 5 3 1.7 160 0 5 4 1.7 160 2 5 5 1.7 160 0 5 6 1.7 160 2 5 7 1.7 160 0 5 8 1.7 160 2 5 Table 2. Overview of results for first stage of acid hydrolysis. Set no. Sugar (mg/L) Sugar (% TS) COD (g/L) SCOD increase (%) TCOD (g/L) VFA (mg/L) TKN (mg/L) NH4-N (mg/L) NH4-N increase (%) TP (mg/L) PO4-P (mg/L) PO4-P increase (%) 1 8150 ± 996 15.1 21.4 ± 1.6 277 59.7 ± 9.41489 ± 1311117 ± 107140 ± 953 260 ± 14 128 ± 2169 2 3806 ± 745 7.0 22.4 ± 1.7 293 57.2 ± 4.4970 ± 2441187 ± 46208 ± 6126 248 ± 5 140 ± 71 95 3 5032 ± 723 9.3 21.9 ± 1.0 284 68.3 ± 4.4962 ± 2411250 ± 87148 ± 861 265 ± 7 132 ± 5178 4 3690 ± 880 6.8 23.0 ± 0.6 304 65.2 ± 9.0697 ± 2661165 ± 23224 ± 10144 242 ± 5 148 ± 10211 5 8356 ± 2987 15.5 28.2 ± 0.8 396 73.0 ± 8.168 7 ± 15 01194 ± 55172 ± 1087 254 ± 6 171 ± 7259 6 5124 ± 519 9.5 30.9 ± 1.7 444 67.1 ± 3.7319 ± 1581163 ± 7254 ± 11176 254 ± 8 180 ± 9279 7 4801 ± 597 8.9 28.4 ± 1.5 398 63.0 ± 7.7414 ± 2391206 ± 91209 ± 43127 259 ± 12 192 ± 6305 8 2538 ± 631 4.7 28.0 ± 3.3 391 62.7 ± 8.1291 ± 631028 ± 45271 ± 49195 237 ± 9 194 ± 9307 Figure 1. Reducing sugar produced from first stage of acid hydrolysis.  Two-Stage Dilute Acid Hydrolysis of Dairy Manure for Nutrient Release, Solids Reduction and 228 Reducing Sugar Production Figure 2. Ammonia release from first stage of acid hydrolysis. Figure 3. Orthophosphate release from first stage of acid hydrolysis. study was comparable to the results reported by other groups [16,17]. Similarly, the release of 20% - 40% solu- ble phosphorus and 9% - 14% ammonia were reported with microwave-based thermochemical treatment of dairy manure [17]. Pan et al., [16] however, reported that the MW/H2O2-AOP process could achieve up to 85% of total phosphate release from dairy manure filtrate at 120˚C. This was due to the fact that a very high hydro- gen peroxide dosage was applied in their study. The MW/H2O2-AOP not only solubilizes phosphorus and ammonia, but also reduces total suspended solids (TSS) [15]. The concentration of SCOD increased with an increase of temperature as showed in Figure 4. The SCOD could further be oxidized and/or decomposed into CO2 at a higher temperature and a longer reaction time, therefore, its concentration decreased as shown in Set 8 (160˚C, 2 mL of H2O2 and reaction time of 60 min. VFA existed mainly as acetic acid, and with some pro- pionic, butyric and heptanoic acids. Highest VFA release was at 120˚C, 0 mL of H2O2 and a reaction time of 20 min. VFA concentration decreased with an increase of temperature, hydrogen peroxide dosage and reaction time (Figure 5). The decrease in VFAs with a higher tem- perature and a longer reactio n time could be due to either vaporization of VFAs or oxidation to CO2 generation as the end product [15]. 3.2. Stage 2 Acid Hydrolysis The results of Stage 2 of acid hydrolysis are shown in Table 3; up to 4% of additional reducing sugar could be obtained. The higher reducing sugar yield was obtained in the process without adding hydrogen peroxide (Figure 6). It was not very effective in producing reducing sugar in the second stage of acid hydrolysis, with a short reac- Copyright © 2011 SciRes. NR  Two-Stage Dilute Acid Hydrolysis of Dairy Manure for Nutrient Release, Solids Reduction and 229 Reducing Sugar Production Figure 4. SCOD release from first stage of acid hydrolysis. Figure 5. VFA release from first stage of acid hydrolysis. Figure 6. Reducing sugar yield from second stage of acid hydrolysis. Copyright © 2011 SciRes. NR 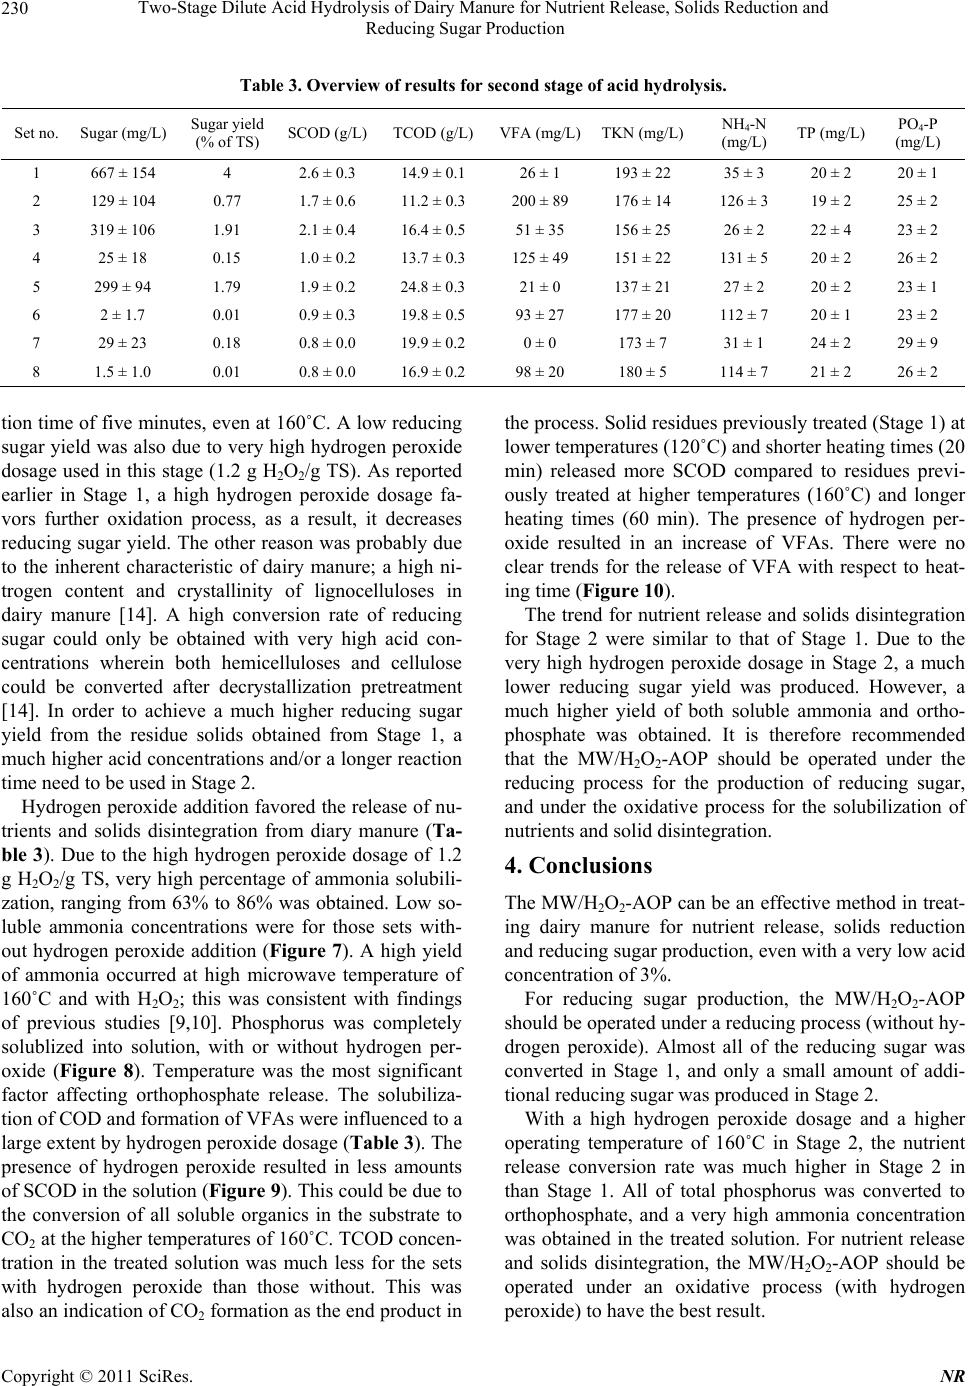 Two-Stage Dilute Acid Hydrolysis of Dairy Manure for Nutrient Release, Solids Reduction and 230 Reducing Sugar Production Table 3. Overview of results for second stage of acid hydrolysis. Set no. Sugar (mg/L) Sugar yield (% of TS) SCOD (g/L) TCOD (g/L) VFA (mg/L)TKN (mg/L)NH4-N (mg/L) TP (mg/L) PO4-P (mg/L) 1 667 ± 154 4 2.6 ± 0.3 14.9 ± 0.1 26 ± 1 193 ± 22 35 ± 3 20 ± 2 20 ± 1 2 129 ± 104 0.77 1.7 ± 0.6 11.2 ± 0.3 200 ± 89 176 ± 14 126 ± 3 19 ± 2 25 ± 2 3 31 9 ± 1 0 6 1.9 1 2.1 ± 0.4 16.4 ± 0.5 51 ± 35 156 ± 2 5 26 ± 2 22 ± 4 23 ± 2 4 25 ± 18 0.15 1.0 ± 0.2 13.7 ± 0.3 125 ± 49 151 ± 22 131 ± 5 20 ± 2 26 ± 2 5 299 ± 94 1.79 1.9 ± 0.2 24.8 ± 0.3 21 ± 0 1 37 ± 2 1 27 ± 2 20 ± 2 23 ± 1 6 2 ± 1.7 0.01 0.9 ± 0.3 19.8 ± 0.5 93 ± 27 177 ± 20 112 ± 7 20 ± 1 23 ± 2 7 29 ± 23 0.18 0.8 ± 0.0 19.9 ± 0.2 0 ± 0 173 ± 7 31 ± 1 24 ± 2 29 ± 9 8 1.5 ± 1.0 0.01 0.8 ± 0.0 16.9 ± 0.2 98 ± 20 180 ± 5 114 ± 7 21 ± 2 26 ± 2 tion time of five minutes, even at 160˚C. A low reducing sugar yield was also due to very high hydrogen peroxide dosage used in this stage (1.2 g H2O2/g TS). As reported earlier in Stage 1, a high hydrogen peroxide dosage fa- vors further oxidation process, as a result, it decreases reducing sugar yield . The other reason was probably due to the inherent characteristic of dairy manure; a high ni- trogen content and crystallinity of lignocelluloses in dairy manure [14]. A high conversion rate of reducing sugar could only be obtained with very high acid con- centrations wherein both hemicelluloses and cellulose could be converted after decrystallization pretreatment [14]. In order to achieve a much higher reducing sugar yield from the residue solids obtained from Stage 1, a much higher acid concentrations and/or a longer reaction time need to be used in Stage 2. Hydrogen perox ide addition favored the release of nu- trients and solids disintegration from diary manure (Ta- ble 3). Due to the high hydrogen peroxide dosage of 1.2 g H2O2/g TS, very high percentage of ammonia solubili- zation, ranging from 63% to 86% was obtained. Low so- luble ammonia concentrations were for those sets with- out hydrogen peroxide addition (Figure 7). A high yield of ammonia occurred at high microwave temperature of 160˚C and with H2O2; this was consistent with findings of previous studies [9,10]. Phosphorus was completely solublized into solution, with or without hydrogen per- oxide (Figure 8). Temperature was the most significant factor affecting orthophosphate release. The solubiliza- tion of COD and formation of VFAs were influenced to a large extent by hydrogen peroxide dosage (Table 3 ). Th e presence of hydrogen peroxide resulted in less amounts of SCOD in the solution (Figure 9). This could be due to the conversion of all soluble organics in the substrate to CO2 at the higher temperatures of 160˚C. TCOD concen- tration in the treated solution was much less for the sets with hydrogen peroxide than those without. This was also an indication of CO2 formation as the end product in the process. Solid residues previously treated (Stage 1) at lower temperatures (120˚C) and shorter heating times (20 min) released more SCOD compared to residues previ- ously treated at higher temperatures (160˚C) and longer heating times (60 min). The presence of hydrogen per- oxide resulted in an increase of VFAs. There were no clear trends for the release of VFA with respect to heat- ing time (Figure 10). The trend for nutrient release and solids disintegration for Stage 2 were similar to that of Stage 1. Due to the very high hydrogen peroxide dosage in Stage 2, a much lower reducing sugar yield was produced. However, a much higher yield of both soluble ammonia and ortho- phosphate was obtained. It is therefore recommended that the MW/H2O2-AOP should be operated under the reducing process for the production of reducing sugar, and under the oxidative process for the solubilization of nutrients and solid disintegration. 4. Conclusions The MW/H2O2-AOP can b e an effectiv e method in treat- ing dairy manure for nutrient release, solids reduction and reducing sugar produ ction, ev en with a ver y low acid concentrat ion of 3% . For reducing sugar production, the MW/H2O2-AOP should be operated under a reducing process (without hy- drogen peroxide). Almost all of the reducing sugar was converted in Stage 1, and only a small amount of addi- tional reducing sugar was produced in Stage 2. With a high hydrogen peroxide dosage and a higher operating temperature of 160˚C in Stage 2, the nutrient release conversion rate was much higher in Stage 2 in than Stage 1. All of total phosphorus was converted to orthophosphate, and a very high ammonia concentration was obtained in the treated solution. For nutrient release and solids disintegration, the MW/H2O2-AOP should be operated under an oxidative process (with hydrogen peroxide) to have the best result. Copyright © 2011 SciRes. NR 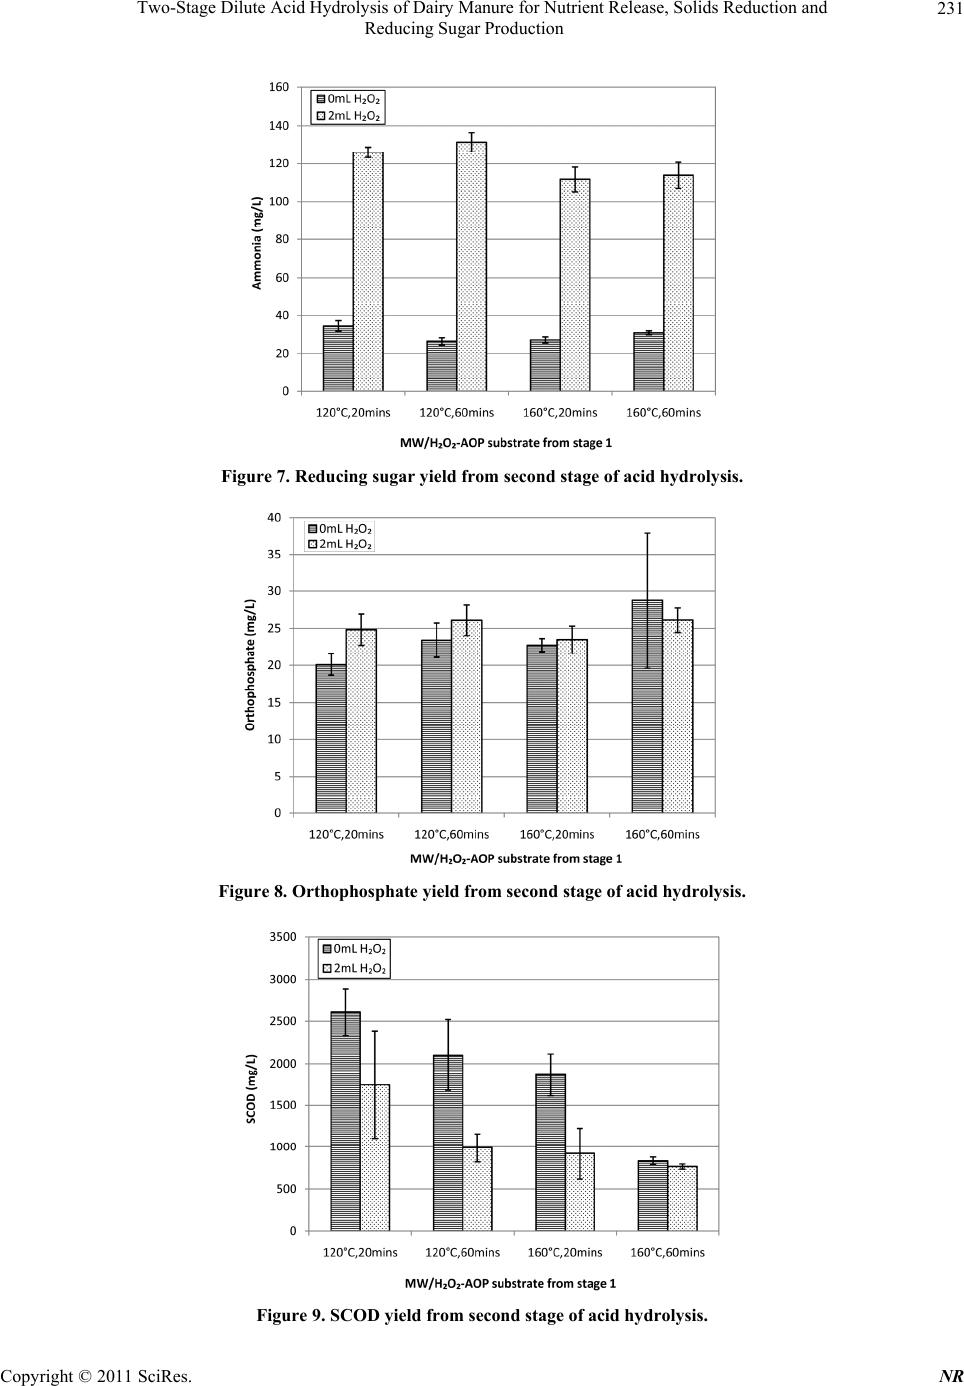 Two-Stage Dilute Acid Hydrolysis of Dairy Manure for Nutrient Release, Solids Reduction and 231 Reducing Sugar Production Figure 7. Reducing sugar yield from second stage of acid hydrolysis. Figure 8. Orthophosphate y ield from second stage of acid hydrolysis. Figure 9. SCOD yield from second stage of acid hydrolysis. Copyright © 2011 SciRes. NR 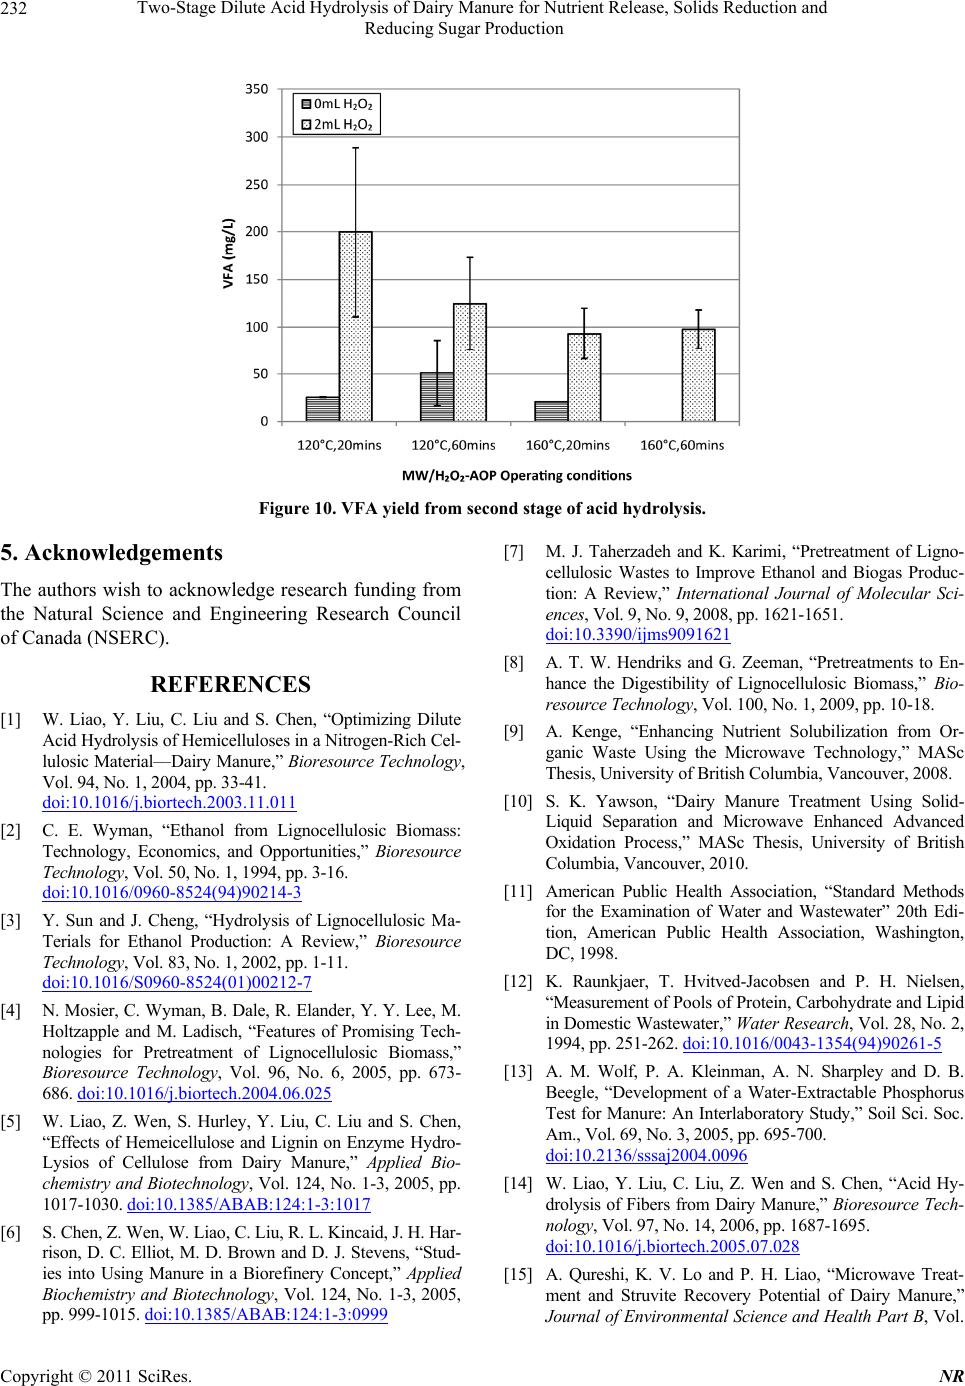 Two-Stage Dilute Acid Hydrolysis of Dairy Manure for Nutrient Release, Solids Reduction and 232 Reducing Sugar Production Figure 10. VFA yield from second stage of acid hydrolysis. 5. Acknowledgements The authors wish to acknowledge research funding from the Natural Science and Engineering Research Council of Canada (NSERC). REFERENCES [1] W. Liao, Y. Liu, C. Liu and S. Chen, “Optimizing Dilute Acid Hydrolysis of He micellul oses in a Nitrogen-Rich Cel- lulosic Material––Dairy Manure,” Bioresource Technology, Vol. 94, No. 1, 2004, pp. 33-41. doi:10.1016/j.biortech.2003.11.011 [2] C. E. Wyman, “Ethanol from Lignocellulosic Biomass: Technology, Economics, and Opportunities,” Bioresource Technology, Vol. 50, No. 1, 1994, pp. 3-16. doi:10.1016/0960-8524(94)90214-3 [3] Y. Sun and J. Cheng, “Hydrolysis of Lignocellulosic Ma- Terials for Ethanol Production: A Review,” Bioresource Technology, Vol. 83, No. 1, 2002, pp. 1-11. doi:10.1016/S0960-8524(01)00212-7 [4] N. Mosier, C. Wyman, B. Dale, R. Elander, Y. Y. Lee, M. Holtzapple and M. Ladisch, “Features of Promising Tech- nologies for Pretreatment of Lignocellulosic Biomass,” Bioresource Technology, Vol. 96, No. 6, 2005, pp. 673- 686. doi:10.1016/j.biortech.2004.06.025 [5] W. Liao, Z. Wen, S. Hurley, Y. Liu, C. Liu and S. Chen, “Effects of Hemeicellulose and Lignin on Enzyme Hydro- Lysios of Cellulose from Dairy Manure,” Applied Bio- chemistry and Biotechnology, Vol . 124, No. 1-3, 2005, pp. 1017-1030. doi:10.1385/ABAB:124:1-3:1017 [6] S. Chen, Z. Wen, W. Liao, C. Liu, R. L. Kincaid, J. H. Har- rison, D. C. Elliot, M. D. Brown and D. J. Stevens, “Stud- ies into Using Manure in a Biorefinery Concept,” Applied Biochemistry and Biotechnology, Vol. 124, No. 1-3, 2005, pp. 999-1015. doi:10.1385/ABAB:124:1-3:0999 [7] M. J. Taherzadeh and K. Karimi, “Pretreatment of Ligno- cellulosic Wastes to Improve Ethanol and Biogas Produc- tion: A Review,” International Journal of Molecular Sci- ences, Vol. 9, No. 9, 2008, pp. 1621-1651. doi:10.3390/ijms9091621 [8] A. T. W. Hendriks and G. Zeeman, “Pretreatments to En- hance the Digestibility of Lignocellulosic Biomass,” Bio- resource Technology, Vol. 100, No. 1, 2009, pp. 10-18. [9] A. Kenge, “Enhancing Nutrient Solubilization from Or- ganic Waste Using the Microwave Technology,” MASc Thesis, University of British Columbia, Vancouver, 2008. [10] S. K. Yawson, “Dairy Manure Treatment Using Solid- Liquid Separation and Microwave Enhanced Advanced Oxidation Process,” MASc Thesis, University of British Columbia, Vancouver, 2010. [11] American Public Health Association, “Standard Methods for the Examination of Water and Wastewater” 20th Edi- tion, American Public Health Association, Washington, DC, 1998. [12] K. Raunkjaer, T. Hvitved-Jacobsen and P. H. Nielsen, “Measurement of Pools of Pr otein, Carbohy drate and Lipid in Domestic Wastewater,” Water Research, Vol. 28, No. 2, 1994, pp. 251-262. doi:10.1016/0043-1354(94)90261-5 [13] A. M. Wolf, P. A. Kleinman, A. N. Sharpley and D. B. Beegle, “Development of a Water-Extractable Phosphorus Test for Manure: An Interlaboratory Study,” Soil Sci. Soc. Am., Vol. 69, No. 3, 2005, pp. 695-700. doi:10.2136/sssaj2004.0096 [14] W. Liao, Y. Liu, C. Liu, Z. Wen and S. Chen, “Acid Hy- drolysis of Fibers from Dairy Manure,” Bioresource Tech- nology, Vol. 97, No. 14, 2006, pp. 1687-1695. doi:10.1016/j.biortech.2005.07.028 [15] A. Qureshi, K. V. Lo and P. H. Liao, “Microwave Treat- ment and Struvite Recovery Potential of Dairy Manure,” Journal of Environmental Science and Health Part B, Vol. Copyright © 2011 SciRes. NR 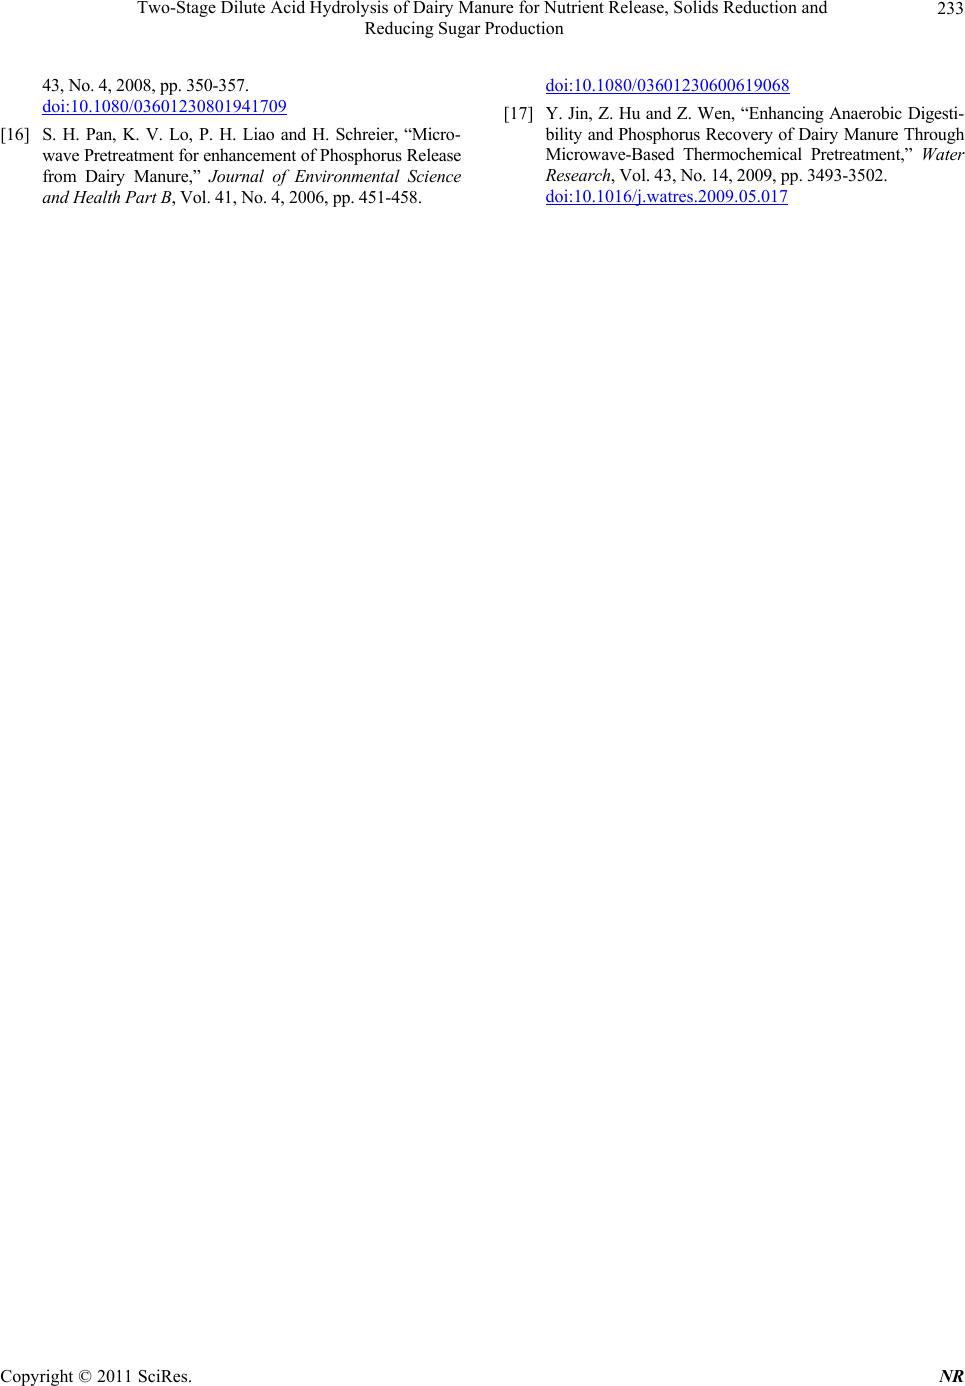 Two-Stage Dilute Acid Hydrolysis of Dairy Manure for Nutrient Release, Solids Reduction and 233 Reducing Sugar Production 43, No. 4, 2008, pp. 350-357. doi:10.1080/03601230801941709 [16] S. H. Pan, K. V. Lo, P. H. Liao and H. Schreier, “Micro- wave Pretreatment for enhanceme nt of Phosp horus Release from Dairy Manure,” Journal of Environmental Science and Health Part B, Vol. 41, No. 4, 2006, pp. 451-458. doi:10.1080/03601230600619068 [17] Y. Jin, Z. Hu and Z. Wen, “Enhancing Anaerobic Digesti- bility and Phosphorus Recovery of Dairy Manure Through Microwave-Based Thermochemical Pretreatment,” Water Research, Vol. 43, No. 14, 2009, pp. 3493-3502. doi:10.1016/j.watres.2009.05.017 Copyright © 2011 SciRes. NR
|