Open Journal of Me di cal Imaging, 2011, 1, 43-47
doi:10.4236/ojmi.2011.12006 Published Online December 2011 (http://www.SciRP.org/journal/ojmi)
Copyright © 2011 SciRes. OJMI
A 3D Matching Method for Organic Training Samples
Alignment Based on Surface Curvature Distribution
Guangxu Li, Hyoungseop Kim, Joo Kooi Tan, Seiji Ishikawa, Akiyoshi Yamamoto
Kyushu Institute of Technology, Kitakyushu, Japan
E-mail: kim@cntl.kyutech.ac.jp
Received October 19, 2011; revised November 18, 2011; accepted November 28, 2011
Abstract
The fundamental step to get a Statistical Shape Model (SSM) is to align all the training samples to the same
spatial modality. In this paper, we propose a new 3D alignment method for organic training samples match-
ing, whose modalities are orientable and surface figures could be recognized. It is a feature based alignment
method which matches two models depending on the distribution of surface curvature. According to the af-
fine transformation on 2D Gaussian map, the distances between the corresponding parts on surface could be
minimized. We applied our proposed method on 5 cases left lung training samples alignment and 4 cases
liver training samples alignment. The experiment results were performed on the left lung training samples
and the liver training samples. The availability of proposed method was confirmed.
Keywords: Training Samples Alignment, Statistical Shape Model, Gauss Map, K-Means
1. Introduction
Due to utilizing the priori information of shapes, Statis-
tical Shape Model (SSM) method shows concise and
robust for segmentation, analyzing and interpreting ana-
tomical objects from medical datasets [1]. The basic idea
in model building is to statistic the pattern of legal varia-
tion in the shapes and spatial relationships of structures
from a collection of training samples. A key step in
building a model involves establishing a dense corre-
spondence between shape boundaries and surface figures.
It is important to align all training samples in a common
coordinate frame firstly [2].
The training shapes alignment problems can be con-
cluded that the transformation between the same anat-
omy images at different modalities or represented by one
modality at different time [3]. In point sets based align-
ment method, the set of identified points is sparse com-
pared with the original image content, which makes for
relatively fast optimization procedures, but is difficult to
confirm the corresponding points. Some novel strategies
are reported to optimize measures such as the average
distance between each representative point, or iterated
minimal distances metric [4]. These methods are mostly
used to find rigid or affine transformations. Feature-
based alignment is largely founded on the use of differ-
ential geometry to describe local surface feature. Ac-
cording to the difference of local feature on parameter-
ized space, an appropriate transformation could be re-
quired. The statistical model building would benefit from
this technology. Because generally the landmarks posi-
tions always involve the local features of surface.
In this paper, we propose a feature-based alignment
method to reconcile the training samples of organs field
whose shape could be approximated by multi-faces. Bene-
fit from the Gauss map, the surface Gaussian curvature
could be reflected on the 2D spherical surface. Due to the
distributional independence of each face through Gauss
mapping, we can decide the modality by comparing the
distributional character.
In Section 2 we will review the Gauss-Bonnet theorem
applying to piecewise surface concisely. Based on it, we
will analyze an approximated Gauss mapping method for
triangular surface. After that, a mesh filter to eliminate
the illogical mapped points is introduced. In Section 3,
we will describe the alignment method on Gauss map.
Here, the K-means clustering method is used to obtain
the same quantity of the respective points, which are
utilized to remark the modalities of the models. And we
also give a simple solution of the alignment parameters.
Evaluation method incorporating corresponding land-
mark points is introduced in the last section. Some ex-
perimental results will be illustrated after that.
G. X. LI ET AL.
44
2
2
2. Surface Generation and Its Gauss Map
2.1. Organic Polygonal Surface Generation
The choice of shape representation is the first fundamen-
tal decision when designing statistical shape models. The
surface meshes representation is one of the most generic
methods. As well as it is convenient to general land-
marks using mesh resample technique. To get polygonal
surface training samples from body CT images, firstly,
we should extract the region of interest and represent it
by binary voxel data. The mesh is extracted by Marching
Cubes Algorithm introduced by Lorensen and Cline [5].
But the smoothness of the surface mesh generated by this
algorithm is quite rough. The mesh mean filter is op-
tional for mesh smoothing.
2.2. Gauss Map of Polygonal Surface
The Gaussian curvature of a point on a surface is an in-
trinsic measure of curvature, i.e., its value depends only
on how distances are measured on the surface. The Gauss-
Bonnet theorem links total curvature of a surface to its
topological properties [6,7]. The theorem also has inter-
esting consequences for triangles. It could be accounted
as follows:
Suppose D is a simply connected region on the surface,
ƏD is a piecewise smooth closed curve, kg is called the
geodesic curvature of the curve. Assume αj are the outer
angles of the vertices of ƏD. Then
dd π
pgj
DD
j
KA ks

 (1)
If the geodesic curvature is smooth, then
dπ
pj
Dj
KA

(2)
The integral operation will be replaced by the accu-
mulated sum operation, when we consider the piecewise
polygonal surface.
Figure 1(a) shows a polygonal cell with three faces
adjacent a vertex Vi. The number of the faces is not lim-
ited by three, we denote it by s. Gj represents one point in
the unit triangular face ViVi+1Vi+2, and the norm nj joints
this triangular face at it. The norm nj is given by


12
12
iii i
j
iii i
VVV V
nVVV V


 
 (3)
As the normal direction of each polygonal plane face
is special, mapping this unit face to a point on the Gaus-
sian sphere still makes sense.
j
G is the corresponding
point of G
j on Gauss map, in Figure 1(b), and it also
used to represent the mapping of the face ViVi+1Vi+2. Ac-
cording to the angular variety of the two vertices Gj, Gj+1,
(a)
(b)
Figure 1. One polygonal cell around a vertex and its Gauss
mapping. (a) The norms of triangular faces adjacent this
vertex; (b) One polygonal face unit on Gauss map.
the line segments GjM, MGj+1 could be projected to the
spherical segment 1
j
j
GG
. In the same way, mapping of
the vertex Vi is loaded inside of the simple connection of
the region 11
j
jjs
GG G


, because the original surface
is smooth and continuous.
Support αj are the outer angles of the cell. Because the
Gaussian curvature on the Gauss sphere is one every-
where, from the Equation (2), the area of this cell Ai
could be simplified by
2(2)
ij
jj
An
j

 
(4)
where βj is the intersection angle between two spherical
segments. Since spherical segments 1
j
j
GG
 and 1
j
js
GG
are the mapping of the segments 1
j
j and
1
GMG

j
js
GNG
respectively, if denote the projective angle of
βj as
j
, it is not difficult to proof that
j
approaches
to βj.
As well as
π
ii
then
2π
i
j
Aj

(5)
The right part of the Equation (5) is the total Gauss
curvature at vertex Vi. So, this equation illustrates that
the area of the spherical polygonal cell on Gauss map
could be applied to estimate the curvature of the original
piecewise polygonal surface. When we minimized the
Copyright © 2011 SciRes. OJMI
G. X. LI ET AL.45
2
2
area Ai, the norm of the vertex Vi could be approximated
by the sum of the norms of the faces around Vi.
2.3. Remove the Scattered Mapping Vertices
At some parts of polygonal surface, such as irregular
indentation and the boundary of object, the vigorous
change of curvature induces some vertices scattered after
gauss mapping. Here, a mesh filter is designed to reduce
the influence from that.
Apply the spherical coordinate to express the points on
Gauss map. Define θi ג [0,π] is the inclination angle
measured form a fixed zenith direction, and φi ג [0,2π) is
the azimuth angle. Then the variance of the spherical
coordinates could be formulated by Equation (6), which
describes how dispersive the point Vi to its neighbors,

2
2
22
iijij ijij
ijijij ij
EE EE
EEEE
 


 
 
 


 
 
 
 
 
(6)
where ,
ijji ijji


 
and E is the mean op-
erator. The “noise point” could be defined as which is
bigger than threshold.
3. Alignment on Gauss Map
3.1. Distribution of Local Surface Feature on
Gauss Map
On the Gauss map, we can facilitate to obtain the estima-
tion of geometric attributes of surface such as curvature
distribution, uniform continuity and smoothness. To the
same graphic pattern, this estimation has the similarity in
some sense.
In Fi gu re 2(a), we demonstrate mapping a 2D shape to
Gauss sphere. The cambered surface patches which have
continuous curvature are mapped continuous regions on
Gauss map spherical surface. The plane part P0P1 is con-
centrated into a point n0. The patch P1P2 is convex line
segment with a low curvature, the mapping is continuous
from n1 to n2 with a relative dispersive distribution. The
concave patch P2P3P0 has a bevel near the point P3, is
reflected region to n2n3n4n5 is seemed separated. Since
the discontinuity of curvature among the regions of sur-
face, the mapping points aggregate to some separations.
The modalities could be inferred from this “texture of
curvature”. Figure 2(b) shows a Gauss map of one case
of liver polygonal triangular surface. The mapping dis-
tribution is distinct.
3.2. Matching Solution by K-Means Clustering
Unfold the Gauss map according to the spherical coordi-
nates, as Figure 3(a), cluster of the point sets is obvious.
The intensive regions correspond to the main faces
which are relative flat on the original polygonal surface
of organic model. Following it, if find a metric to meas-
ure the distances between the main surfaces, the optimi
zation of alignment method could be performed.
The cluster method is used to describe the distribution
of the point sets. In detail, here we use the K-means clus-
tering algorithm to divide the point sets on 2D Gauss
map. The centroid of a cluster, denoted as the representa-
tive point, is the average point in the multidimensional
space defined by the dimensions. In a sense, it is the
center of gravity for the respective cluster. In this method,
the distance between two clusters is determined as the
difference between centroids. Reference [8] provides a
boosting algorithm which uses kd-tree structure. The
number of the classifiers is 21 and the initial seed points’
positions are set averagely.
The solution of the rigid parameters solution is based
on Berthold K.P. Horn [9]. The author provides a method
to decompose the effects from the translating, scale and
n1n3
n5n0
P3
P0
P2
P1
n2
n4
(a) (b)
Figure 2. Gaussian sphere. (a) Gauss mapping of 2D model;
(b) Gauss mapping of liver triangular surface.
(a) (b)
Figure 3. Alignment method illustration. (a) Representative
points obtained by k-means method. Shown on unfolded
Gauss map; (b) Rotation parameter optimization.
Copyright © 2011 SciRes. OJMI
G. X. LI ET AL.
46
rotation. It is a coarse alignment method and could give a
simple solution when all the points are coplanar. In that
case, it has been inferred that to require the translation
minimize, just align the centers of gravity of two point
sets. Referring to the scale factor, actually it needn’t be
considered, for all surface maps are in the unit sphere.
The remaining task about the rotation is the solution of a
least squares problem in a plane, as Figure 3(b). The
vector vl,i points from one representative point to the
centroid on Gauss map of referent model, Corresponding
it vr,i is on the sample model. αi represents the angle be-
tween these two vectors pair. The solution of the rotation
amounts to minimize the
2
,,li ri
i
vv
The optimized deviation angle θ could be calculated
by
2
sin S
SC
 2
(7)
where ,

,,liri
i
Cvv

,,li ri
i
Svv
.
4. Experiments Results
4.1. Similarity Criterion
Due to the intense variety of organ shapes, seeking for
corresponding points seems to be a difficult task. There
is ever lack of reliable measures to quantify model qual-
ity yet. In this study, the selection of the label points de-
pending on the anatomical structure drew an easy way of
implement. There are two steps: the position matching
that reconciling the center of models and regular the size
of the samples by mean radius of the whole vertices.
Then we choose 20 points, we call them label points, on
the polygonal surface. Evaluate the results by measure
the Euclidean distances sum of corresponding points.
4.2. Verification Experiments
To verify the alignment extent by proposed method, we
aligned one set of left lung training shapes, which gener-
ated by one lung polygonal surface model but the mo-
dalities were changed through rotation in 3D space. Us-
ing the same model is convenient to the quantitative
analysis. Map the vertices to the Gauss map and align the
points set using the method in Section 3.2. The results
are recorded in Table 1. The rotation volume represents
the rotation values of the model along the x axis, y axis
and z axis respectively. The Pre-Alignment is the origi-
nal mean distances of the label points and the Post-
4.3. Fitness Results
Alignment corresponds the distances after alignment.
were performed on training sam-
ples of left lung field and liver field. To evaluate the re-
sion
lignment evaluation, the relative posi-
tion of the training samples to the reference model is
the Regis-
tra
method.
Alignment experiments
sults of alignment, we compared the Euclidean distances
sum of corresponding label points between training sam-
ples and reference model. The improvement of distances
sum of the label points is applied to evaluate the avail-
ability of proposed method. 4 cases triangular polygonal
surface samples of left lung field and 3 cases on liver
were implied. The rotation column records the angle ad-
justment, discussed in Section 3.2. As well as the im-
provement rate is shown in Tables 2-3. The Pre-Align-
ment is the original mean distances of label points. The
Post-Alignment is the corresponding distances after
alignment.
4.4. Discus
According to the a
improved. The average improvement of Euclidean dis-
tances of label points is 1.3% on left lung field alignment
experiment results and 0.23% on liver field.
In [10], the author points out that in fact few registra-
tion papers attempt to follow up on the use of
tion. Many cases the registration problem is just satis-
fied the visualization requirement. In this research, the
purpose of the alignment is that force unique points on
the surface of training samples to their corresponding
points on referenced model. So the precision rate could
be improved with the alignment rate improving.
In this paper, we employed the plane Euclidean dis-
tance as the evaluate argument of the alignment
Table 1. Confirmation results on rotated one case of lung
ainning sample. tr
CaseOffset (x, y, z) Pre-Alignment Post-Alignment
1 0, 0, 0.0175 0.0381 0.0346
2 0, 0.0175, 0 0.1956 0.0191
3 0.0175, 0, 0 0.0810 0.0799
4 0.0349, 0 0.0349,0.4380 0.4424
le on letr ainning sample s.
C
Tab2. Fitness resultsft lung
aseRotationPre-Alignment Post-Alignment Improvement
1 0.02910.3214 0.3090 3.9%
2 0.07070.3395 0.3381 0.4%
3 0.03560.2503 0.2481 0.9%
4 0.05510.3340 0.3342 –0%
Copyright © 2011 SciRes. OJMI
G. X. LI ET AL.
Copyright © 2011 SciRes. OJMI
47
Taitnes on liveing sam
C RPre-t PostImpent
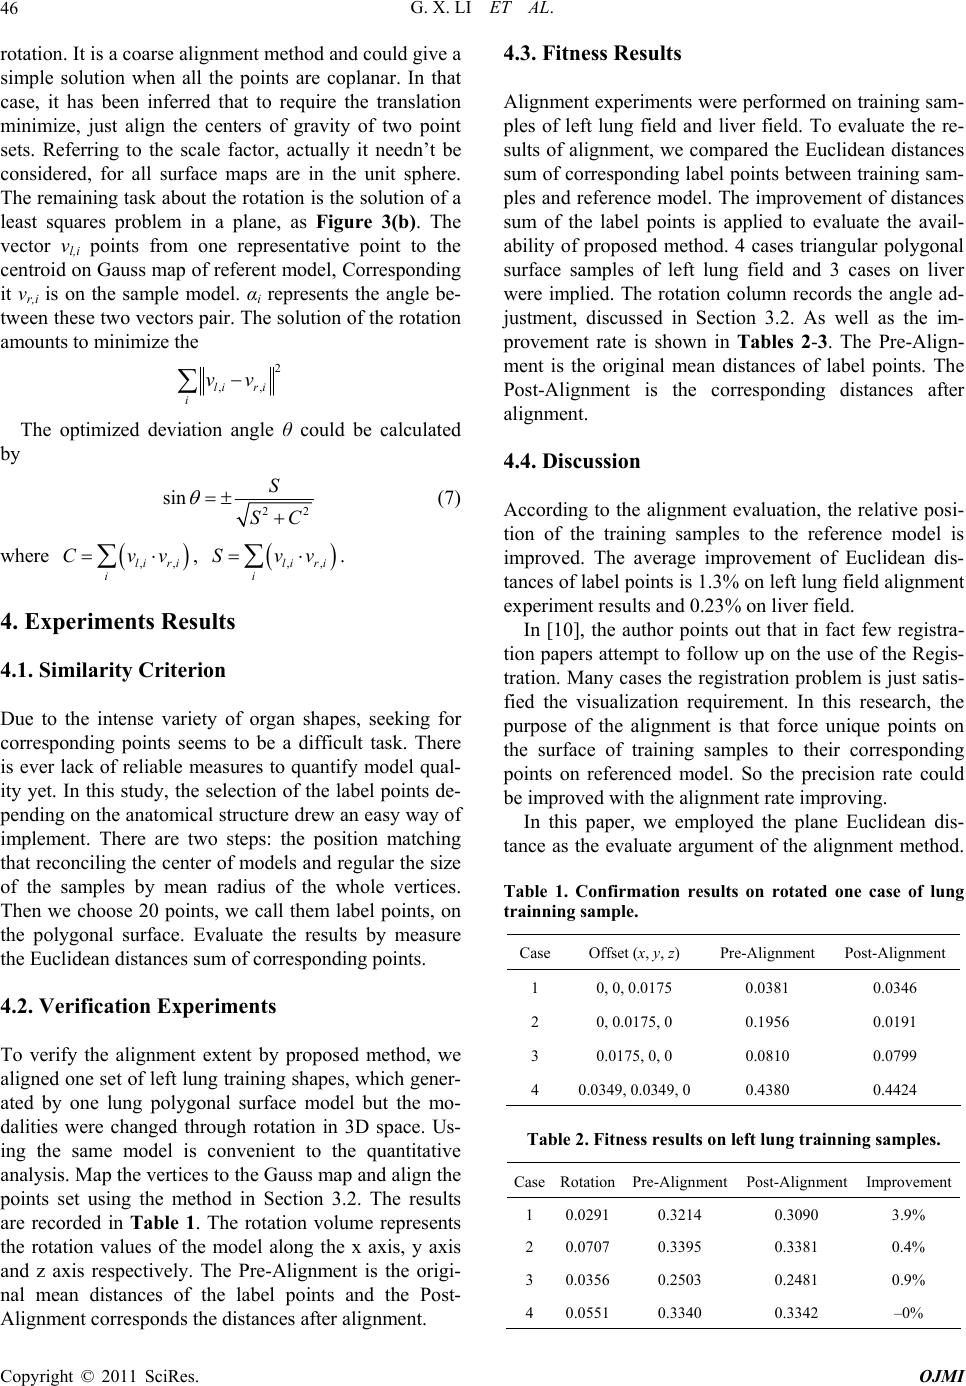
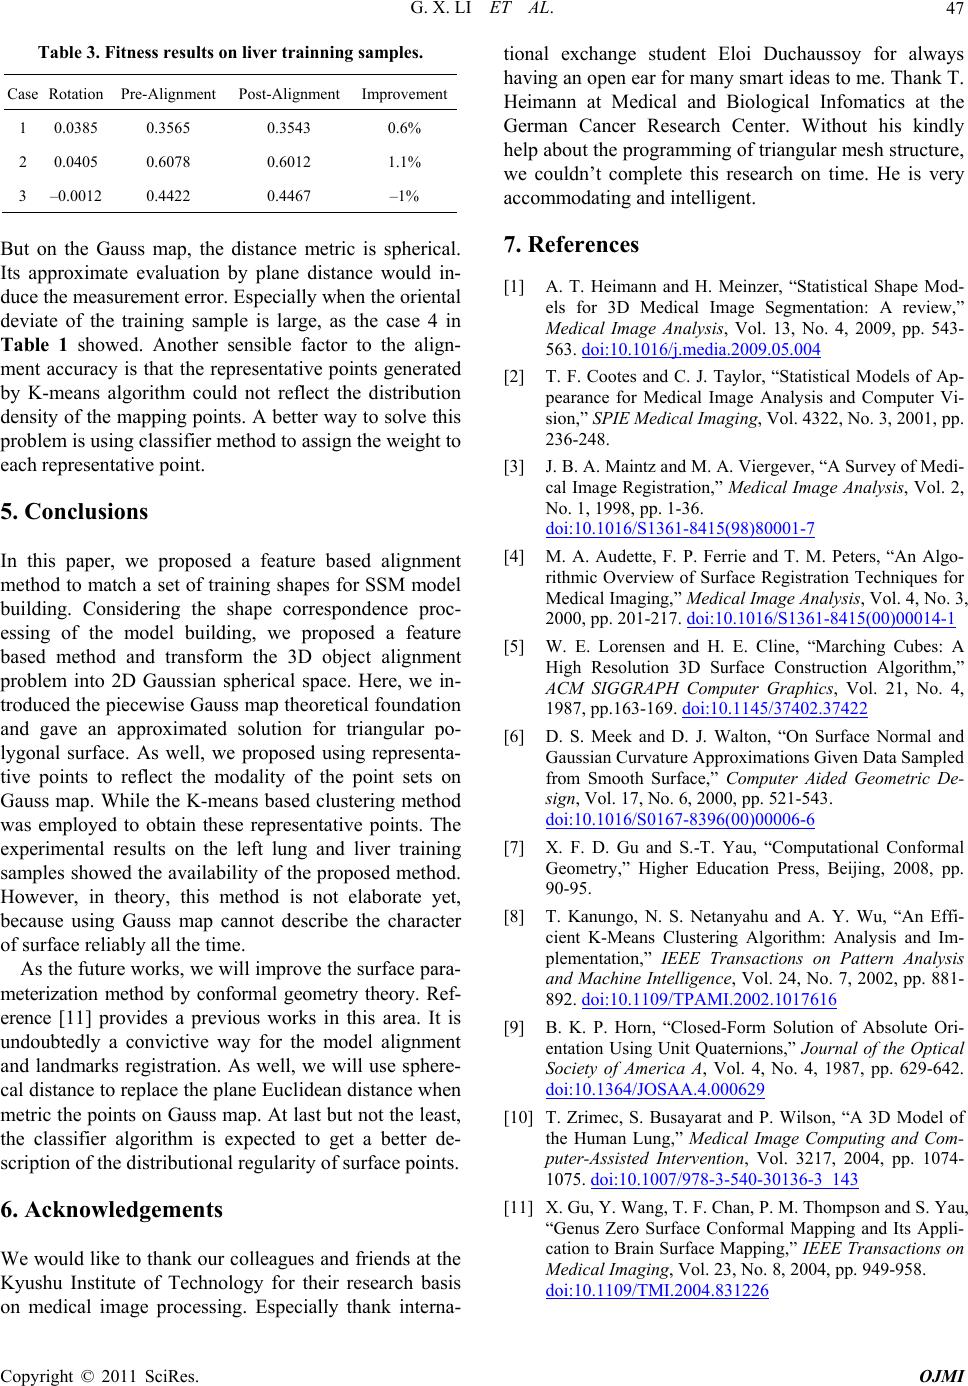
ble 3. Fs resultsr trainnples.
aseotation Alignmen-Alignment rovem
1 0.0385 0.3565 0.3543 0.6%
2 0.0405 0.6078 0.6012 1.1%
3 –0.0012 0.4422 0.4467 –1%
Buss me distance metric is spherical.
te evaluation by plane distance w in-
proposed a feature based alignment
set of training shapes for SSM model
olleagues and friends at the
ogy for their research
on medical image processing. Especially thank interna-
, “Statistical Shape Mod-
edical Image Segmentation: A review,”
Analysis, Vol. 13, No. 4, 2009, pp. 543-
t on the Gau
proxima
ap, th
Its ap
d
ould
uce the measurement error. Especially when the oriental
deviate of the training sample is large, as the case 4 in
Table 1 showed. Another sensible factor to the align-
ment accuracy is that the representative points generated
by K-means algorithm could not reflect the distribution
density of the mapping points. A better way to solve this
problem is using classifier method to assign the weight to
each representative point.
5. Conclusions
In this paper, we
method to match a
building. Considering the shape correspondence proc-
essing of the model building, we proposed a feature
based method and transform the 3D object alignment
problem into 2D Gaussian spherical space. Here, we in-
troduced the piecewise Gauss map theoretical foundation
and gave an approximated solution for triangular po-
lygonal surface. As well, we proposed using representa-
tive points to reflect the modality of the point sets on
Gauss map. While the K-means based clustering method
was employed to obtain these representative points. The
experimental results on the left lung and liver training
samples showed the availability of the proposed method.
However, in theory, this method is not elaborate yet,
because using Gauss map cannot describe the character
of surface reliably all the time.
As the future works, we will improve the surface para-
meterization method by conformal geometry theory. Ref-
erence [11] provides a previous works in this area. It is
undoubtedly a convictive way for the model alignment
and landmarks registration. As well, we will use sphere-
cal distance to replace the plane Euclidean distance when
metric the points on Gauss map. At last but not the least,
the classifier algorithm is expected to get a better de-
scription of the distributional regularity of surface points.
6. Acknowledgements
We would like to thank our c
Kyushu Institute of Technolbasis
tional exchange student Eloi Duchaussoy for always
having an open ear for many smart ideas to me. Thank T.
Heimann at Medical and Biological Infomatics at the
German Cancer Research Center. Without his kindly
help about the programming of triangular mesh structure,
we couldn’t complete this research on time. He is very
accommodating and intelligent.
7. References
[1] A. T. Heimann and H. Meinzer
els for 3D M
Medical Image
563. doi:10.1016/j.media.2009.05.004
[2] T. F. Cootes and C. J. Taylor, “Statistical Models of Ap-
pearance for Medical Image Analysis and Computer Vi-
sion,” SPIE Medical Imaging, Vol. 4322, No. 3, 2001, pp.
pp. 1-36.
236-248.
[3] J. B. A. Maintz and M. A. Viergever, “A Survey of Medi-
cal Image Registration,” Medical Image Analysis, Vol. 2,
No. 1, 1998,
doi:10.1016/S1361-8415(98)80001-7
[4] M. A. Audette, F. P. Ferrie and T. M. Peters, “An Algo-
rithmic Overview of Su
Medical Imaging,” Medical Image Ana
rface Registration Techniques for
lysis, Vol. 4, No. 3,
2000, pp. 201-217. doi:10.1016/S1361-8415(00)00014-1
[5] W. E. Lorensen and H. E. Cline, “Marching Cubes: A
High Resolution 3D Surface Construction Algorithm,”
ACM SIGGRAPH Computer Graphics, Vol. 21, No. 4,
1987, pp.163-169. doi:10.1145/37402.37422
[6] D. S. Meek and D. J. Walton, “On Surface Normal and
Gaussian Curvature Approximations Given Data Sampled
from Smooth Surface,” Computer Aided Geometric De-
sign, Vol. 17, No. 6, 2000, pp. 521-543.
doi:10.1016/S0167-8396(00)00006-6
[7] X. F. D. Gu and S.-T. Yau, “Computational Conformal
Geometry,” Higher Education Press, Be
90-95.
ijing, 2008, pp.
ation,” IEEE Transactions on Pattern Analysis
[8] T. Kanungo, N. S. Netanyahu and A. Y. Wu, “An Effi-
cient K-Means Clustering Algorithm: Analysis and Im-
plement
and Machine Intelligence, Vol. 24, No. 7, 2002, pp. 881-
892. doi:10.1109/TPAMI.2002.1017616
[9] B. K. P. Horn, “Closed-Form Solution of Absolute Ori-
entation Using Unit Quaternions,” Journal of the Optical
Society of America A, Vol. 4, No. 4, 1987, pp. 629-642.
doi:10.1364/JOSAA.4.000629
[10] T. Zrimec, S. Busayarat and P. Wilson, “A 3D Model of
the Human Lung,” Medical Image Computing and Com-
puter-Assisted Intervention, Vol. 3217, 2004, pp. 1074-
1075. doi:10.1007/978-3-540-30136-3_143
[11] X. Gu, Y. Wang, T. F. Chan, P. M. Thompson and S. Yau,
“Genus Zero Surface Conformal Mapping and Its Appli-
cation to Brain Surface Mapping,” IEEE Transactions on
Medical Imaging, Vol. 23, No. 8, 2004, pp. 949-958.
doi:10.1109/TMI.2004.831226