 World Journal of Nano Science and Engineering, 2011, 1, 129-136 doi:10.4236/wjnse.2011.14019 Published Online December 2011 (http://www.SciRP.org/journal/wjnse) Copyright © 2011 SciRes. WJNSE A Highly Efficient and Stable Visible-Light Plasmonic Photocatalyst Ag-AgCl/CeO2 Hongjuan Wang, Lin Yang, Hao Yu, Feng Peng* The School of Chemistry and Chemical Engineering, South China University of Technology, Guangzhou, China E-mail: *cefpeng@scut.edu.cn Received September 15, 2011; revised September 27, 2011; accepted October 29, 2011 Abstract Noble metal Ag nanoparticles with unique surface plasmon resonance property have attracted much attention recently in the field of photocatalysis. Based on the advantages of Ag nanoparticles and semiconductor CeO2, a novel plasmonic photocatalyst Ag-AgCl/CeO2 was prepared with a facile route. The as-prepared samples were characterized using scanning and transmission electron microscopy, X-ray photoelectron spectroscopy and UV-vis diffusion reflection spectroscopy. This metal-semiconductor nanocomposite plasmonic photo- catalyst exhibited a high visible-light photocatalytic activity and good stability for photocatalytic degradation of methyl orange in water. Ag-AgCl/CeO2 will be a potentially promising plasmonic photocatalysts for or- ganic pollutant degradation and water purification. Keywords: Plasmonic Photocatalyst, Ag Nanoparticle, AgCl, Visible Light, Photocatalytic Degradation 1. Introduction Due to its high efficiency, low cost and availability, TiO2 has appeared as a leading photocatalyst candidate since 1970s [1]. However, TiO2 can only absorb UV light due to its high band gap energy and then cause its low effi- cient utilization of solar energy [2-7]. During the last decade, a considerable number of new photocatalytic materials have been proposed as potential substitutes of TiO2 [8]. CeO2, as an n-type semiconductor, is one of them. With a band-gap of 2.9 - 3.2 eV, it has some prop- erties like titania, such as nontoxicity and high stability [9,10]. So far, CeO2 are mainly applied in solid oxide fuel cells, oxygen gas sensors, fluorescent materials, metal oxide semiconductor devices, and three way cata- lysts in vehicle emission control systems and ultraviolet blocking materials, etc. [11-13]. As a potential photoca- talyst for the oxidation of pollutants, CeO2 is less active than TiO2 under UV irradiation [14-16]. But it can be ac- tivated by visible light [8]. Noble-metal nanoparticles (NPs) can give strong visi- blelight absorption because of their size- and shape-de- pendent plasmon resonance [17]. In particular, Ag NPs show efficient surface plasmon resonance (SPR), which can dramatically enhance the photocatalysts’ absorption in the visible region [18,19]. This character has been utilized to develop a plasmonic photocatalyst, which has become a hotspot in the field of photocatalyst in recent years. In some researchers’ work, noble metal nanoparti= cles were doped in semi-conductors or combined with other non-photoelectric response materials to increase their photocatalytic performance under visible light. In Awazu’s report [18], Ag/SiO2/TiO2 plasmonic photoca- talyst was constructed with Ag NPs as core and the silica as shell to prevent oxidation of Ag by direct contact with TiO2. The results showed that the degradation rate of methylene blue (MB) was greatly boosted by the assis- tance of the SPR effect of the contacted silver nanoparticles under near-UV irradiation. Sun et al. [20] demonstrated that Ag@C core/shell nanocomposite synthesized by a hydrothermal process was photoactive in destroying aqu- eous tetraethylated rhodamine (RhB) and gaseous acet- aldehyde (CH3CHO) under visible-light irradiation. Be- sides using Ag NPs, silver halides were also used in the plasmonic photocatalyst [21]. Wang et al. [22-25] utili- zed the silver halides to develop Ag@AgX plasmonic photocatalysts with high activity and stability under visi- ble light. The improved photocatalytic activity of the sil- ver halides was attributed to the plasmon resonance of Ag NPs from Ag halides reduced on the surface under ir- radiation [26]. Hu et al. [27-29] prepared Ag-AgBr/TiO2, Ag/AgBr/Al2O3 and Ag/AgI/Al2O3 plasmonic photocata- lyst by deposition-precipitation and photor-eduction method to destruct azodyes and bacteria under visible light. On 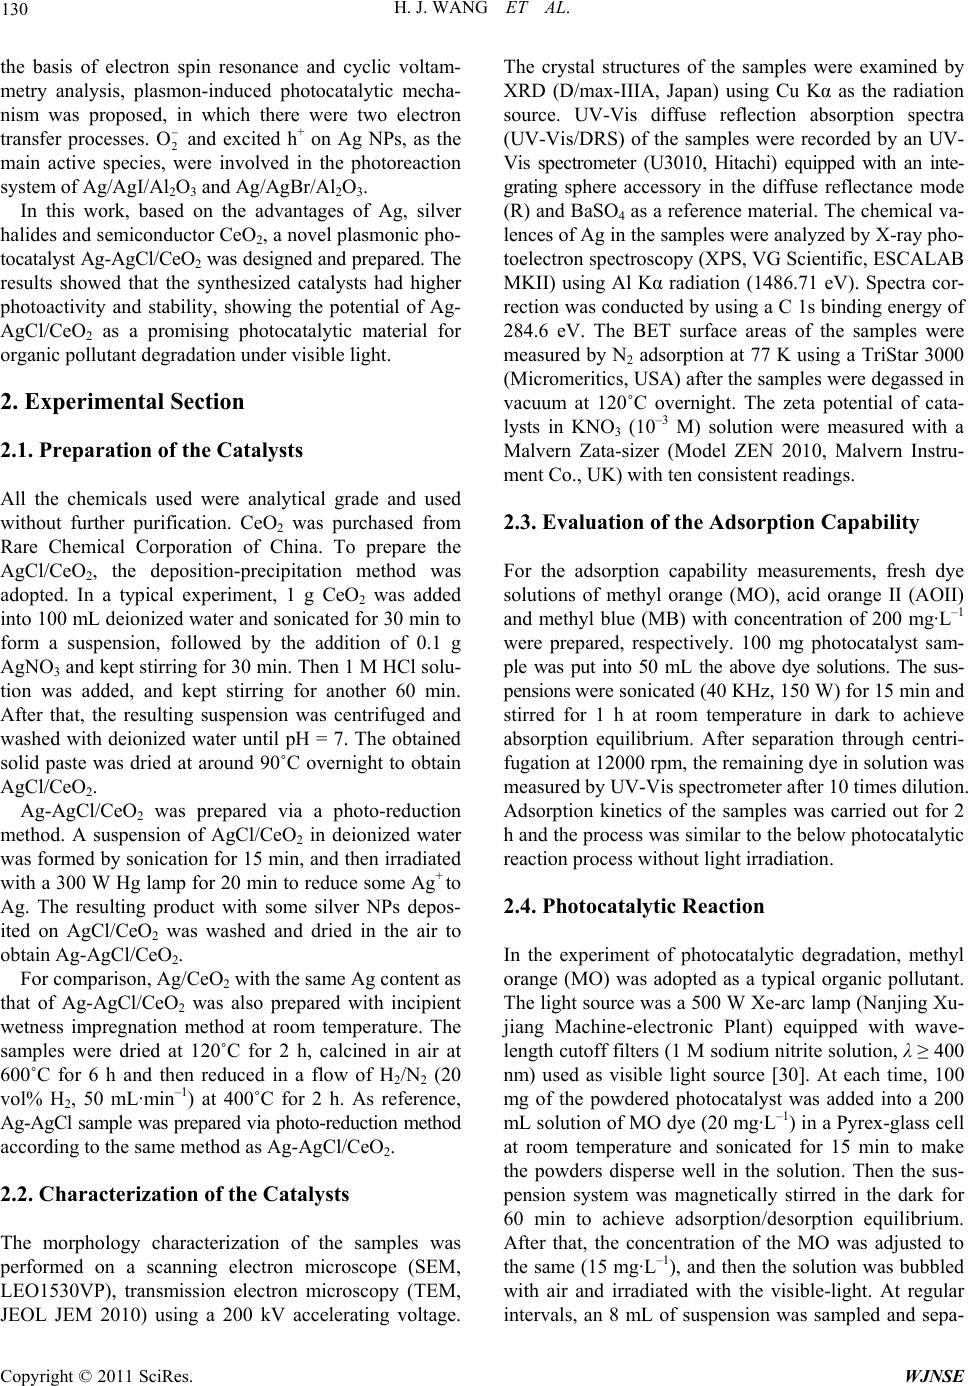 H. J. WANG ET AL. 130 the basis of electron spin resonance and cyclic voltam- metry analysis, plasmon-induced photocatalytic mecha- nism was proposed, in which there were two electron transfer processes.2and excited h+ on Ag NPs, as the main active species, were involved in the photoreaction system of Ag/AgI/Al2O3 and Ag/AgBr/Al2O3. O In this work, based on the advantages of Ag, silver halides and semiconductor CeO2, a novel plasmonic pho- tocatalyst Ag-AgCl/CeO2 was designed and prepared. The results showed that the synthesized catalysts had higher photoactivity and stability, showing the potential of Ag- AgCl/CeO2 as a promising photocatalytic material for organic pollutant degradation under visible light. 2. Experimental Section 2.1. Preparation of the Catalysts All the chemicals used were analytical grade and used without further purification. CeO2 was purchased from Rare Chemical Corporation of China. To prepare the AgCl/CeO2, the deposition-precipitation method was adopted. In a typical experiment, 1 g CeO2 was added into 100 mL deionized water and sonicated for 30 min to form a suspension, followed by the addition of 0.1 g AgNO3 and kept stirring for 30 min. Then 1 M HCl solu- tion was added, and kept stirring for another 60 min. After that, the resulting suspension was centrifuged and washed with deionized water until pH = 7. The obtained solid paste was dried at around 90˚C overnight to obtain AgCl/CeO2. Ag-AgCl/CeO2 was prepared via a photo-reduction method. A suspension of AgCl/CeO2 in deionized water was formed by sonication for 15 min, and then irradiated with a 300 W Hg lamp for 20 min to reduce some Ag+ to Ag. The resulting product with some silver NPs depos- ited on AgCl/CeO2 was washed and dried in the air to obtain Ag-AgCl/CeO2. For comparison, Ag/CeO2 with the same Ag content as that of Ag-AgCl/CeO2 was also prepared with incipient wetness impregnation method at room temperature. The samples were dried at 120˚C for 2 h, calcined in air at 600˚C for 6 h and then reduced in a flow of H2/N2 (20 vol% H2, 50 mL·min–1) at 400˚C for 2 h. As reference, Ag-AgCl sample was prepared via photo-reduction method according to the same method as Ag-AgCl/CeO2. 2.2. Characterization of the Catalysts The morphology characterization of the samples was performed on a scanning electron microscope (SEM, LEO1530VP), transmission electron microscopy (TEM, JEOL JEM 2010) using a 200 kV accelerating voltage. The crystal structures of the samples were examined by XRD (D/max-IIIA, Japan) using Cu Kα as the radiation source. UV-Vis diffuse reflection absorption spectra (UV-Vis/DRS) of the samples were recorded by an UV- Vis spectrometer (U3010, Hitachi) equipped with an inte- grating sphere accessory in the diffuse reflectance mode (R) and BaSO4 as a reference material. The chemical va- lences of Ag in the samples were analyzed by X-ray pho- toelectron spectroscopy (XPS, VG Scientific, ESCALAB MKII) using Al Kα radiation (1486.71 eV). Spectra cor- rection was conducted by using a C 1s binding energy of 284.6 eV. The BET surface areas of the samples were measured by N2 adsorption at 77 K using a TriStar 3000 (Micromeritics, USA) after the samples were degassed in vacuum at 120˚C overnight. The zeta potential of cata- lysts in KNO3 (10–3 M) solution were measured with a Malvern Zata-sizer (Model ZEN 2010, Malvern Instru- ment Co., UK) with ten consistent readings. 2.3. Evaluation of the Adsorption Capability For the adsorption capability measurements, fresh dye solutions of methyl orange (MO), acid orange II (AOII) and methyl blue (MB) with concentration of 200 mg·L–1 were prepared, respectively. 100 mg photocatalyst sam- ple was put into 50 mL the above dye solutions. The sus- pensions were sonicated (40 KHz, 150 W) for 15 min and stirred for 1 h at room temperature in dark to achieve absorption equilibrium. After separation through centri- fugation at 12000 rpm, the remaining dye in solution was measured by UV-Vis spectrometer after 10 times dilution. Adsorption kinetics of the samples was carried out for 2 h and the process was similar to the below photocatalytic reaction process without light irradiation. 2.4. Photocatalytic Reaction In the experiment of photocatalytic degradation, methyl orange (MO) was adopted as a typical organic pollutant. The light source was a 500 W Xe-arc lamp (Nanjing Xu- jiang Machine-electronic Plant) equipped with wave- length cutoff filters (1 M sodium nitrite solution, λ ≥ 400 nm) used as visible light source [30]. At each time, 100 mg of the powdered photocatalyst was added into a 200 mL solution of MO dye (20 mg·L–1) in a Pyrex-glass cell at room temperature and sonicated for 15 min to make the powders disperse well in the solution. Then the sus- pension system was magnetically stirred in the dark for 60 min to achieve adsorption/desorption equilibrium. After that, the concentration of the MO was adjusted to the same (15 mg·L–1), and then the solution was bubbled with air and irradiated with the visible-light. At regular intervals, an 8 mL of suspension was sampled and sepa- Copyright © 2011 SciRes. WJNSE  H. J. WANG ET AL. Copyright © 2011 SciRes. WJNSE 131 rated by centrifugation at 12,000 rpm for 10 min. The concentration of the remaining MO was measured by its absorbance (A) at 465 nm with a Hitachi UV-3010 spec- trophotometer. The degradation ratio of MO was calcu- lated by X = (A0 – A)/A0 × 100%. particles. Figure 2 shows the SEM, TEM and EDS results of the prepared Ag-AgCl/CeO2. According to Figure 2 (a) and (b), CeO2 presents a porous structure and Ag/AgCl NPs disperse well on the surface of CeO2 with diameter in the range of 10 - 30 nm. To demonstrate the formation of silver nanoparticles on silver chloride nanoparticles, 3. Results and Discussion 3.1. Morphology and Structures of the Samples 20 30 40 50 60 70 80 Intensity (a.u.) ★★ ◆ ◆◆ ▼ ★ 2 Theta o a b c d ★ CeO2 ◆ AgCl ▼Ag Figure 1 displays the XRD patterns of the prepared AgCl, CeO2, AgCl/CeO2 and Ag-AgCl/CeO2 samples. Figures 1(a) and (b) exhibit the characteristic diffract- tion peaks of AgCl (JCPDS file No. 31-1238) and CeO2 (JCPDS file No. 43-1002), respectively. Compared with Figure 1(b), additional peaks appear in Figure 1(c), which can be attributed to the cubic phase of AgCl, indi- cating that a crystalline cubic phase AgCl was formed on CeO2. After irradiation with mercury lamp, the diffract- tion peak of metallic Ag (JCPDS file No. 65-2871) ap- pears in Figure 1d due to the photo-reduction of some Ag+ in AgCl to Ag0. The reduced Ag atoms aggregate to form small silver nanocrystals with the cubic phase of Ag (111) located at 38.1˚, corresponding to 2.36 Å of lattice space, and then deposit on the surface of AgCl Figure 1. XRD patterns of AgCl (a); CeO2 (b); AgCl/CeO2 (c); and Ag-AgCl/CeO2 (d). Figure 2. SEM (a) and TEM; (b ) and HRTEM; (c) Images and EDS; (d) Pattern of Ag-AgCl/CeO2.  H. J. WANG ET AL. 132 high resolution-TEM analysis was shown in Figure 2(c). Some lattice stripes with different orienttations could be observed clearly in Figure 2(c). The characteristic values of lattice constant are 2.36, 2.78 and 3.12 Å correspond- ing to Ag (111), AgCl (200) and CeO2 (111), respect- tively, which are coincident with the strong diffraction peaks of Ag, AgCl and CeO2 from XRD results. The energy dispersive X-ray spectroscopy (EDS), as shown in Figure 2(d), also confirmed the existence of Ce, O, Ag and Cl in Ag-AgCl/CeO2, and the atomic percentages (%) of Ag and Cl in Ag/AgCl/CeO2 sample is about 0.68 and 0.41. The atomic radio of Ag: Cl > 1, which further confirmed that the process of Ag+ reducetion to Ag0 happened and some Ag0 existed in the form of metallic Ag. The chemical status of Ag from AgCl/CeO2 and Ag-AgCl/CeO2 were further analyzed by XPS, as shown in Figure 3. Before irradiation, the Ag 3d5/2 and Ag 3d3/2 appear at the binding energies of 373.6 eV and 367.6 eV, respectively. After irradiation, the corresponding peaks shift to the binding energies of 373.3 eV and 367.3 eV, respectively. The difference of Ag 3d binding energy between AgCl/CeO2 and Ag-AgCl/CeO2 is attributed to the metallic Ag in the Ag-AgCl/CeO2 [31]. The UV-Vis diffuse-reflectance spectra of CeO2, AgCl/ CeO2 and Ag-AgCl/CeO2 were compared in Figure 4. The CeO2 (Figure 4 (a)) only exhibits a weak absorption in the visible light region around 400 nm - 450 nm. The addition of AgCl doesn’t enhance the absorption of CeO2 due to the large band gaps of AgCl with a direct band gap of 5.15 eV (241 nm) and an indirect band gap of 3.25 eV (382 nm) [32] (Figure 4(b)). In contrast to AgCl/CeO2 and CeO2, Ag-AgCl/CeO2 has a strong ad- sorption in the visible region of 400 - 700 nm (Figure 4(c)), which is attributed to the plasmonic resonance of Ag NPs deposited on AgCl/CeO2 particles. It also further confirmed the formation of Ag NPs in the as-synthesized Ag-AgCl/CeO2 catalyst. On the basis of the above XRD, EDS, XPS, UV-Vis, SEM and TEM analysis, it can be confirmed that Ag- AgCl NPs deposited uniformly on the surface of CeO2 and that some Ag+ in AgCl was reduced to Ag0 and thus Ag0 and AgCl coexist in the Ag-AgCl/CeO2 catalyst. 3.2. The Adsorption Behaviors of Samples Figure 5 shows the adsorption kinetics of the catalysts to MO. After 30 min, all of the catalysts almost reach ad- sorption equilibrium. After 2 hours, about 29% of MO was adsorbed onto Ag-AgCl/CeO2. Under the same condition, about 83%, 63% and 33% of MO were adsorbed onto AgCl/CeO2, Ag/CeO2 and CeO2, respectively. AgCl/CeO2 shows the strongest adsorption capability to MO. 366 368 370 372 374 376 378 373.3 eV 367.3 eV373.6 eV Relative intensity (a.u.) Binding Energy (eV) 3d5/2 3d3/2 a b 367.6 eV Figure 3. XPS spectra of Ag 3d of Ag-AgCl/CeO2 (a) and AgCl/CeO2 (b). 200 300 400 500 600 700 0.0 0.5 1.0 1.5 Absorbance (a.u.) Wavelength (nm) a b c Figure 4. UV-Vis diffuse-reflectance spectra of CeO2 (a); AgCl/CeO2 (b) and Ag-AgCl/CeO2 (c). 0 20406080100120 0 20 40 60 80 100 CeO2 AgCl/ CeO2 (C0-C)/C0*100% Time (min) Ag/CeO2 Ag-AgCl/CeO2 Figure 5. Adsorption kinetics of MO on the catalysts in dark. Copyright © 2011 SciRes. WJNSE 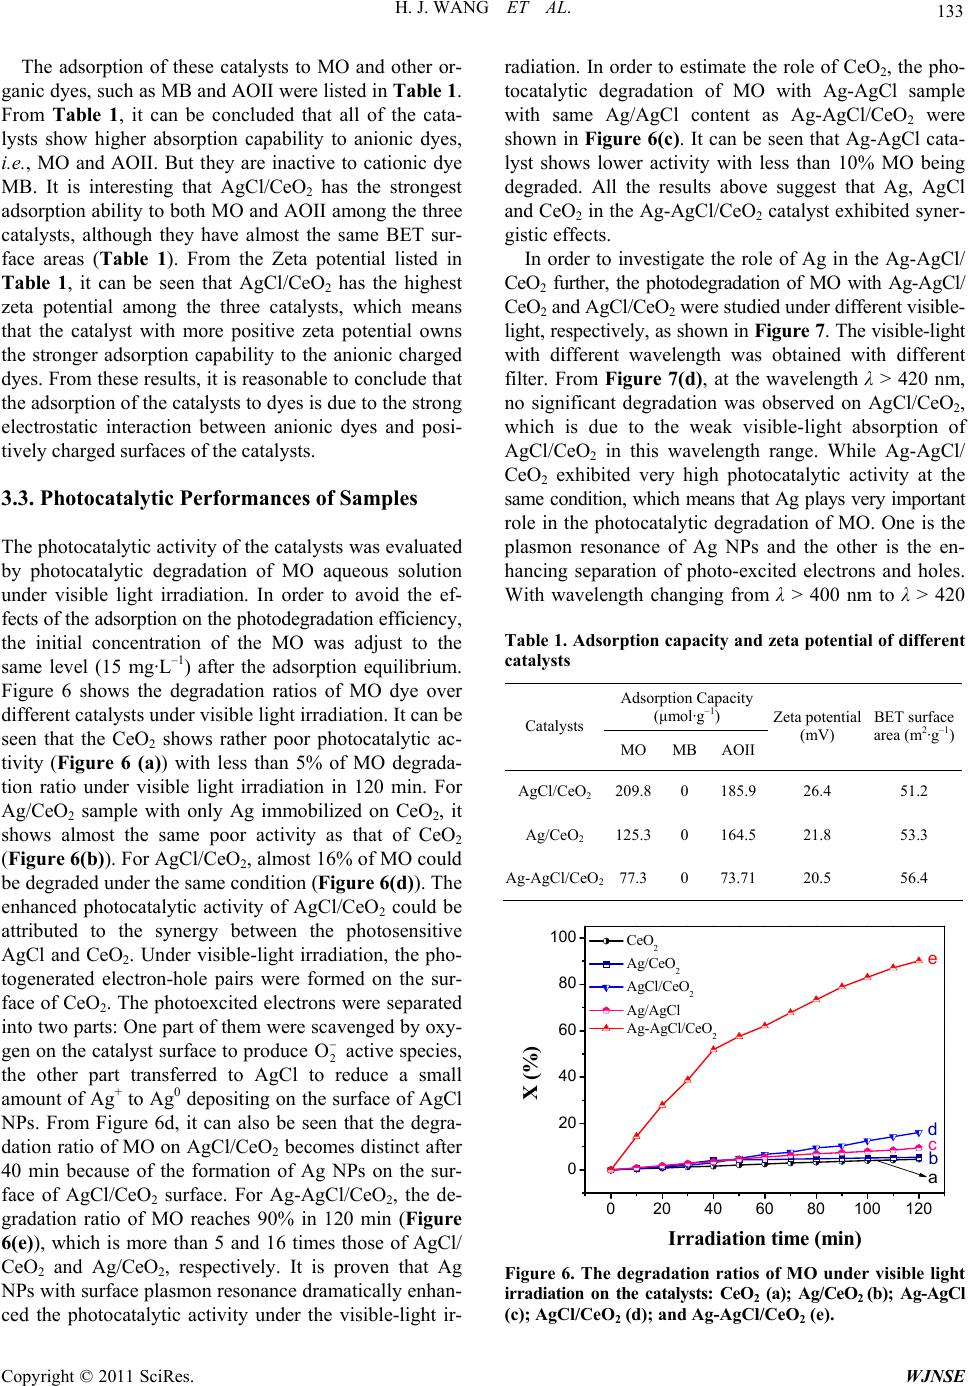 133 H. J. WANG ET AL. The adsorption of these catalysts to MO and other or- ganic dyes, such as MB and AOII were listed in Table 1. From Table 1, it can be concluded that all of the cata- lysts show higher absorption capability to anionic dyes, i.e., MO and AOII. But they are inactive to cationic dye MB. It is interesting that AgCl/CeO2 has the strongest adsorption ability to both MO and AOII among the three catalysts, although they have almost the same BET sur- face areas (Table 1). From the Zeta potential listed in Table 1, it can be seen that AgCl/CeO2 has the highest zeta potential among the three catalysts, which means that the catalyst with more positive zeta potential owns the stronger adsorption capability to the anionic charged dyes. From these results, it is reasonable to conclude that the adsorption of the catalysts to dyes is due to the strong electrostatic interaction between anionic dyes and posi- tively charged surfaces of the catalysts. 3.3. Photocatalytic Performances of Samples The photocatalytic activity of the catalysts was evaluated by photocatalytic degradation of MO aqueous solution under visible light irradiation. In order to avoid the ef- fects of the adsorption on the photodegradation efficiency, the initial concentration of the MO was adjust to the same level (15 mg·L–1) after the adsorption equilibrium. Figure 6 shows the degradation ratios of MO dye over different catalysts under visible light irradiation. It can be seen that the CeO2 shows rather poor photocatalytic ac- tivity (Figure 6 (a)) with less than 5% of MO degrada- tion ratio under visible light irradiation in 120 min. For Ag/CeO2 sample with only Ag immobilized on CeO2, it shows almost the same poor activity as that of CeO2 (Figure 6(b)). For AgCl/CeO2, almost 16% of MO could be degraded under the same condition (Figure 6(d)). The enhanced photocatalytic activity of AgCl/CeO2 could be attributed to the synergy between the photosensitive AgCl and CeO2. Under visible-light irradiation, the pho- togenerated electron-hole pairs were formed on the sur- face of CeO2. The photoexcited electrons were separated into two parts: One part of them were scavenged by oxy- gen on the catalyst surface to produce2active species, the other part transferred to AgCl to reduce a small amount of Ag+ to Ag0 depositing on the surface of AgCl NPs. From Figure 6d, it can also be seen that the degra- dation ratio of MO on AgCl/CeO2 becomes distinct after 40 min because of the formation of Ag NPs on the sur- face of AgCl/CeO2 surface. For Ag-AgCl/CeO2, the de- gradation ratio of MO reaches 90% in 120 min (Figure 6(e)), which is more than 5 and 16 times those of AgCl/ CeO2 and Ag/CeO2, respectively. It is proven that Ag NPs with surface plasmon resonance dramatically enhan- ced the photocatalytic activity under the visible-light ir- radiation. In order to estimate the role of CeO2, the pho- tocatalytic degradation of MO with Ag-AgCl sample with same Ag/AgCl content as Ag-AgCl/CeO2 were shown in Figure 6(c). It can be seen that Ag-AgCl cata- lyst shows lower activity with less than 10% MO being degraded. All the results above suggest that Ag, AgCl and CeO2 in the Ag-AgCl/CeO2 catalyst exhibited syner- gistic effects. O In order to investigate the role of Ag in the Ag-AgCl/ CeO2 further, the photodegradation of MO with Ag-AgCl/ CeO2 and AgCl/CeO2 were studied under different visible- light, respectively, as shown in Figure 7. The visible-light with different wavelength was obtained with different filter. From Figure 7(d), at the wavelength λ > 420 nm, no significant degradation was observed on AgCl/CeO2, which is due to the weak visible-light absorption of AgCl/CeO2 in this wavelength range. While Ag-AgCl/ CeO2 exhibited very high photocatalytic activity at the same condition, which means that Ag plays very important role in the photocatalytic degradation of MO. One is the plasmon resonance of Ag NPs and the other is the en- hancing separation of photo-excited electrons and holes. With wavelength changing from λ > 400 nm to λ > 420 Table 1. Adsorption capacity and zeta potential of different catalysts Adsorption Capacity (μmol ·g –1) Catalysts MOMBAOII Zeta potential (mV) BET surface area (m2·g–1) AgCl/CeO2209.80 185.9 26.4 51.2 Ag/CeO2 125.30 164.5 21.8 53.3 Ag-AgCl/CeO277.30 73.71 20.5 56.4 020 40 60 80100120 0 20 40 60 80 100 CeO2e Ag/CeO2 AgCl/CeO2 Ag/AgCl d c b X (%) Irradiation time (min) Ag-AgCl/CeO2 a Figure 6. The degradation ratios of MO under visible light irradiation on the catalysts: CeO2 (a); Ag/CeO2 (b); Ag-AgCl (c); AgCl/CeO2 (d); and Ag-AgCl/CeO2 (e). Copyright © 2011 SciRes. WJNSE 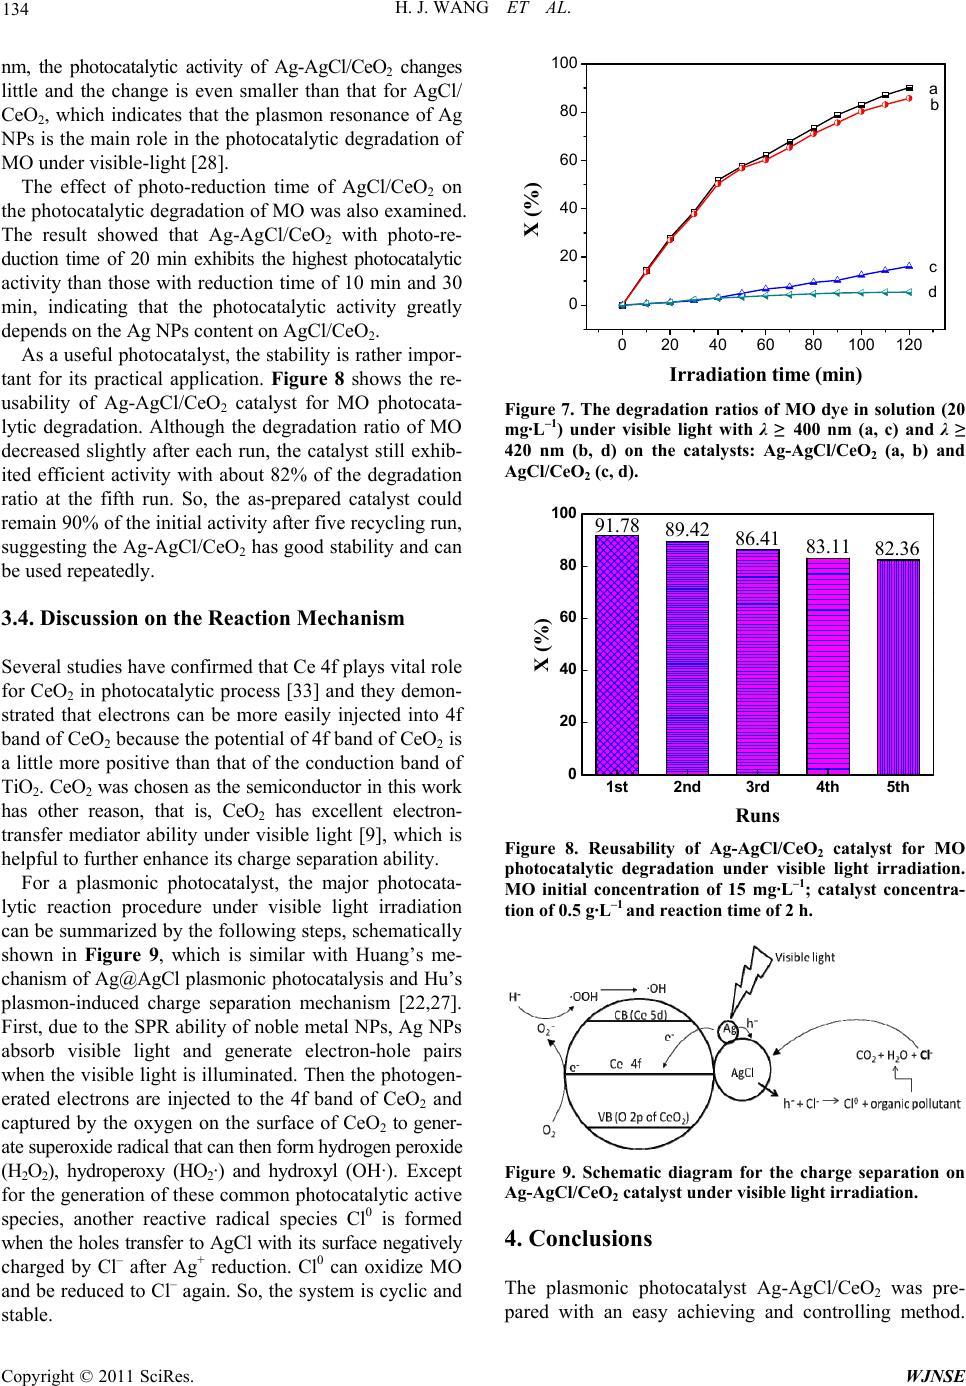 H. J. WANG ET AL. 134 nm, the photocatalytic activity of Ag-AgCl/CeO2 changes little and the change is even smaller than that for AgCl/ CeO2, which indicates that the plasmon resonance of Ag NPs is the main role in the photocatalytic degradation of MO under visible-light [28]. The effect of photo-reduction time of AgCl/CeO2 on the photocatalytic degradation of MO was also examined. The result showed that Ag-AgCl/CeO2 with photo-re- duction time of 20 min exhibits the highest photocatalytic activity than those with reduction time of 10 min and 30 min, indicating that the photocatalytic activity greatly depends on the Ag NPs content on AgCl/CeO2. As a useful photocatalyst, the stability is rather impor- tant for its practical application. Figure 8 shows the re- usability of Ag-AgCl/CeO2 catalyst for MO photocata- lytic degradation. Although the degradation ratio of MO decreased slightly after each run, the catalyst still exhib- ited efficient activity with about 82% of the degradation ratio at the fifth run. So, the as-prepared catalyst could remain 90% of the initial activity after five recycling run, suggesting the Ag-AgCl/CeO2 has good stability and can be used repeatedly. 3.4. Discussion on the Reaction Mechanism Several studies have confirmed that Ce 4f plays vital role for CeO2 in photocatalytic process [33] and they demon- strated that electrons can be more easily injected into 4f band of CeO2 because the potential of 4f band of CeO2 is a little more positive than that of the conduction band of TiO2. CeO2 was chosen as the semiconductor in this work has other reason, that is, CeO2 has excellent electron- transfer mediator ability under visible light [9], which is helpful to further enhance its charge separation ability. For a plasmonic photocatalyst, the major photocata- lytic reaction procedure under visible light irradiation can be summarized by the following steps, schematically shown in Figure 9, which is similar with Huang’s me- chanism of Ag@AgCl plasmonic photocatalysis and Hu’s plasmon-induced charge separation mechanism [22,27]. First, due to the SPR ability of noble metal NPs, Ag NPs absorb visible light and generate electron-hole pairs when the visible light is illuminated. Then the photogen- erated electrons are injected to the 4f band of CeO2 and captured by the oxygen on the surface of CeO2 to gener- ate superoxide radical that can then form hydrogen peroxide (H2O2), hydroperoxy (HO2·) and hydroxyl (OH·). Except for the generation of these common photocatalytic active species, another reactive radical species Cl0 is formed when the holes transfer to AgCl with its surface negatively charged by Cl– after Ag+ reduction. Cl0 can oxidize MO and be reduced to Cl– again. So, the system is cyclic and stable. 020 40 60 80100120 0 20 40 60 80 100 X (%) Irradiation time (min) a b c d Figure 7. The degradation ratios of MO dye in solution (20 mg·L–1) under visible light with λ ≥ 400 nm (a, c) and λ ≥ 420 nm (b, d) on the catalysts: Ag-AgCl/CeO2 (a, b) and AgCl/CeO2 (c, d). 1st2nd 3rd4th5th 0 20 40 60 80 100 X (%) Runs 82.36 83.11 86.41 89.42 91.78 Figure 8. Reusability of Ag-AgCl/CeO2 catalyst for MO photocatalytic degradation under visible light irradiation. MO initial concentration of 15 mg·L–1; catalyst concentra- tion of 0.5 g·L–1 and reaction time of 2 h. Figure 9. Schematic diagram for the charge separation on Ag-AgCl/CeO2 catalyst under visible light irradiation. 4. Conclusions The plasmonic photocatalyst Ag-AgCl/CeO2 was pre- pared with an easy achieving and controlling method. Copyright © 2011 SciRes. WJNSE 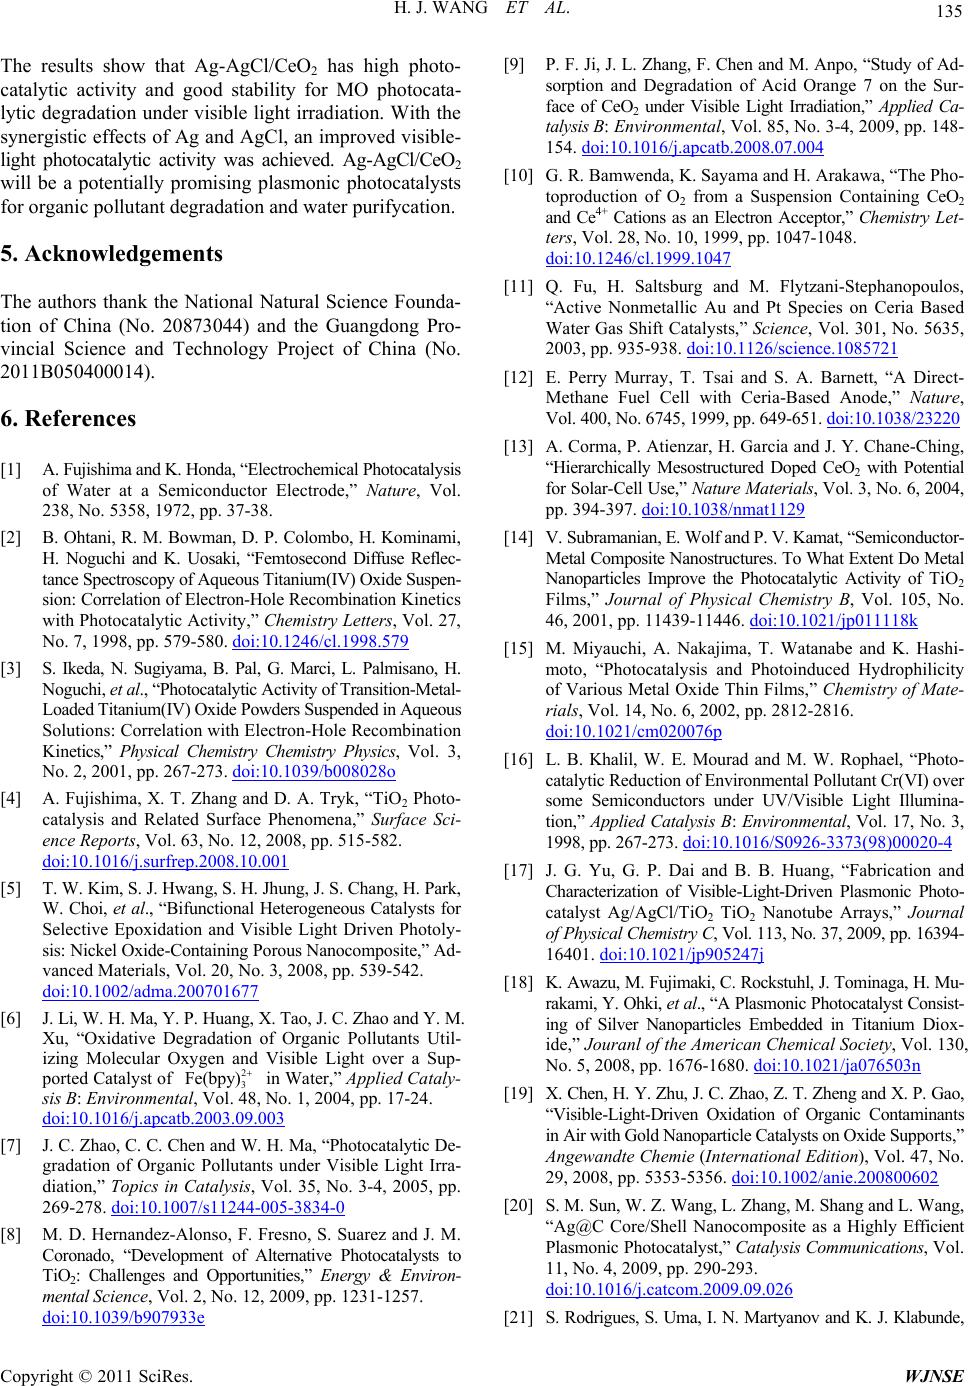 135 H. J. WANG ET AL. The results show that Ag-AgCl/CeO2 has high photo- catalytic activity and good stability for MO photocata- lytic degradation under visible light irradiation. With the synergistic effects of Ag and AgCl, an improved visible- light photocatalytic activity was achieved. Ag-AgCl/CeO2 will be a potentially promising plasmonic photocatalysts for organic pollutant degradation and water purifycation. 5. Acknowledgements The authors thank the National Natural Science Founda- tion of China (No. 20873044) and the Guangdong Pro- vincial Science and Technology Project of China (No. 2011B050400014). 6. References [1] A. Fujishima and K. Honda, “Electrochemical Photocatalysis of Water at a Semiconductor Electrode,” Nature, Vol. 238, No. 5358, 1972, pp. 37-38. [2] B. Ohtani, R. M. Bowman, D. P. Colombo, H. Kominami, H. Noguchi and K. Uosaki, “Femtosecond Diffuse Reflec- tance Spectroscopy of Aqueous Titanium(IV) Oxide Suspen- sion: Correlation of Electron-Hole Recombination Kinetics with Photocatalytic Activity,” Chemistry Letters, Vol. 27, No. 7, 1998, pp. 579-580. doi:10.1246/cl.1998.579 [3] S. Ikeda, N. Sugiyama, B. Pal, G. Marci, L. Palmisano, H. Noguchi, et al., “Photocatalytic Activity of Transition-Metal- Loaded Titanium(IV) Oxide Powders Suspended in Aqueous Solutions: Correlation with Electron-Hole Recombination Kinetics,” Physical Chemistry Chemistry Physics, Vol. 3, No. 2, 2001, pp. 267-273. doi:10.1039/b008028o [4] A. Fujishima, X. T. Zhang and D. A. Tryk, “TiO2 Photo- catalysis and Related Surface Phenomena,” Surface Sci- ence Reports, Vol. 63, No. 12, 2008, pp. 515-582. doi:10.1016/j.surfrep.2008.10.001 [5] T. W. Kim, S. J. Hwang, S. H. Jhung, J. S. Chang, H. Park, W. Choi, et al., “Bifunctional Heterogeneous Catalysts for Selective Epoxidation and Visible Light Driven Photoly- sis: Nickel Oxide-Containing Porous Nanocomposite,” Ad- vanced Materials, Vol. 20, No. 3, 2008, pp. 539-542. doi:10.1002/adma.200701677 [6] J. Li, W. H. Ma, Y. P. Huang, X. Tao, J. C. Zhao and Y. M. Xu, “Oxidative Degradation of Organic Pollutants Util- izing Molecular Oxygen and Visible Light over a Sup- ported Catalyst of 2 3 Fe(bpy) in Water,” Applied Cataly- sis B: Environmental, Vol. 48, No. 1, 2004, pp. 17-24. doi:10.1016/j.apcatb.2003.09.003 [7] J. C. Zhao, C. C. Chen and W. H. Ma, “Photocatalytic De- gradation of Organic Pollutants under Visible Light Irra- diation,” Topics in Catalysis, Vol. 35, No. 3-4, 2005, pp. 269-278. doi:10.1007/s11244-005-3834-0 [8] M. D. Hernandez-Alonso, F. Fresno, S. Suarez and J. M. Coronado, “Development of Alternative Photocatalysts to TiO2: Challenges and Opportunities,” Energy & Environ- mental Science, Vol. 2, No. 12, 2009, pp. 1231-1257. doi:10.1039/b907933e [9] P. F. Ji, J. L. Zhang, F. Chen and M. Anpo, “Study of Ad- sorption and Degradation of Acid Orange 7 on the Sur- face of CeO2 under Visible Light Irradiation,” Applied Ca- talysis B: Environmental, Vol. 85, No. 3-4, 2009, pp. 148- 154. doi:10.1016/j.apcatb.2008.07.004 [10] G. R. Bamwenda, K. Sayama and H. Arakawa, “The Pho- toproduction of O2 from a Suspension Containing CeO2 and Ce4+ Cations as an Electron Acceptor,” Chemistry Let- ters, Vol. 28, No. 10, 1999, pp. 1047-1048. doi:10.1246/cl.1999.1047 [11] Q. Fu, H. Saltsburg and M. Flytzani-Stephanopoulos, “Active Nonmetallic Au and Pt Species on Ceria Based Water Gas Shift Catalysts,” Science, Vol. 301, No. 5635, 2003, pp. 935-938. doi:10.1126/science.1085721 [12] E. Perry Murray, T. Tsai and S. A. Barnett, “A Direct- Methane Fuel Cell with Ceria-Based Anode,” Nature, Vol. 400, No. 6745, 1999, pp. 649-651. doi:10.1038/23220 [13] A. Corma, P. Atienzar, H. Garcia and J. Y. Chane-Ching, “Hierarchically Mesostructured Doped CeO2 with Potential for Solar-Cell Use,” Nature Materials, Vol. 3, No. 6, 2004, pp. 394-397. doi:10.1038/nmat1129 [14] V. Subramanian, E. Wolf and P. V. Kamat, “Semiconductor- Metal Composite Nanostructures. To What Extent Do Metal Nanoparticles Improve the Photocatalytic Activity of TiO2 Films,” Journal of Physical Chemistry B, Vol. 105, No. 46, 2001, pp. 11439-11446. doi:10.1021/jp011118k [15] M. Miyauchi, A. Nakajima, T. Watanabe and K. Hashi- moto, “Photocatalysis and Photoinduced Hydrophilicity of Various Metal Oxide Thin Films,” Chemistry of Mate- rials, Vol. 14, No. 6, 2002, pp. 2812-2816. doi:10.1021/cm020076p [16] L. B. Khalil, W. E. Mourad and M. W. Rophael, “Photo- catalytic Reduction of Environmental Pollutant Cr(VI) over some Semiconductors under UV/Visible Light Illumina- tion,” Applied Catalysis B: Environmental, Vol. 17, No. 3, 1998, pp. 267-273. doi:10.1016/S0926-3373(98)00020-4 [17] J. G. Yu, G. P. Dai and B. B. Huang, “Fabrication and Characterization of Visible-Light-Driven Plasmonic Photo- catalyst Ag/AgCl/TiO2 TiO2 Nanotube Arrays,” Journal of Physical Chemistry C, Vol. 113, No. 37, 2009, pp. 16394- 16401. doi:10.1021/jp905247j [18] K. Awazu, M. Fujimaki, C. Rockstuhl, J. Tominaga, H. Mu- rakami, Y. Ohki, et al., “A Plasmonic Photocatalyst Consist- ing of Silver Nanoparticles Embedded in Titanium Diox- ide,” Jouranl of the American Chemical Society, Vol. 130, No. 5, 2008, pp. 1676-1680. doi:10.1021/ja076503n [19] X. Chen, H. Y. Zhu, J. C. Zhao, Z. T. Zheng and X. P. Gao, “Visible-Light-Driven Oxidation of Organic Contaminants in Air with Gold Nanoparticle Catalysts on Oxide Supports,” Angewandte Chemie (International Edition), Vol. 47, No. 29, 2008, pp. 5353-5356. doi:10.1002/anie.200800602 [20] S. M. Sun, W. Z. Wang, L. Zhang, M. Shang and L. Wang, “Ag@C Core/Shell Nanocomposite as a Highly Efficient Plasmonic Photocatalyst,” Catalysis Communications, Vol. 11, No. 4, 2009, pp. 290-293. doi:10.1016/j.catcom.2009.09.026 [21] S. Rodrigues, S. Uma, I. N. Martyanov and K. J. Klabunde, Copyright © 2011 SciRes. WJNSE 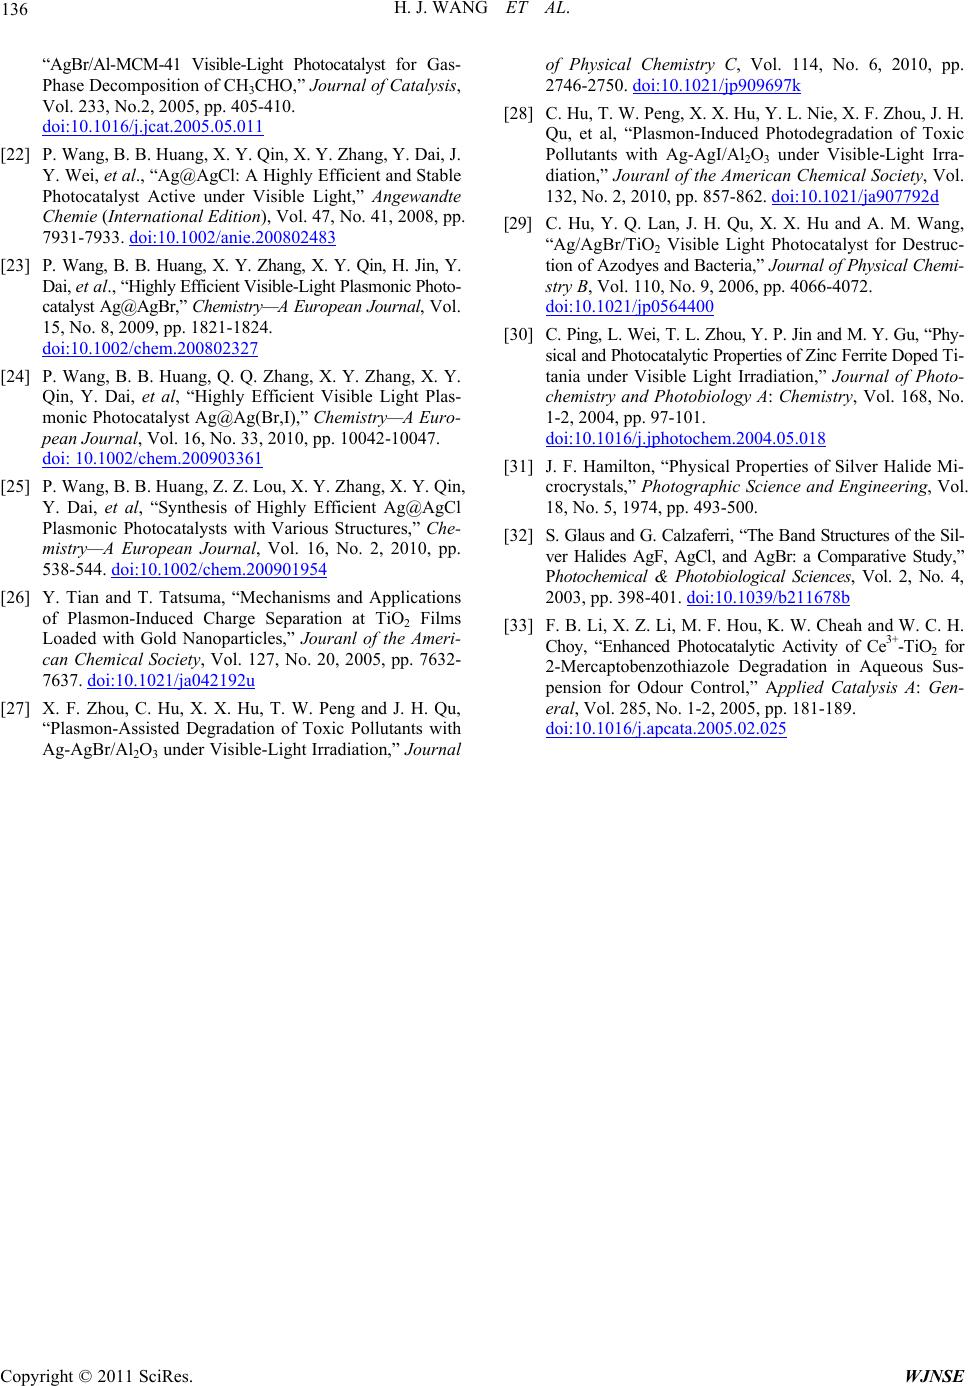 H. J. WANG ET AL. Copyright © 2011 SciRes. WJNSE 136 “AgBr/Al-MCM-41 Visible-Light Photocatalyst for Gas- Phase Decomposition of CH3CHO,” Journal of Catalysis, Vol. 233, No.2, 2005, pp. 405-410. doi:10.1016/j.jcat.2005.05.011 [22] P. Wang, B. B. Huang, X. Y. Qin, X. Y. Zhang, Y. Dai, J. Y. Wei, et al., “Ag@AgCl: A Highly Efficient and Stable Photocatalyst Active under Visible Light,” Angewandte Chemie (International Edition), Vol. 47, No. 41, 2008, pp. 7931-7933. doi:10.1002/anie.200802483 [23] P. Wang, B. B. Huang, X. Y. Zhang, X. Y. Qin, H. Jin, Y. Dai, et al., “Highly Efficient Visible-Light Plasmonic Photo- catalyst Ag@AgBr,” Chemistry—A European Journal, Vol. 15, No. 8, 2009, pp. 1821-1824. doi:10.1002/chem.200802327 [24] P. Wang, B. B. Huang, Q. Q. Zhang, X. Y. Zhang, X. Y. Qin, Y. Dai, et al, “Highly Efficient Visible Light Plas- monic Photocatalyst Ag@Ag(Br,I),” Chemistry—A Euro- pean Journal, Vol. 16, No. 33, 2010, pp. 10042-10047. doi: 10.1002/chem.200903361 [25] P. Wang, B. B. Huang, Z. Z. Lou, X. Y. Zhang, X. Y. Qin, Y. Dai, et al, “Synthesis of Highly Efficient Ag@AgCl Plasmonic Photocatalysts with Various Structures,” Che- mistry—A European Journal, Vol. 16, No. 2, 2010, pp. 538-544. doi:10.1002/chem.200901954 [26] Y. Tian and T. Tatsuma, “Mechanisms and Applications of Plasmon-Induced Charge Separation at TiO2 Films Loaded with Gold Nanoparticles,” Jouranl of the Ameri- can Chemical Society, Vol. 127, No. 20, 2005, pp. 7632- 7637. doi:10.1021/ja042192u [27] X. F. Zhou, C. Hu, X. X. Hu, T. W. Peng and J. H. Qu, “Plasmon-Assisted Degradation of Toxic Pollutants with Ag-AgBr/Al2O3 under Visible-Light Irradiation,” Journal of Physical Chemistry C, Vol. 114, No. 6, 2010, pp. 2746-2750. doi:10.1021/jp909697k [28] C. Hu, T. W. Peng, X. X. Hu, Y. L. Nie, X. F. Zhou, J. H. Qu, et al, “Plasmon-Induced Photodegradation of Toxic Pollutants with Ag-AgI/Al2O3 under Visible-Light Irra- diation,” Jouranl of the American Chemical Society, Vol. 132, No. 2, 2010, pp. 857-862. doi:10.1021/ja907792d [29] C. Hu, Y. Q. Lan, J. H. Qu, X. X. Hu and A. M. Wang, “Ag/AgBr/TiO2 Visible Light Photocatalyst for Destruc- tion of Azodyes and Bacteria,” Journal of Physical Chemi- stry B, Vol. 110, No. 9, 2006, pp. 4066-4072. doi:10.1021/jp0564400 [30] C. Ping, L. Wei, T. L. Zhou, Y. P. Jin and M. Y. Gu, “Phy- sical and Photocatalytic Properties of Zinc Ferrite Doped Ti- tania under Visible Light Irradiation,” Journal of Photo- chemistry and Photobiology A: Chemistry, Vol. 168, No. 1-2, 2004, pp. 97-101. doi:10.1016/j.jphotochem.2004.05.018 [31] J. F. Hamilton, “Physical Properties of Silver Halide Mi- crocrystals,” Photographic Science and Engineering, Vol. 18, No. 5, 1974, pp. 493-500. [32] S. Glaus and G. Calzaferri, “The Band Structures of the Sil- ver Halides AgF, AgCl, and AgBr: a Comparative Study,” Photochemical & Photobiological Sciences, Vol. 2, No. 4, 2003, pp. 398-401. doi:10.1039/b211678b [33] F. B. Li, X. Z. Li, M. F. Hou, K. W. Cheah and W. C. H. Choy, “Enhanced Photocatalytic Activity of Ce3+-TiO2 for 2-Mercaptobenzothiazole Degradation in Aqueous Sus- pension for Odour Control,” Applied Catalysis A: Gen- eral, Vol. 285, No. 1-2, 2005, pp. 181-189. doi:10.1016/j.apcata.2005.02.025
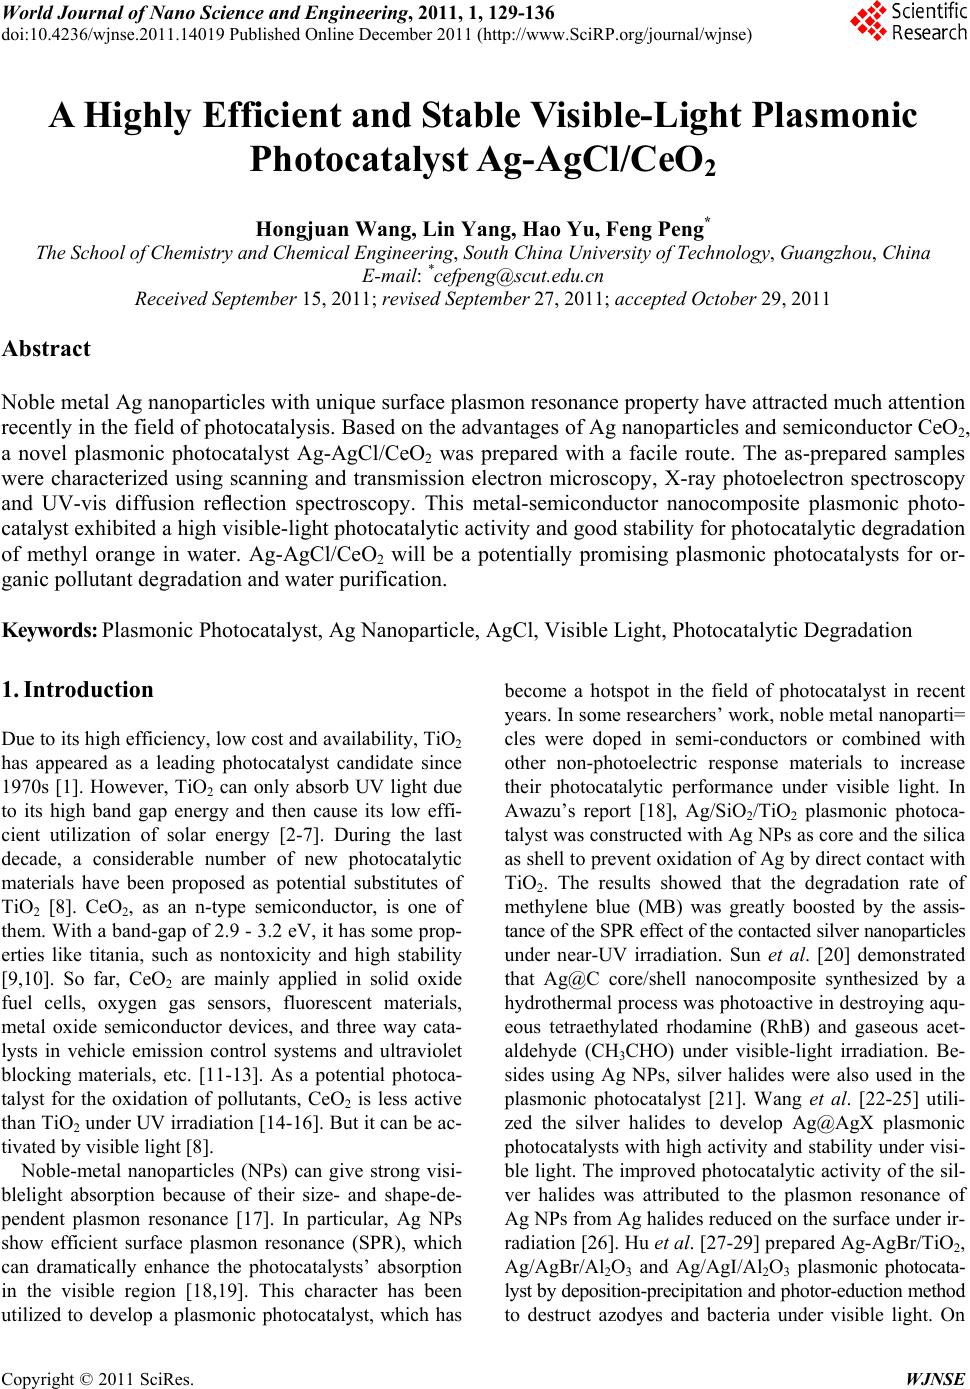
|