Paper Menu >>
Journal Menu >>
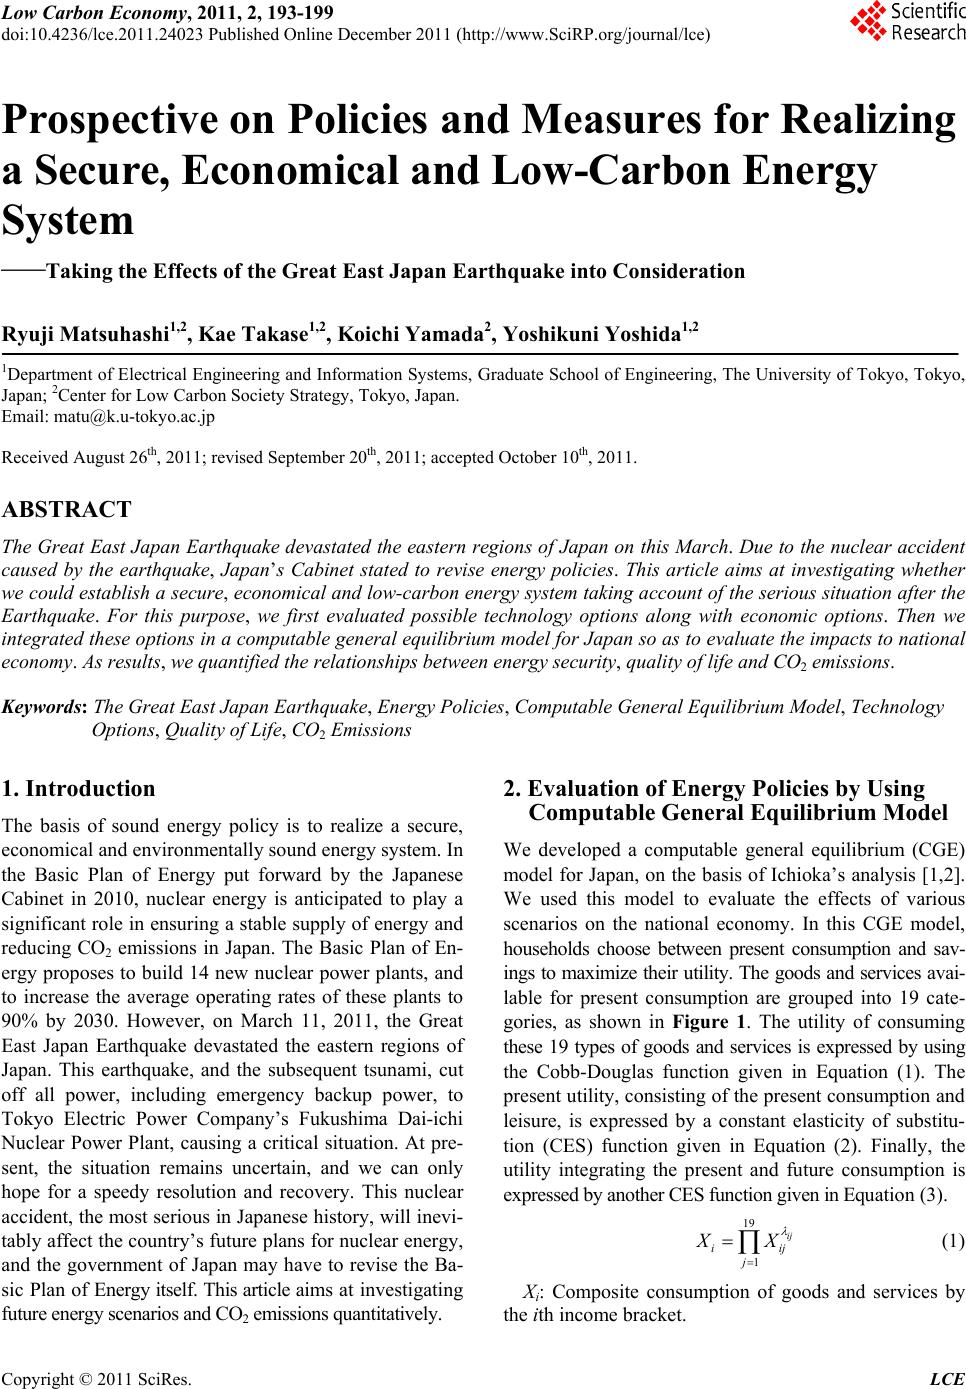 Low Carbon Economy, 2011, 2, 193-199 doi:10.4236/lce.2011.24023 Published Online December 2011 (http://www.SciRP.org/journal/lce) Copyright © 2011 SciRes. LCE 1 Prospective on Policies and Measures for Realizing a Secure, Economical and Low-Carbon Energy System ——Taking the Effects of the Great East Japan Earthquake into Consideration Ryuji Matsuhashi1,2, Kae Takase1,2, Koichi Yamada2, Yoshikuni Yoshida1,2 1Department of Electrical Engineering and Information Systems, Graduate School of Engineerin g, The Uni versity of To kyo, Toky o, Japan; 2Center for Low Carbon Society Strategy, Tokyo, Japan. Email: matu@k.u-tokyo.ac.jp Received August 26th, 2011; revised September 20th, 2011; accepted October 10th, 2011. ABSTRACT The Great East Japan Earthquake devastated the eastern regions of Japan on this March. Due to the nuclear accident caused by the earthquake, Japan’s Cabinet stated to revise energy policies. This article aims at investigating whether we could establish a secure, economical and low-carbon energy system taking account of the serious situation after the Earthquake. For this purpose, we first evaluated possible technology options along with economic options. Then we integrated these options in a computable general equilibrium model for Japan so as to evaluate the impacts to national economy. As results, we quantified the relationships between energy security, quality of life and CO2 emissions. Keywords: The Great East Japan Earthquake, Energy Policies, Computable General Equilibrium Model, Technology Options, Quality of Life, CO2 Emissions 1. Introduction The basis of sound energy policy is to realize a secure, economical and environmentally sound energy system. In the Basic Plan of Energy put forward by the Japanese Cabinet in 2010, nuclear energy is anticipated to play a significant role in ensuring a stable supply of energy and reducing CO2 emissions in Japan. The Basic Plan of En- ergy proposes to build 14 new nuclear power plants, and to increase the average operating rates of these plants to 90% by 2030. However, on March 11, 2011, the Great East Japan Earthquake devastated the eastern regions of Japan. This earthquake, and the subsequent tsunami, cut off all power, including emergency backup power, to Tokyo Electric Power Company’s Fukushima Dai-ichi Nuclear Power Plant, causing a critical situation. At pre- sent, the situation remains uncertain, and we can only hope for a speedy resolution and recovery. This nuclear accident, the most serious in Japanese history, will inevi- tably affect the country’s future plans for nuclear energy, and the government of Japan may have to revise the Ba- sic Plan of Energy itself. This article aims at investigating future energy scenarios and CO2 emissions quantitatively. 2. Evaluation of Energy Policies by Using Computable Genera l Equilibrium Model We developed a computable general equilibrium (CGE) model for Japan, on the basis of Ichioka’s analysis [1,2]. We used this model to evaluate the effects of various scenarios on the national economy. In this CGE model, households choose between present consumption and sav- ings to maximize their utility. The goods and services avai- lable for present consumption are grouped into 19 cate- gories, as shown in Figure 1. The utility of consuming these 19 types of goods and services is expressed by using the Cobb-Douglas function given in Equation (1). The present utility, consisting of the present consumption and leisure, is expressed by a constant elasticity of substitu- tion (CES) function given in Equation (2). Finally, the utility integrating the present and future consumption is expresse d by a nothe r CES func tion gi ven i n Equation (3). 19 1 ij ii j j X X (1) Xi: Composite consumption of goods and services by the ith income bracket. 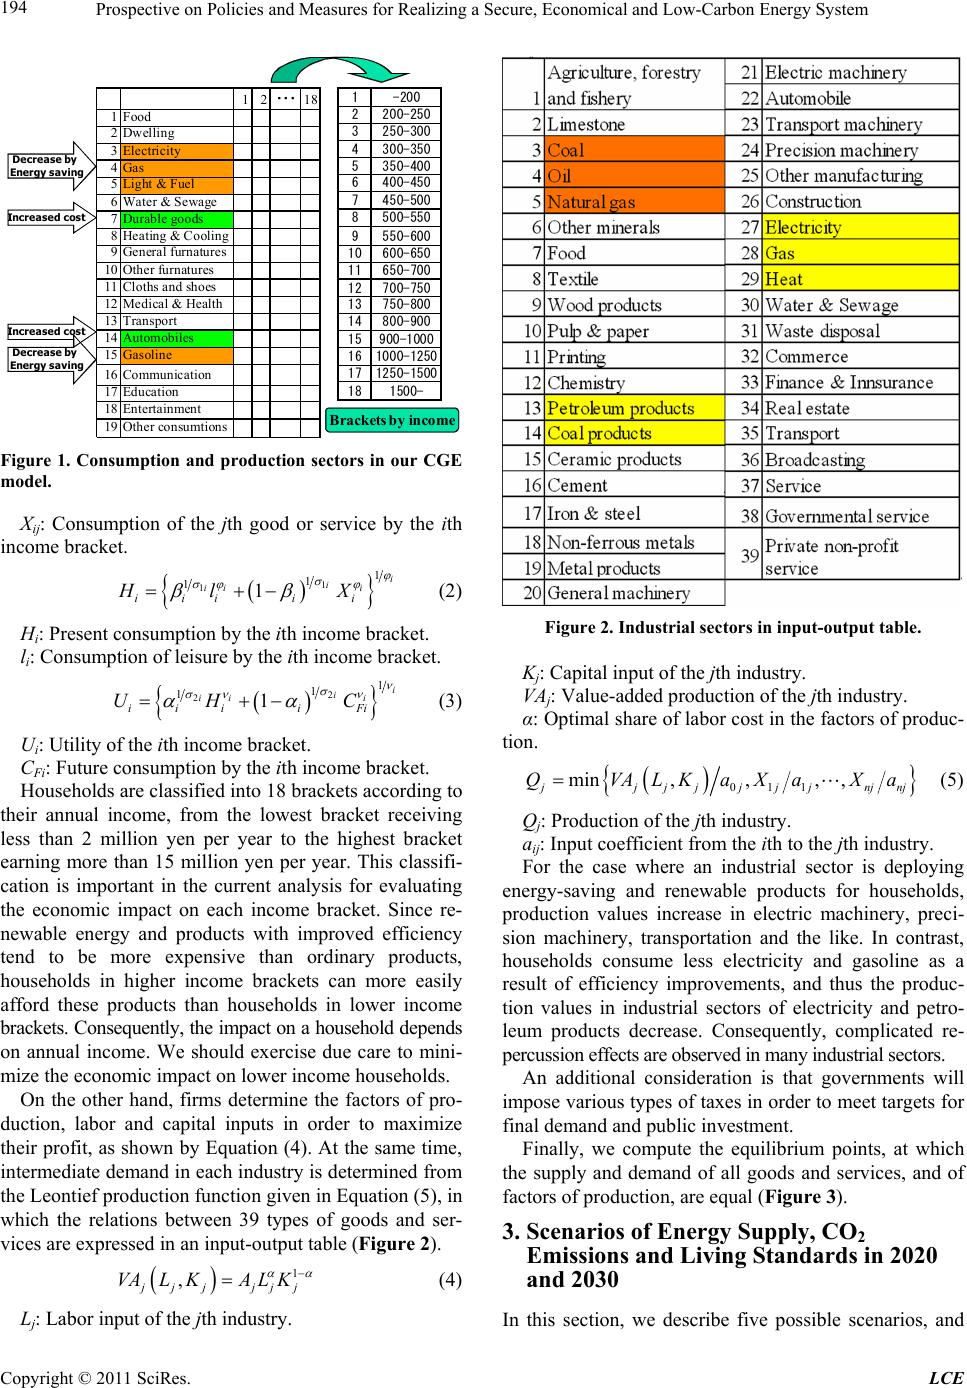 Prospective on Policies and Measures for Realizing a Secure, Economical and Low - C a r b o n Energy System 194 1-200 2 200-250 3 250-300 4 300-350 5 350-400 6 400-450 7 450-500 8 500-550 9 550-600 10 600-650 11 650-700 12 700-750 13 750-800 14 800-900 15 900-1000 16 1000-1250 17 1250-1500 18 1500- Bracket s by income Dec re as e b y Energy saving Increased cost Dec re as e b y Energy saving Increased cost 12 ・・・ 18 1Food 2 Dwelling 3 Electricity 4Gas 5Light & Fuel 6Water & Sewage 7D urable goods 8Heating & Cooling 9Gener al furnature s 10Other furnatures 11Cl ot hs and s hoes 1 2Medic al & Hea lth 13 Transport 14 Automobiles 15 Gasoline 16 Communication 17 Education 18 Entertainment 19Other consumtions Figure 1. Consumption and production sectors in our CGE model. Xij: Consumption of the jth good or service by the ith income bracket. 1 11 1 11i i ii i iiii i Hl X (2) Hi: Present consumption by the ith income bracket. li: Consumption of leisure by the ith income bracket. 2 21 1 11i i ii i iiiiFi UH C (3) Ui: Utility of the ith income bracket. CFi: Future consumption by the ith income bracket. Households are classified into 18 brackets according to their annual income, from the lowest bracket receiving less than 2 million yen per year to the highest bracket earning more than 15 million yen per year. This classifi- cation is important in the current analysis for evaluating the economic impact on each income bracket. Since re- newable energy and products with improved efficiency tend to be more expensive than ordinary products, households in higher income brackets can more easily afford these products than households in lower income brackets. Consequen tly, the impact on a household depends on annual income. We should exercise due care to mini- mize the economic impact on lower income households. On the other hand, firms determine the factors of pro- duction, labor and capital inputs in order to maximize their profit, as shown by Equation (4). At the same time, intermediate demand in each industry is determined from the Leontief product i o n fu nct i on gi ven in Equation (5), in which the relations between 39 types of goods and ser- vices are expressed in an input- output table (Figure 2). 1 , jjj jjj VALKA LK (4) Lj: Labor input of the jth industry. Figure 2. Industrial sectors in input-output tabl e . Kj: Capital input of the jth industry. VAj: Value-adde d pr o duct i o n of the jth industry. α: Optimal share of labor cost in the factors of produc- tion. 011 min,,, , j jjjjjjnj nj QVALKaXaXa (5) Qj: Production of the jth industry. aij: Input coefficient from the ith to the jth industry. For the case where an industrial sector is deploying energy-saving and renewable products for households, production values increase in electric machinery, preci- sion machinery, transportation and the like. In contrast, households consume less electricity and gasoline as a result of efficiency improvements, and thus the produc- tion values in industrial sectors of electricity and petro- leum products decrease. Consequently, complicated re- percussion effects are observed in many industrial sectors. An additional consideration is that governments will impose various types of taxes in order to meet targets for final demand and public investment. Finally, we compute the equilibrium points, at which the supply and demand of all goods and services, and of factors of production, are equal (Figure 3). 3. Scenarios of Energy Supply, CO2 Emissions and Living Standards in 2020 and 2030 In this section, we describe five possible scenarios, and Copyright © 2011 SciRes. LCE 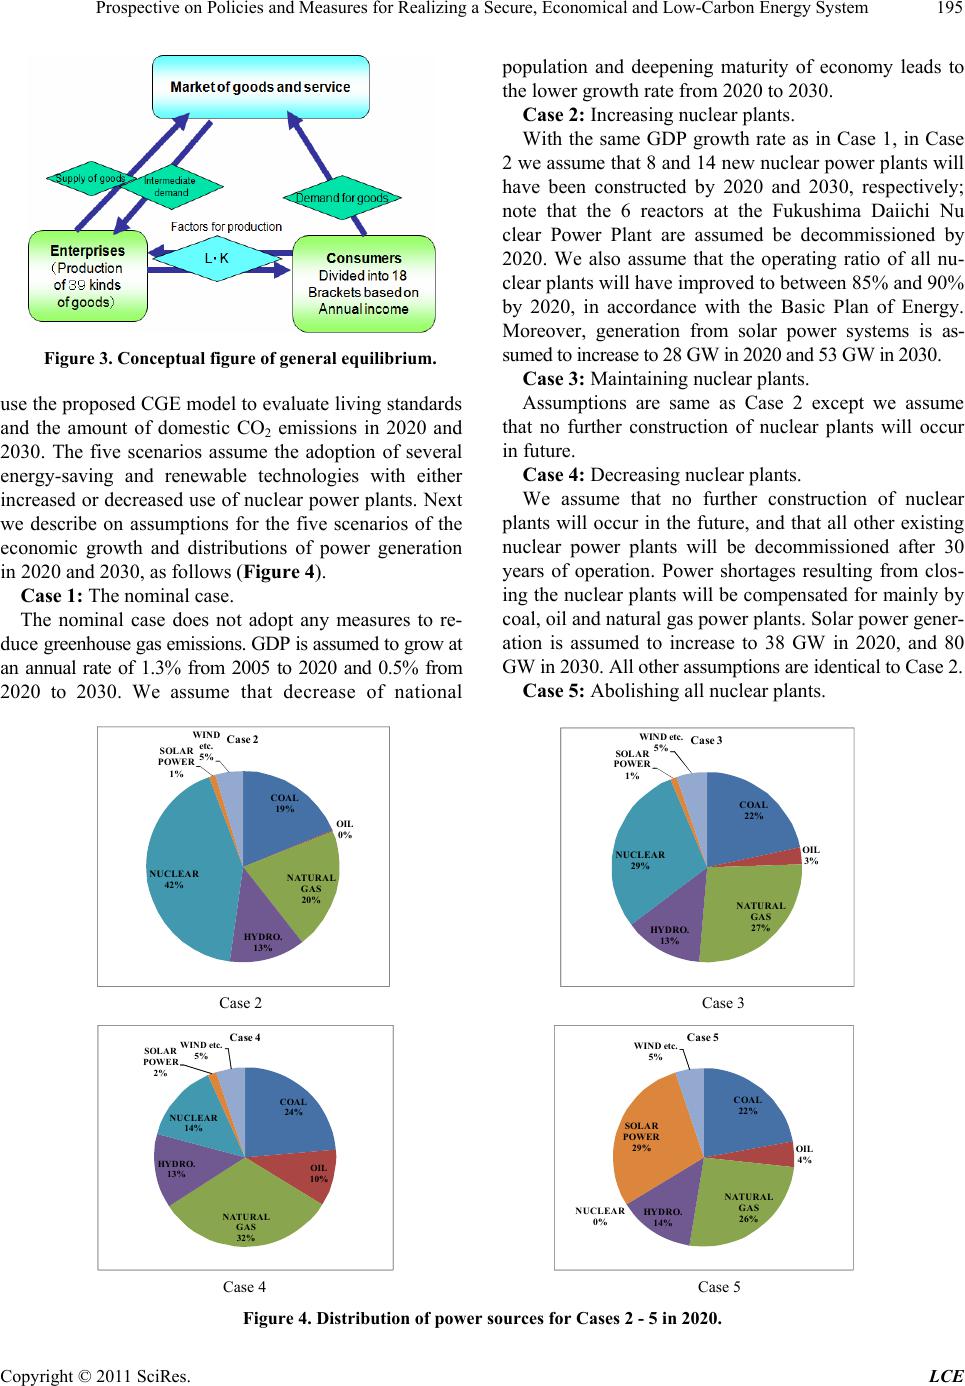 Prospective on Policies and Measures for Realizing a Secure, Economical and Low - C a r b o n Energy System Copyright © 2011 SciRes. LCE 195 population and deepening maturity of economy leads to the lower growth rate from 2020 to 2030. Case 2: Increasing nuclear plants. With the same GDP growth rate as in Case 1, in Case 2 we assume that 8 and 14 new nuclear power plants will have been constructed by 2020 and 2030, respectively; note that the 6 reactors at the Fukushima Daiichi Nu clear Power Plant are assumed be decommissioned by 2020. We also assume that the operating ratio of all nu- clear plants will have improved to between 85% and 90% by 2020, in accordance with the Basic Plan of Energy. Moreover, generation from solar power systems is as- sumed to increase to 28 GW in 2020 and 53 GW in 2030. Figure 3. Conceptual figure of general equilibrium. Case 3: Maintaining nuclear plants. Assumptions are same as Case 2 except we assume that no further construction of nuclear plants will occur in future. use the proposed CGE model to evaluate living standards and the amount of domestic CO2 emissions in 2020 and 2030. The five scenarios assume the adoption of several energy-saving and renewable technologies with either increased or decreased use of nuclear power plants. Next we describe on assumptions for the five scenarios of the economic growth and distributions of power generation in 2020 and 2030, as follows (Figure 4). Case 4: Decreasing nuclear plants. We assume that no further construction of nuclear plants will occur in the future, and that all other existing nuclear power plants will be decommissioned after 30 years of operation. Power shortages resulting from clos- ing the nuclear p lants will be compensated for mainly by coal, oil and natural gas power plants. Solar power gener- ation is assumed to increase to 38 GW in 2020, and 80 GW in 2030. All other assumptions are identical to Case 2. Case 1: The nominal case. The nominal case does not adopt any measures to re- duce greenhouse gas emissions. GDP is assumed to grow at an annual rate of 1.3% from 2005 to 2020 and 0.5% from 2020 to 2030. We assume that decrease of national Case 5: Abolishing all nuclear plants. COAL 19% OIL 0% NATURAL GAS 20% HYDRO. 13% NUCLEAR 42% SOLAR POWER 1% WIND etc. 5% Case 2 COAL 22% OIL 3% NATURAL GAS 27% HYDRO. 13% NUCLEAR 29% SOLAR POWER 1% WI ND e tc . 5% Case 3 Case 2 Case 3 COAL 24% OIL 10% NATURAL GAS 32% HYDRO. 13% NUCLEAR 14% SOLAR POWER 2% WIND etc. 5% Case 4 COAL 22% OIL 4% NATURAL GAS 26% HYDRO. 14% NUCLEAR 0% SOLAR POWER 29% WIND etc. 5% Cas e 5 Case 4 Case 5 Figure 4. Distribution of power sources for Cases 2 - 5 in 2020. 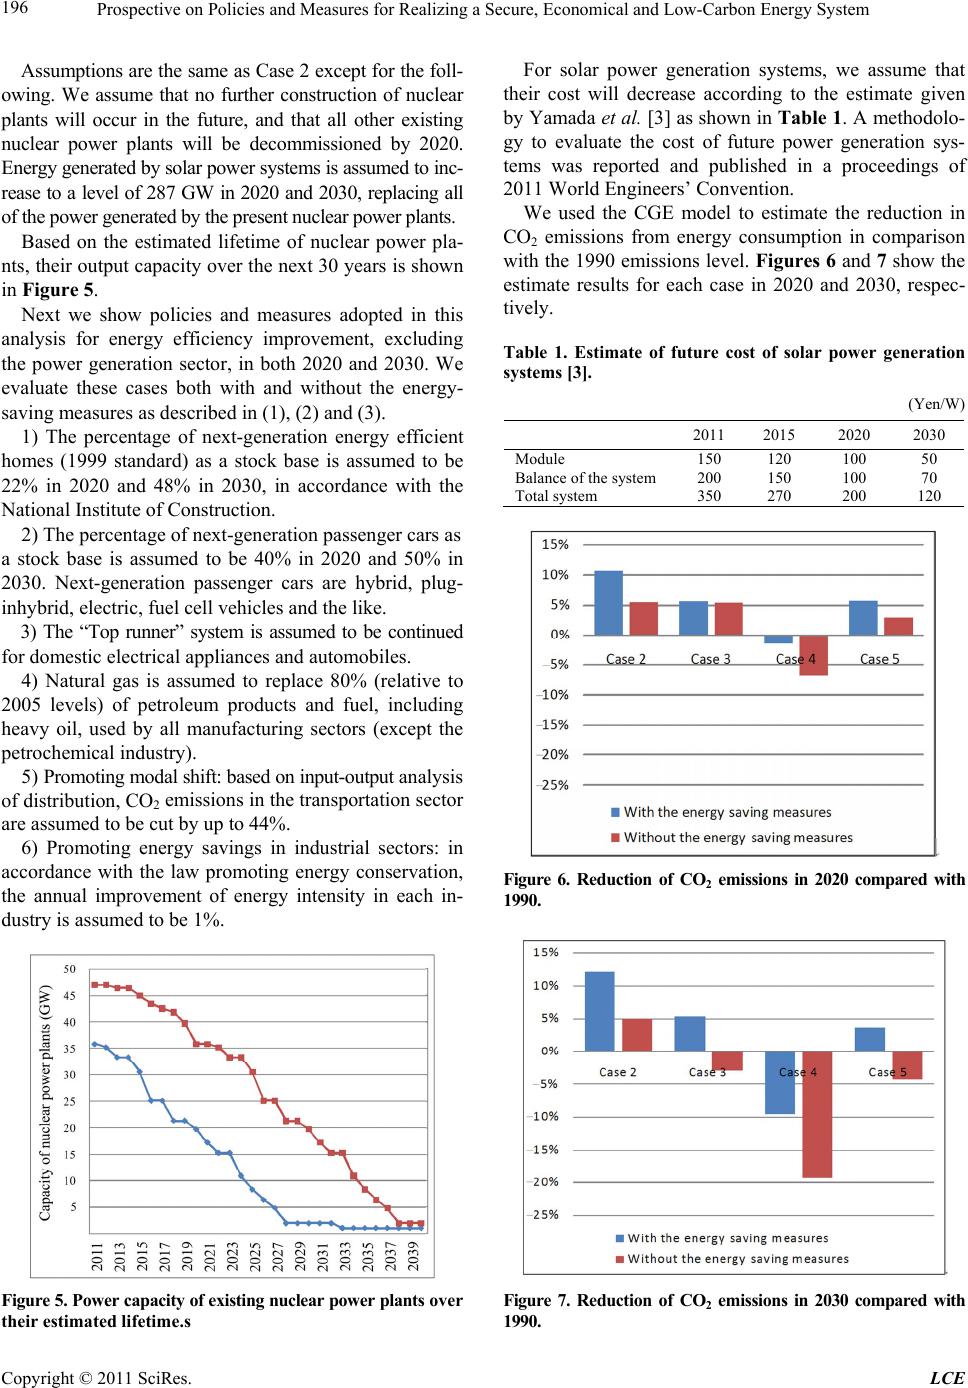 Prospective on Policies and Measures for Realizing a Secure, Economical and Low - C a r b o n Energy System 196 Assumptions are the same as Case 2 except for the foll- owing. We assume that no further construction of nuclear plants will occur in the future, and that all other existing nuclear power plants will be decommissioned by 2020. Energy generated by solar power systems is assumed to inc- rease to a level of 287 GW in 2020 and 2030, r eplacing all of the power generated by the present nuclear power plants. Based on the estimated lifetime of nuclear power pla- nts, their output capacity over the next 30 years is shown in Figure 5. Next we show policies and measures adopted in this analysis for energy efficiency improvement, excluding the power generation sector, in both 2020 and 2030. We evaluate these cases both with and without the energy- saving measures as described in (1), (2) and (3). 1) The percentage of next-generation energy efficient homes (1999 standard) as a stock base is assumed to be 22% in 2020 and 48% in 2030, in accordance with the National Institute of Construction. 2) The percentage of next-generation passenger cars as a stock base is assumed to be 40% in 2020 and 50% in 2030. Next-generation passenger cars are hybrid, plug- inhybrid, electric, fuel cell vehicles and the like. 3) The “Top runner” system is assumed to be continued for domestic electrical appliances and automobiles. 4) Natural gas is assumed to replace 80% (relative to 2005 levels) of petroleum products and fuel, including heavy oil, used by all manufacturing sectors (except the petrochemical industry). 5) Promoting modal shift: based on input-output a nal ysi s of distribution, CO2 emissions in the transportation sector are assumed to be cut by up to 44%. 6) Promoting energy savings in industrial sectors: in accordance with the law promoting energy conservation, the annual improvement of energy intensity in each in- dustry is assumed to be 1%. Figure 5. Power capacity of existing nucle ar power plants ov er their estimated lifetime.s For solar power generation systems, we assume that their cost will decrease according to the estimate given by Yamada et al. [3] as shown in Ta ble 1. A methodolo- gy to evaluate the cost of future power generation sys- tems was reported and published in a proceedings of 2011 World Engineers’ Convention. We used the CGE model to estimate the reduction in CO2 emissions from energy consumption in comparison with the 1990 emissions level. Figures 6 and 7 show the estimate results for each case in 2020 and 2030, respec- tively. Table 1. Estimate of future cost of solar power generation systems [3]. (Yen/W) 2011 2015 2020 2030 Module 150 120 100 50 Balance of the system 200 150 100 70 Total system 350 270 200 120 Figure 6. Reduction of CO2 emissions in 2020 compared with 1990. Figure 7. Reduction of CO2 emissions in 2030 compared with 1990. Copyright © 2011 SciRes. LCE  Prospective on Policies and Measures for Realizing a Secure, Economical and Low - C a r b o n Energy System 197 The results indicate that decreasing the use of nuclear energy has a large impact on CO2 emissions. Namely, the difference in the CO2 reduction, between the case of in- creasing nuclear energy and the case of decreasing nu- clear energy, is approximately 12% in 2020 and 22% in 2030. The results indicate that decreasing the use of nuclear energy has a large impact on CO2 emissions. Namely, the difference in the CO2 reduction, between the case of in- creasing nuclear energy and the case of decreasing nu- clear energy, is approximately 12% in 2020 and 22% in 2030. Next, we show the increases and decreases in house- hold welfare values. Figures 8 and 9 show the estimated differences in welfare values per household for each case compared with Case 1 for 2020 and 2030, respectively. Figure 8. Changes in household welfare values in 2020. Figure 9. Changes in h ousehold welfa r e va lues in 20 30 . Figures 8 and 9 express the differences from Case 1, the no reduc- tion case. Changes in welfare are translated from changes in utility by using the concept of equivalent variation. Specifically, the welfare changes show changes in utility, based on the concept of equivalent variation, in which the utility changes are expressed in terms of the price of goods and services before the change. We cannot express changes in household welfare in terms of only disposable income, since the prices of goods and services are different depend- ing on each case. Hence, we use househo ld we lf ar e v al ue s with equivalent variation. Values of household welfare in Case 2 are higher than those in Case 5 in 2020. However, household welfare values for Case 5, in which all nuclear power plants are decommissioned and replaced with solar power genera- tion systems, are even higher than those for Case 1, in which no measures are taken to reduce CO2 emissions. Although values of household welfare for Case 2 are also higher than those for Case 5 in 2030, the difference is much smaller than in 2020. This smaller difference in household welfare is because the costs of solar power generation systems and batteries are lowered (see Table 1) through research and development of these technologies. To confirm this point, in Figures 10 and 11 we show percentage changes in the prices of consumption goods for househo lds in 2020 and 20 30, respectively. Unless we are unable to deploy the energy-saving technologies listed in (1), (2) and (3) in Chapter 3, the prices of all consumer goods centered on electricity es- calate in 2020. This escalation is a consequence of de- ploying enough solar power generation systems to pro- duce nearly 300 GW of electricity by means of a feed-in- tariff. In contrast, the increase in the price of electricity and other goods becomes smaller in 2030, even though these solar power generation systems produce nearly 300 GW of power. This trend is mainly due to the effect of reducing the cost of solar power generation systems, as shown in Table 1. Figure 10.Changes in prices of consumption goods of house- holds in 2020. Copyright © 2011 SciRes. LCE  Prospective on Policies and Measures for Realizing a Secure, Economical and Low - C a r b o n Energy System 198 Figure 11.Changes in prices of consumption goods of house- holds in 2030. Figures 10 and 11 depict changes in pri ce s fr o m Case 1. Finally, we compare household welfare values in 2030 for all income brackets under Case 2 and Case 5 (Figures 12 and 13). These figures show that household welfare values will increase regardless of the ex istence of nuclear power plants, as long as the energy efficiency of final consumption is improved using the measures (1), (2) and (3) in Chapter 3. Therefore, promotion of energy conser- vation is the most significant factor in establishing a low carbon society. The following implications are deduced from the above analyses: Cases 2 and 3, in which we increase or maintain the number of nuclear power plants, are superior in im- proving household welfare and decreasing CO2 emis- sions. However, these cases are questionable from the perspectives of environmental safety and security. Especially, now that public acceptance has been low- ered by the accident at the Fukushima Daiichi Nu- clear Power Plant. Although Case 4, in which we decrease nuclear power plants, is inferior to Cases 2 and 3 in terms of house- hold welfare values, the difference is small. CO2 emis- sions are, however, drastically increased in Case 4, which is contradictory to the goal of establishing a low carbon society in Japan. CO2 emissions are reduced to some extent in Case 5, in which we decommission all nuclear power plants within five years. Case 5 is also not problematic from the perspectives of env ironmental safety and security. However, introduction of a large number of solar power generation systems suppresses household wel- fare due to the rapid escalation of electricity prices. If the cost of solar power generation systems can be de- creased as shown in Table 1, there will be almost no adverse effect on households. Figure 12. Changes of household welfare values in individ- ual income brackets for Case 2. Figure 13. Changes of household welfare values in individ- ual income brackets for Case 5. Figures 12 and 13 depict the change in household welfare values relative to Case 1, and we assume promotion of en ergy-saving measures (1), (2) and (3) in Chapter 3. 4. Conclusions This article aimed at investigating energy policies and measures to establish a low carbon society. For this pur- pose, we used the computable general equilibrium (CGE) model for Japan, so as to conduct a comparative analysis of the effects of increasing and decreasing the number of nuclear power plants on the national economy and CO2 emissions. We also used the model to evaluate the effects of deploying renewable energy and energy- saving tech- nologies. As a result, we found that a decrease or aboli- shment of nuclear power plants has a serious negative impact on CO2 emissions. Next we evaluated the impact of energy policies on households’ utility. The computed results imply that the utilities of households could be considerably improved by the spread of energy-saving products, such as high- efficiency electrical appliances and automobiles. Thus, Copyright © 2011 SciRes. LCE  Prospective on Policies and Measures for Realizing a Secure, Economical and Low - C a r b o n Energy System Copyright © 2011 SciRes. LCE 199 measures to promote the spread of these products are crucial, regardless of the increase or decrease of nuclear power plants. Now that trust in nuclear energy has been severely damaged as a result of the accident at the Fukushima Daiichi Nuclear Power Plant, it is inevitable that energy policies must be revised. With present technologies and institutions-regardless of whether nuclear power plants are increased, maintained, decreased or decommissi- oned—no ideal so lution exis ts tha t offers env ironmen tal safety and security, benefits to the economy and low carbon emissions. Thus, we need technological and insti- tutional innovations in order to realize a sustainable energy system in the long term. These innovations include reducing the cost of solar power generation tech- nologies, improving energy efficiency, integrating infor- mation technology with the energy system to create a smart grid, and introducing renewable energy technologies. REFERENCES [1] O. Ichioka, “Applied General Equilibrium Analysis,” Yuhikaku Publishing Co., Tokyo, 1991. [2] R. Matsuhashi, K. Takase, T. Yoshioka, Y. Imanishi and Y. Yoshida, “Sustainable Development under Ambitious Medium Term Target of Reducing Greenhouse Gases,” Forum on Public Policy: A Journal of Oxford Round Ta- ble, Vol. 2010, No. 3, 2010, pp. 1-11. [3] K. Yamada, T. Inoue and K. Waki, “Future Prospects of Photo-Voltaic Systems for Mitigating Global Warming,” Proceedings of 2011 World Engineers’ Convention, Ge- neva, 5-8 September 2011. |