Open Access Library Journal
Vol.06 No.02(2019), Article ID:90849,5 pages
10.4236/oalib.1105193
Functional Relationships of a Geospatial System for Reforestation of a Territory Using Geographic Information Systems
Orlando H. Álvarez Hernández  , Thuesman E. Montaño Peralta
Facultad de energía, Las industrias y los recursos naturales no renovables, Universidad nacional de Loja, Loja, Ecuador

Copyright © 2019 by author(s) and Open Access Library Inc.
This work is licensed under the Creative Commons Attribution International License (CC BY 4.0).
http://creativecommons.org/licenses/by/4.0/


Received: January 18, 2019; Accepted: February 25, 2019; Published: February 28, 2019
ABSTRACT
The analysis presented was carried out in an area of Loja Province, Ecuador, with the objective of determining the functioning of the different geospatial systems for the evaluation of the reforestation of the territory, degraded by different activities that are developed in open sky. It was departed from the running of the model of Hottel, that considering the absence of data series of meteorological variables, theoretical methods were used for the calculation of the insolation variable, in Labview software. Considering the affectations by the presence of cloudiness as well as by the surfaces of shade orographic, this was implemented for a Geographic Information System (GIS) taking advantage of the characteristics of these applications for spatial analyses. The analysis of temperature and precipitation was also included considering the variations in altitude [1] for the realization of the functional analysis of the territory. From the joint analyses of both methods were obtained maps that allowed defining the zones with conditions of dampening and flows of radiation and caloric potentials, whose result will allow the specialists of the biotic part to determine the species for reforestation in the area. The digital elevation model (MDE) of the South Region of Ecuador was obtained and the maps of slopes, orientation of the surfaces and slopes oriented, from which, through analysis of cross-images allowed the determination of the maps of radiation, temperature, and precipitation considering the geomorphologic characteristics. The resulting maps are presented.
Subject Areas:
Geographical Information System (GIS)
Keywords:
Geographical Information System (GIS), Geospatial Systems, Radiation Energy Flow, Geomorphologic Characteristics, Images Processing

1. Introduction
It is considered by Quintela [2] , that the vertical structure of the landscape is defined “by the interrelations between the landscape components in vertical sense”. That is, it is based on the linkages that exist between each of the components (soil, vegetation, mother rock, climate, relief, animals) from the point of view of the exchange of energy, substances and information. “However, it is considered that” it may be very difficult to know (or even to quantify) how the energy, matter and information flows between each of them are produced.
In this case it was considered necessary to resort to the use of geographic information systems (GIS) because this technology allows “automatic processing and simultaneously digital cartographic information and modeling for different applications... and... generate, process and analyze large amounts of information from renewable natural resources, in terms of high reliability and opportunity” [3] .
On the other hand, it is essential to know the distributions of rainfall and temperatures in the area in order to define, together with the energy flow, the conditions of dampening.
Different methods are known, developed by researchers from different countries, for calculating conditions of dampening or aridity of a territory, which use relationships of variables such as rain, temperature, incident solar radiation, relative humidity, potential evaporation and others (Budyko, Thorwaite, Pennman, cited by [4] , Riatchikov, 1976).
Notwithstanding the foregoing, it is known that the fundamental source of energy for the various processes occurring in nature comes from the radiant energy of the sun, from which there is a warming of the atmosphere, from below, the heating of aqueous and terrestrial surfaces, and their distribution by the planet by the general circulation of the atmosphere and the marine currents, as well as intervenes in chemical reactions such as those related to the formation of ozone (O3) from molecular oxygen (O2), for which electromagnetic energy is required.
It follows that the possibility of including in a GIS the values of radiant energy that reaches the Earth’s surface is of extraordinary importance for the studies of the functioning of the geoecological systems, adding to the thematic cartography of conventional climatic elements such as precipitation (contribution of substance) and the temperature of the air, of soils, vegetation, etc., and to the digital models of elevation (DEM).
Geographical Aspects
Ecuador is a country that is a producer and exporter of primary products and is therefore regarded as a notably agricultural country. By the year 2006, the total national GDP was of 21,553,301 dollars, of this we have that the agricultural GDP was of 1,877,165 dollars, represented the 8.70% to the total GDP.
The canton Loja is the largest of the 16 cantons existing in the province of Loja, its population is of 128,954 inhabitants and has an extension of approximately 1833 km2 that is to say 17% of the provincial territory (11,730 km2) [5] .
The Loja region is located in the temperate Andean climate area. Except for the months of June and July, months in which it has an oriental drizzle (trade winds). Loja enjoys a temperate climate that varies from 16˚C and 21˚C.
According to the IV census of National population and housing carried out by the INEC [6] in the year 2001, the Canton Loja has 118,532 inhabitants that concentrate 67.7% of the urban population, while the remaining 32.30% corresponds to the rural population with 56,545 inhabitants. The total population in percentage of the urban and rural parishes of the Loja canton, divided between men and women, projected for the year 2006 are detailed in Table 1.
The agro-ecological conditions characteristic of the canton and the sector under study, allow to have a variety of agricultural crops, “are mainly cultivated vegetables, maize associated with the cultivation of beans, peas, fruit trees of cold equatorial climate of High Mountain (between 4 and 12 degrees) like pear, apple, strawberry, BlackBerry, Uvilla, Babaco, tree Tomato and others.”
In turn, the Chuquiribamba parish is located at the northwest of the Loja canton. It is a privileged area because of its climatic and scenic variety; it has a cold climate that fluctuates between 8˚C and 20˚C, being 12.5˚C the average temperature. In Chuquiribamba there are countless hills, as well as its green crops. It has an extension of 220 km2.
Figure 1 shows the location of the parish and Figure 2, a photograph of the village Chuquiribamba.
The parish was created on April 27, 1911 [7] , its population in the year 2014 was of 2798 inhabitants. It has an extension of 2798 km2 and its limits are:
North: Gualel parish and Santiago;
South: Parish Chantaco and Catamayo county;

Figure 1. Image of the study area (Google Maps).

Figure 2. Village of Chuquiribamba.

Table 1. Inhabitants of the Loja canton.
Source: VI Population and V census of Housing [6] .
East: Parish Santiago y
West: El Cisne Parish
Is located in:
Latitude: 3˚50'36.94"South;
Length: 79˚20'38.95"West
It is located in an altitudinal range between 2150 and 2920 m. The Chuquiribamba parish is located 49 km from the provincial capital, Loja, to the northwest.
Characteristics of the sector: the orography of the parish is quite irregular, with an altitude that oscillates around the 2723 m, which gives rise to the formation of mountains that are naturally intertwined to serve as protection to the cold valley of much of the settlement of the population. The water system of the parish has slopes and streams that give life to the inhabitants, to the flora and fauna [8] (Aguinsaca, 2014).
Productive activities: mainly agricultural production, livestock and artisan farming and some livestock. It produces seasonal sowings; the basin gradually drains the rains in such a way that the production to temporal, leaves with the precipitations. Farmers use organic fertilizers for their production. From here come the majority of cereals and vegetables that are marketed in the city of Loja. There is the production of microenterprises dedicated to the processing of aromatic herbs that are necessary for the preparation of tasty horchata [8] .
Evapotranspiration is the process in which the combination of evaporative water loss from the soil surface and from transpiration crops occurs [9] , where liquid water is converted to water vapor and removed from the evaporating surface. It requires energy to change the state of the water molecules to vapor, being solar radiation and to a lesser degree the temperature of the air that provide that energy.
To be able to carry out this work, it was necessary to have data of the meteorological elements that are part of the calculation equations of the potential and real evapotranspiration; however, there is no meteorological station in the study area, which also has a complicated relief, so it was used geomatics techniques to obtain the results.
2. Materials and Methods
Monthly data from meteorological stations located in the southern region of Ecuador and published in the climatological yearbooks of the National Institute of Meteorology and Hydrology of Ecuador (INAMHI) [10] between the years 1991-2011 were used.
The data of the yearbooks have many gaps in the series so it was used methods of completeness of series, normalization and homogenization of the same, as well as methods of multiple correlations for the cases of the stations with few years of data.
The variables used in the present study were: mean air temperature (Tm), Maximum air temperature (Tx), minimum air temperature (Tn) and Global radiation with clear Sky (RG), the latter from the monthly maps of the southern region of Ecuador obtained in the project 754 SENESCyT-UNL, “Development of space-temporal models of solar and wind variables to estimate the energy potential of the southern region of Ecuador” [11] [12] .
For the elaboration of the numerical model of altitude of the selected zone in the southern region of Ecuador (RSE), the data of the Shute Radar Topography model (SRTM), which has a spatial resolution of 90 meters, was used (Figure 3).
For the accomplishment of this work, considering the absence of sufficient series of observations of the global solar radiation, the theoretical methods of Hottel and PVGIS were used for the calculation of the variable, which are presented in the work of Molina and Others [13] in the form of a software, based on LABVIEW, for use by anyone interested in knowing the timetable, daily, monthly and annual values of the global radiation.
It was selected an approximate area of 480.5 km2 framed between X1 = −79.2, X2 = −79.5 and Y1 = −3.8, Y2 = −3.9 (UTM 17S projection) to implement the method of estimation of the radiation energy flow [14] for a latitude depending on the geomorphologic characteristics of the territory. Here it is considered that a degree has 111 km (Figure 4).
3. Results
Figure 5 shows the digital elevation model of the southern region of Ecuador (RSE) and observes the location of the meteorological stations of the INAMHI.
The shading maps obtained from the Digital elevation model were used, considering the following combinations of elevation angles and azimuth: (15.45); (15.135); (15.225); (15.315); (30.45); (30.135); (30.225); (30.315); (45.45); (45.135); (45.225); (45.315); (60.45); (60.135); (60.225); (60.315). From these

Figure 3. Relief map and location of the Chuquiribamba village, Loja, Ecuador. The project area is located between 79.2000343932 to 79.4799862427W and 3.77352581322 to 3.9074158282S.

Figure 4. Grid used in the case of Chuquiribamba.

Figure 5. Digital model of elevation of RSE.
maps were made the average maps according to the azimuth North and South and finally were averaged to obtain the map of shadows for the entire project area, and Figure 6 shows the map of orographic shadows for RSE.
From these two maps you can calculate the global solar radiation using directly the equations, or extracting the values of the coordinates and the height to introduce them in the program RSE-Sol [13] .
Once the values of the global solar radiation have been obtained for the points obtained from the DEM, clouds maps are considered from the information of the NASA, in order to decrease the values according to the cloudiness. Figure 7 shows the average sunstroke per cent map for the month of January.
Once the values of the global solar radiation are obtained considering the average values of the cloud cover, an operation is carried out between this map and that of orographic shadows, obtaining the map (MJ/m2) of real global solar radiation for the territory of RSE (Figure 8).
To the Global radiation maps for the southern region of Ecuador for months and yearly, it was carried out the necessary transformations to be expressed in mm water/day (Figure 9; Figure 10).
The maps of medium, maximum and minimum temperature were also calculated, of which the maps corresponding to the month of January are presented (Figures 11-13).
Based on the maps, overlays were performed between them in order to obtain the reference evapotranspiration maps (ETr) for each month, using the Hargreaves formula.
Subsequently, the maps of ETr were made, considering an area around the

Figure 6. Map of orographic shadows of the southern region of Ecuador.

Figure 7. Map of % of average insolation. Month of January. Source: NASA.

Figure 8. Annual global radiation map for the southern region of Ecuador.

Figure 9. Annual global average solar radiation (mm water/day).

Figure 10. Global radiation map of the area. Month of January (mm water/day).

Figure 11. Map of mean temperatures in the area. Month of January (˚C).
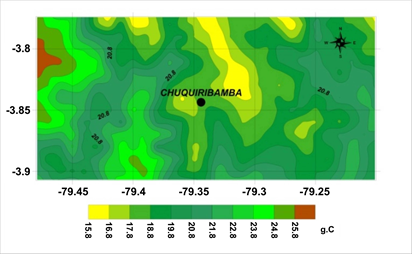
Figure 12. Map of maximum temperatures in the area. Month of January (˚C).

Figure 13. Map of minimum temperatures in the area. Month of January (˚C).
town of Chuquiribamba, which is presented in Figure 14, also corresponding to the month of January. The area selected for this study is located between 79.20 to 79.48W and 3.77 to 3.91S.
Figure 14 shows the reference evapotranspiration map in the reference zone using the Hargreaves method for the month of January.
Precipitation maps were obtained for the southern region of Ecuador from the meteorological stations data for the period 1991-2011, after completing the data series [15] , in order to carry out operations between maps, in conjunction with the ETr maps and determine indexes that allow, establish functional relationships in areas with reforestation needs.
For example, the Lautensach-Meyer index [16] considers an arid month in which the water deficit reaches 30 mm, so, if we consider the year as a whole, the deficit to consider a zone as arid it would have to be equal to or greater than 360 mm. In this paper it will consider the following subdivision (Table 2) in response to the average annual P-ETP deficit.
As a result, two zones with annual values of the difference between precipitation and negative evapotranspiration were obtained. The first to the West, which represents an area with characteristics ranging from humidity deficits to extreme semiarid (Figure 17).

Figure 14. Reference evapotranspiration map of the Chuquiribamba region. Month of January (mm water/day).
Table 2. Lautensach-Meyer index.
A second area around the Malacatos region, which has an accentuated aridity, with values ranging from moisture deficit to extremely arid, which can be due to the daily temperature amplitude values in this area are the highest in the Region (14.5˚C) at the same time as the annual rainfall values are less than 700 mm, while those of actual evapotranspiration are higher than 1460 mm and the average global radiation is higher than 230 KW/h average monthly.
In the work of Díaz-Padilla et al. [17] , The Arid Land Characterization (IA) of the UNEP [18] is used as shown in Table 3, including the category of wetlands. This classification was included in the categories “very humid” (1.25 < P/ETR < 1.75) and Hyperhumid (P/ETP > 1.75).
According to this classification, a map of aridity indexes (IA, Figure 15) was carried out, which resulted from the quotient of dividing the rainfall between the reference evapotranspiration, and later it was reclassified taking the proposed aridity classes by UNEP [18] and amended by Díaz-Padilla [17] and the authors of this work. In this map you can see a coincidence with the two zones found in Figure 3, while another secondary zone appears with less territorial extension in the area of Amaluza, with values between 0.65 and 1.00. The statistical values are shown in Table 4.
The study area has a grid with a total of 135 rows × 281 columns and a total of 37,386 nodes each 0.001˚. The statisticians of the ETr were calculated for each
Table 3. Aridity index.
Table 4. Main statisticians for ETr for months.

Figure 15. Annual rainfall map.
month, obtaining the data shown in Table 4. The behavior of the average values, median, minimum and maximum are shown in Figure 16, with a maximum of 3.07 mm/day in the months of October and November, as well as a minimum in the months of June and July of 1.65 mm/day, while there is a relative maximum in March 2.93 mm/day, which corresponds to the seasonal behavior of the temperature.
The values of the reference evapotranspiration are within the limits for a relatively similar climate, Cabinda, Angola [19] where for the month of January is 3.4 and if compared with the results for the station M482 (−80.2˚ −3.54˚ 60 m height), located on the coast (3.56 mm/day) it is observed that there are no major differences.
With respect to the southern region of Ecuador as a whole, we can see the values obtained, both of the result of P-ETr, and P/ETR in Figure 17 and Figure 18, which tells us how are the functional relations between precipitation and reference evapotranspiration.

Figure 16. Annual behavior of the statisticians of ETr in the study area.

Figure 17. Map of differences between precipitation and reference evapotranspiration (mm).

Figure 18. Aridity index map.
4. Conclusions
1) The use of a geographic information system and a CAD enabled the obtaining, in cartographic form, of different elements of functional systems, as well as complex functional relations essential for the realization of environment studies, allowing the fast and reliable obtaining of the main sources of energy and substance, which can be also integrated in studies related to the landscapes of a region.
2) Zones classified from semi-arid to Hyperarid must be reforested with plants that respond to these conditions and depending on the radiative flow with Heliófilas or umbrófilas plants.
3) The amounts of energy received by the area of the territory studied are sufficient for the development of photosynthetic activity, even in cases where energy input occurs at the expense of diffuse radiation for most of the year.
4) Rainfall maps were obtained for the southern region of Ecuador for the period 1991-2015.
5) The map of differences between annual reference precipitation and evapotranspiration was obtained.
6) Humidity-deficit areas for crops were determined for the period studied.
7) The map of the aridity index (AI) was obtained and the frequencies were calculated by types and their main statisticians.
It is recommended the use of this information by the Ministry of Agriculture (MAGAP) and other institutions to take the necessary measures to ensure the well-being of the population, and to continue these studies systematically.
Thanks
To the National Institute of Meteorology and Hydrology of Ecuador by the publication of the statistical yearbooks, as well as to the National University of Loja and in particular to the Area of Energy, Industries and Non-Renewable Natural Resources for allowing us to use the Information of the automatic stations UNL and PADMI.
Conflicts of Interest
The authors declare no conflicts of interest regarding the publication of this paper.
Cite this paper
Álvarez, O.H. and Montaño, T.E. (2019) Functional Relationships of a Geospatial System for Reforestation of a Territory Using Geographic Information Systems. Open Access Library Journal, 6: e5193. https://doi.org/10.4236/oalib.1105193
References
- 1. álvarez, O.H. and Gutiérrez, T.J. (1998) Metodología para la cartografía automatizada de elementos meteorológicos en Cuba. (Unpublished)
- 2. Quintela, J.A. (1995) El inventario, el análisis y el diagnóstico geoecológico de los paisajes mediante el uso de los sistemas de información geográfica. Autoreferat Tesis en opción al Grado Científico de Dr. Ciencias Geográficas.
- 3. Infante, A. (1991) Sistema de Información Geográfica de la selva alta peruana, resultados de aplicaciones. I Etapa. Memorias V Simposio Latinoamericano de Percepción Remota. Cuzco, Perú.
- 4. Riatchikov (1976) Estructura y dinámica de la esfera geográfica. Edit. MIR. Moscú.
- 5. Honorable Consejo Provincial de Loja (2008) Dirección de Planificación-Jefatura de Ordenamiento Territorial.
- 6. INEC (2006) VI Censo de Población y Vivienda.
- 7. Gobierno Autónomo Descentralizado de la Parroquia Chuquiribamba (GAD Chuquiribamba) (2015) Plan de desarrollo y ordenamiento territorial de la parroquia chuquiribamba, cantón y provincia de loja.
- 8. Aguinsaca, R.X. (2014) Dinámica productiva agrícola: la estructura y funcionamiento de los sistemas de producción de los agricultores de las parroquias del noroccidente del cantón loja, ecuador. Trabajo de Tesis para ser presentado como requisito parcial para optar al Título de MAGISTER SCIENTIAE en Economía Agroalimentaria orientación en Desarrollo Rural. Buenos Aires, Argentina, Agosto 2014.
- 9. Allen, R.G., Pereira, L.S., Raes, D. and Smith, M. (2006) Crop Evapotranspiration (Guidelines for Computing Crop Water Requirements). FAO Irrigation and Drainage Paper No. 56.
- 10. INAMHI (2011) Anuarios Estadísticos 1991-2011.
- 11. Montano, T., Quentin, E., Solano, J.C., Maldonado, J. and álvarez, O. (2014) Informe Final, Proyecto 754 SENESCyT-UNL.
- 12. álvarez, O., Montano, T. and Maldonado, J. (2014) La radiación solar global en la provincia de Loja, evaluación preliminar utilizando el método de Hottel. Ingenius. No. 11, 25-31.
álvarez, O., Montano, T., Quentin, E., Maldonado, J. and Solano, J.C. (2014) La radiación solar global en las provincias El Oro, Loja y Zamora Chinchipe, Ecuador. Utilización de datos de reanálisis de la nubosidad diurna. Revista de Climatología, 14, 25-33. - 13. Molina, D., álvarez, O. and Montano, T. (2015) Softwares para el cálculo de la radiación solar teórica con cielo despejado.
- 14. Ulloa, D.R. (1992) Metodología para el cálculo de la distribución del flujo energético potencial anual de radiación solar.
- 15. álvarez, O. and Montano, T. (2017) The Global Solar Radiation in the Southern Region of Ecuador.
- 16. Lautensach-Meyer. http://documents.tips/education/indices-climaticos.html
- 17. Díaz-Padilla, G., Sánchez-Cohen, I., Guajardo-Panes, R.A., Del ángel-Pérez, A.L., Ruíz-Corral, A., Medina-García, G. and Ibarra-Castillo, D. (2011) Mapeo del índice de Aridez y su distribución poblacional en México. Revista Chapingo, Serie Ciencias Forestales y del Ambiente, 17, 267-275.
https://doi.org/10.5154/r.rchscfa.2010.09.069 - 18. UNEP (1992) World Atlas of Desertification. United Nations Environment Programme, Oxford University Press, Oxford, 69 p.
- 19. FAO (1998) Chapter 4 Determination of ETo. CROPWAT 7.0 Climate.
http://file\PROF-P~1\CROPWAT\CROPWAT\CLI\CABINDA.PEN