Paper Menu >>
Journal Menu >>
 Vol.1, No.3, 146-151 (2009) doi:10.4236/health.2009.13024 SciRes Copyright © 2009 http://www.scirp.org/journal/HEALTH/ Health Openly accessible at 2DGE-coomassie brilliant blue staining used to differentiate pasteurized milk from reconstituted milk Yajun Wu1, Ying Chen1*, Bin Wang1, Haiyan Wang2, Fei Yuan1, Guiming Zhao1 1Chinese Academy of Inspection and Quarantine, No. 3, Gaobeidian North Street, Chaoyang District, Beijing, 100123, China 2Internal Mongolia CIQ, No. 12, Erduosi Street, Huhehaote, 010020, China; yqychen@yahoo.com.cn Received 27 October 2009; revised 4 September 2009; accepted 7 September 2009. ABSTRACT Differentiating pasteurized milk and reconsti- tuted milk by scientific approach was necessary to defend consumer from economic fraud of wrong labeling. In this paper 2DGE (2 Dimen- sional Gel Electrophoresis)-coomassie brilliant blue staining method was employed and sig- nificant color intensity changing was observed among raw milk, pasteurized milk, UHT milk and reconstituted milk. For example, the intensity of 10 protein spots including casein and lac- toglobulin reduced more than two folds from pasteurized milk to reconstituted milk. However, DIGE (Differential Gel Electrophoresis) assay showed that the majority protein remained simi- lar level from pasteurized milk to reconstituted milk. Therefore the color fading of coomassie brilliant blue stained 2D gels may be due to other biochemical reaction, such as Maillard reaction, instead of protein degradation. Stability of 2DGE pattern was confirmed by running six gels of the same sample in parallel and software analysis showed that all proteins were at similar level. Two commercialized pasteurized milk samples and one reconstituted milk sample were tested by 2DGE-coomassie blue staining method and re- constituted milk could be easily identified. Keywords: 2DGE; Coomassie Brilliant Blue; Pasteurized Milk; Reconstituted Milk 1. INTRODUCTION China has recently become one of the ten biggest milk producers in the world [1]. Fluid milk products include pasteurized milk and reconstituted milk. Chinese product standard of pasteurized milk (GB5408.1) commanded that only fresh raw milk could be used as raw material for pasteurized milk, while reconstituted milk made by re- solving milk powder in water and sterilization was cate- gorized as sterilized milk (GB5408.2). Compared to pas- teurized milk, reconstituted milk underwent more com- plicated thermal process including spray drying, pasteuri- zation, UHT-treatment or in-bottle sterilization [2]. Be- cause of higher cost at factory location, seasonal variation and transportation, pasteurized milk claims higher price than reconstituted milk. It is reported that the price for 8 tons of raw milk in China is about 20,000 YUAN, while the price for 1 ton of imported milk powder is 14,000-15,000 YUAN which could be made into 8 tons of reconstituted milk [3]. However, as a lot of literature pointed out, inten- sive thermal treatment would compromise milk nutrition and flavor [4], thus consumers prefer pasteurized milk to reconstituted milk and were concerned at possible eco- nomic fraud by labeling reconstituted milk as pasteurized milk. A few analysis techniques such as CE (Capillary Elec- trophoresis), HPLC (High performance liquid chromatog- raphy), ELSD (Evaporative Light-scattering Detector) have been applied in differentiating pasteurized milk and reconstituted milk [2,5]. In these methods, individual pro- tein or sugar ingredient, for example furosine, lactoglobu- line, HMF (hydroxymethylfurfural) is quantified, which demands complicated pre-procession of milk sample. Re- sults of above-mentioned studies revealed significant change of protein component during the procession of milk. In this paper, we reported the application of 2DGE (2 Di- mension Gel Electrophoresis) technique in an overall analysis of protein profile change related to milk thermal procession, revealing a significant alteration of protein component between pasteurized milk and reconstituted milk. Compared to other methods, 2DGE is characterized by simplicity in sample preparation, ability of parallel treatment of several samples and being information-rich. In recent years, 2DGE have been widely applied for food analysis [6-8]. A number of research work have been done in milk proteome such as Equidae milk [9], marsupial Trichosurus vulpecula milk [10], early lacatation milk of the tammar wallaby [11], κ-casein micro-heterogeneity in bovine milk [12] and whey protein [13]. In our proteomic *Corresponding author. Tel: 0086-10-85783587; Fax: 0086-10-85774634  Y. J. Wu et al. / HEALTH 1 (2009) 146-151 SciRes Copyright © 2009 http://www.scirp.org/journal/HEALTH/Openly accessible at 147 147 study of milk product, it showed that 2D patterns after coomassie brilliant blue staining could differentiate pas- teurized milk and reconstituted milk according to the change of color intensity of some protein spots. 2. MATERIAL AND METHODS 2.1. Material Pooled raw milk sample was collected from Sanyuan Dairy Company and immediately sent to milk processing laboratory in Food Institute of China Agricultural Uni- versity for heat processing. Dry milk powder was also collected from the company and reconstituted in accor- dance with the original milk/water ratio, then pasteurized. After preparation, total protein concentration of each sample was determined. Raw milk was centrifuged at 1100g, 20mins and fat cream was removed. Three com- mercialized milk samples were bought from local su- permarket including two pasteurized milk samples from different supplier and one reconstituted milk sample. All samples were stored at 4C for immediate use or at -80C. 2.2. Total Protein Concentration Determination Total protein concentration was determined using Protein Assay Kit (NoVagen, Merk, Darmstadt, Germany) fol- lowing the instruction. The optical absorbance value was recorded on ELISA reader (Thermo Fisher Scientific, MA, USA). Protein concentration was calculated on the basis of Absorbance-Concentration curve of reference BSA standards. 2.3. 2DGE In preparation for IEF running, 10μL milk was mixed with 440μL of solubilization buffer consisting of 8 M urea, 400mg/L CHAPS, 40 mM Tris, 50mg/L pH 4.7–5.9 car- rier ampholytes (Bio-rad, Hercules, California, USA) and 100 mM DTT. The sample was used to hydrate a 17cm pH4.7–5.9 IPG strip for 12 h at room temperature. Hy- drated IPG strips were focused in a PROTEAN IEF Sys- tem (Bio-rad, Hercules, California, USA) at 100 V for 1 h followed by 500 V for 1 h and 1 kV for 1 h before the voltage was increased to 8 kV for a total of 100 kVh. In the second dimensional SDS-PAGE assay, focused strips were first balanced in equilibrium buffer I and buffer II, then embedded with 0.5% agarose on top of 14% poly- acrylamide gels (18×18 cm). Electrophoresis was per- formed in PROTEAN II XL Cell (Bio-rad, Hercules, California, USA) at 5 mA/gel for 2 h followed by 20 mA/gel for 16 h. Gels were stained with Coomassie Bril- liant Blue G-250 and destained in 1% acetic acid. Images were captured on Versadoc Imager (Bio-rad, Hercules, California, USA) in transmission mode. 2.4. DIGE Milk samples were labeled with Cy dye (CyDye DIGE Fluors, GE Healthcare, Buckinghamshire, UK) according to the instruction. Sample pooling strategy was modified as 5μL milk labeled with 1μL cy working solution (400pmol/μL). All of the 10μL labeled sample comprised with 5μL pasteurized milk and 5μL reconstituted milk was pooled together. 2DGE was run following above- mentioned procedure. 2.5. Data Analysis 2DGE profiles caught by Versadoc imager were analyzed with PDQuest software 7.4.0 (Bio-rad, Hercules, Cali- fornia, USA). After automatic spot detection, spot view was performed to display quantity of protein spots. For DIGE imaging, specific cy channel was selected. 2.6. Spot Digestion In-gel digest was conducted following procedure of lit- erature (Holland etal. 2004). Digestion product was pu- rified using Ziptip C18 pipette tip (Millipore, Danvers, MA, USA) following instruction. In the final elution step, peptide was dissolved in 10mg/mL a-cyano-4-hydroxy- cinnamic acid in 0.1%TFA/50%ACN and directly applied to MALDI-TOF analysis. 2.7. MALDI-TOF and Database Search One microliter purified peptide solution was spotted onto a stainless steel MALDI target. Spectra were acquired using a 4700 MALDI-TOF mass spectrometer (Applied Biosystems, Foster City, CA, USA) in delayed extraction mode. Tryptic digests were analyzed in positive ion re- flectron mode with an accelerating voltage of 20 kV, grid voltage at 64% and a delay time of 165 ns. One hundred laser shots were accumulated for each spectrum. Peptide mass fingerprint (PMF) of cut protein spot was analyzed by MS-fit program of the ProteinProspector software (University of California, USA). SwissProt.20071010 database was searched and searching parameter was set as follow: Bos Taurus species, Tol 1 Da, Min matched pep- tide set as 6. 3. RESULTS AND DISCUSSION Raw milk sample was taken from pooled milk container to minimize heterogeneity of protein composition. Milk was processed in lab to ensure the authenticity of proc- essing condition. Different PI ranges were tried to de- termine the best 2DGE condition (2DGE of methods section). As shown in Figure 1, pH4.9-5.7 IPG strip pro- duced the most satisfied 2D pattern in terms of protein spot quantity and separating size among these spots. Total protein concentration of raw milk, pasteurized milk, UHT milk and reconstituted milk was calculated by Biuret method as shown in Table 1. After comparison of the 2D-coomassie brilliant blue staining patterns of the four milk samples shown in Figure 2, we found that for the majority of protein spots, color intensity decreased si gnificantly from raw milk, pasteurized milk, UHT milk to 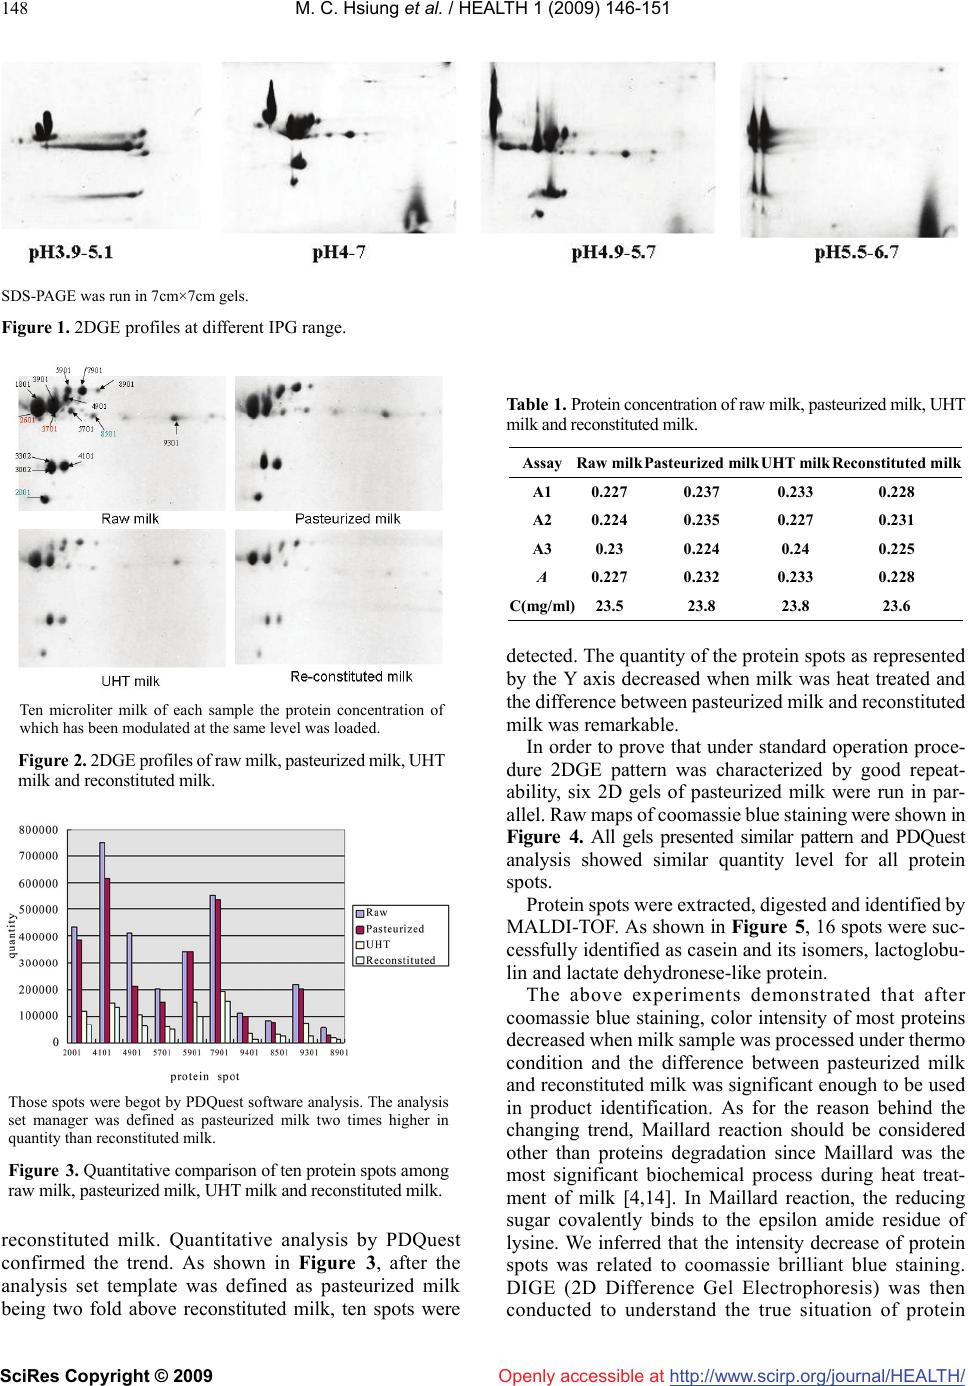 M. C. Hsiung et al. / HEALTH 1 (2009) 146-151 SciRes Copyright © 2009 http://www.scirp.org/journal/HEALTH/ 148 Openly accessible at SDS-PAGE was run in 7cm×7cm gels. Figure 1. 2DGE profiles at different IPG range. Ten microliter milk of each sample the protein concentration of which has been modulated at the same level was loaded. Figure 2. 2DGE profiles of raw milk, pasteurized milk, UHT milk and reconstituted milk. Those spots were begot by PDQuest software analysis. The analysis set manager was defined as pasteurized milk two times higher in quantity than reconstituted milk. Figure 3. Quantitative comparison of ten protein spots among raw milk, pasteurized milk, UHT milk and reconstituted milk. reconstituted milk. Quantitative analysis by PDQuest confirmed the trend. As shown in Figure 3, after the analysis set template was defined as pasteurized milk being two fold above reconstituted milk, ten spots were Table 1. Protein concentration of raw milk, pasteurized milk, UHT milk and reconstituted milk. Assay Raw milkPasteurized milk UHT milk Reconstituted milk A1 0.227 0.237 0.233 0.228 A2 0.224 0.235 0.227 0.231 A3 0.23 0.224 0.24 0.225 A 0.227 0.232 0.233 0.228 C(mg/ml) 23.5 23.8 23.8 23.6 detected. The quantity of the protein spots as represented by the Y axis decreased when milk was heat treated and the difference between pasteurized milk and reconstituted milk was remarkable. In order to prove that under standard operation proce- dure 2DGE pattern was characterized by good repeat- ability, six 2D gels of pasteurized milk were run in par- allel. Raw maps of coomassie blue staining were shown in Figure 4. All gels presented similar pattern and PDQuest analysis showed similar quantity level for all protein spots. Protein spots were extracted, digested and identified by MALDI-TOF. As shown in Figure 5, 16 spots were suc- cessfully identified as casein and its isomers, lactoglobu- lin and lactate dehydronese-like protein. The above experiments demonstrated that after coomassie blue staining, color intensity of most proteins decreased when milk sample was processed under thermo condition and the difference between pasteurized milk and reconstituted milk was significant enough to be used in product identification. As for the reason behind the changing trend, Maillard reaction should be considered other than proteins degradation since Maillard was the most significant biochemical process during heat treat- ment of milk [4,14]. In Maillard reaction, the reducing sugar covalently binds to the epsilon amide residue of lysine. We inferred that the intensity decrease of protein spots was related to coomassie brilliant blue staining. DIGE (2D Difference Gel Electrophoresis) was then conducted to understand the true situation of protein 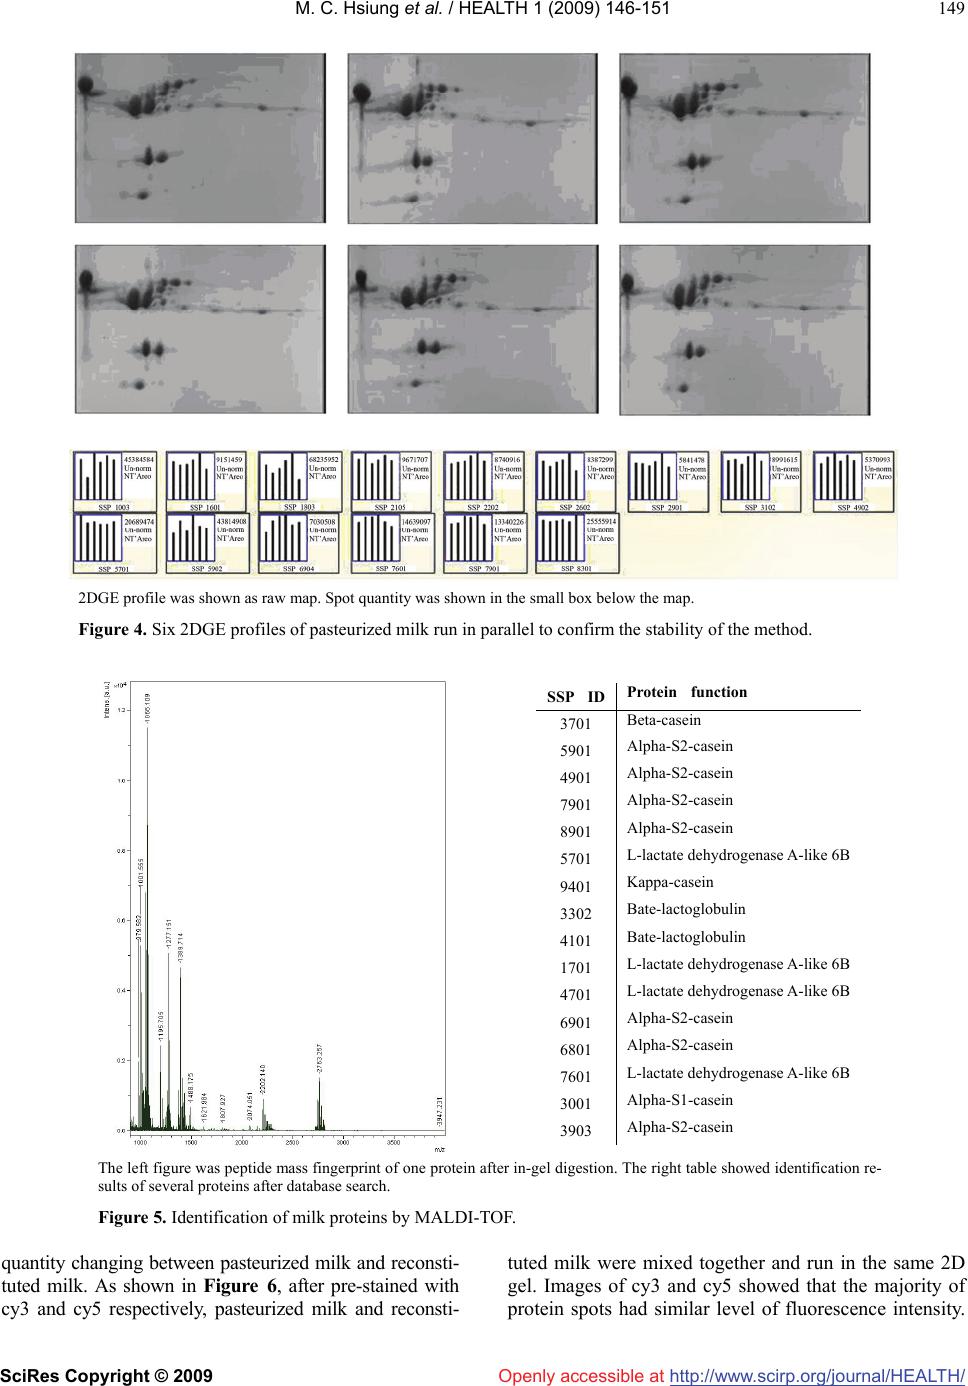 M. C. Hsiung et al. / HEALTH 1 (2009) 146-151 SciRes Copyright © 2009 http://www.scirp.org/journal/HEALTH/ 149 Openly accessible at 2DGE profile was shown as raw map. Spot quantity was shown in the small box below the map. Figure 4. Six 2DGE profiles of pasteurized milk run in parallel to confirm the stability of the method. The left figure was peptide mass fingerprint of one protein after in-gel digestion. The right table showed identification re- sults of several proteins after database search. Figure 5. Identification of milk proteins by MALDI-TOF. quantity changing between pasteurized milk and reconsti- tuted milk. As shown in Figure 6, after pre-stained with cy3 and cy5 respectively, pasteurized milk and reconsti- tuted milk were mixed together and run in the same 2D gel. Images of cy3 and cy5 showed that the majority of protein spots had similar level of fluorescence intensity. SSP IDProtein function 3701 Beta-casein 5901 Alpha-S2-casein 4901 Alpha-S2-casein 7901 Alpha-S2-casein 8901 Alpha-S2-casein 5701 L-lactate dehydrogenase A-like 6B 9401 Kappa-casein 3302 Bate-lactoglobulin 4101 Bate-lactoglobulin 1701 L-lactate dehydrogenase A-like 6B 4701 L-lactate dehydrogenase A-like 6B 6901 Alpha-S2-casein 6801 Alpha-S2-casein 7601 L-lactate dehydrogenase A-like 6B 3001 Alpha-S1-casein 3903 Alpha-S2-casein 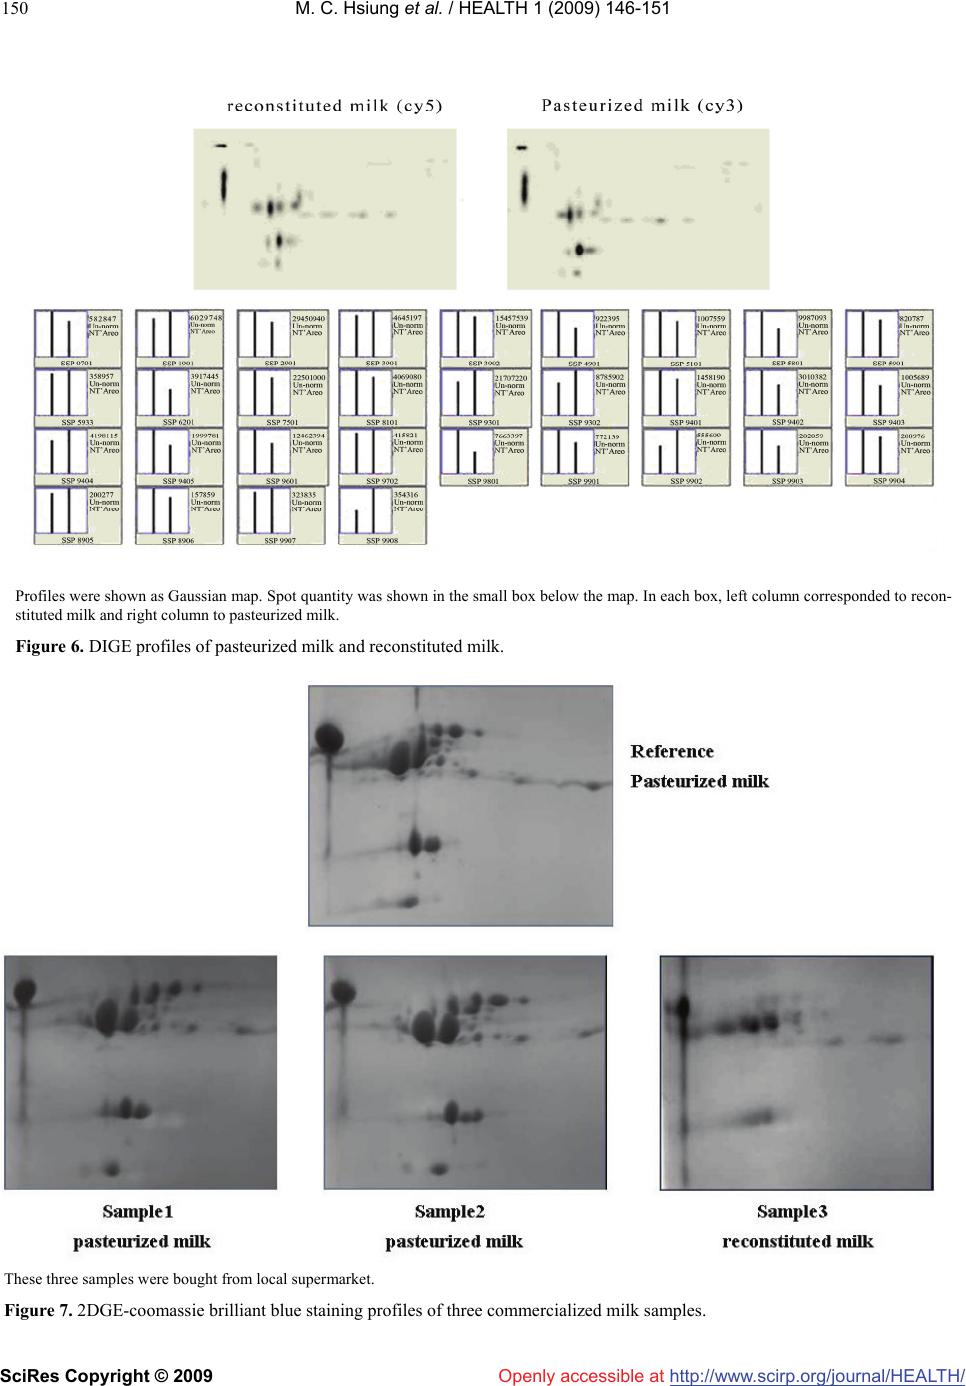 M. C. Hsiung et al. / HEALTH 1 (2009) 146-151 SciRes Copyright © 2009 http://www.scirp.org/journal/HEALTH/ 150 Profiles were shown as Gaussian map. Spot quantity was shown in the small box below the map. In each box, left column corresponded to recon- stituted milk and right column to pasteurized milk. Figure 6. DIGE profiles of pasteurized milk and reconstituted milk. These three samples were bought from local supermarket. Figure 7. 2DGE-coomassie brilliant blue staining profiles of three commercialized milk samples. Openly accessible at  M. C. Hsiung et al. / HEALTH 1 (2009) 146-151 SciRes Copyright © 2009 http://www.scirp.org/journal/HEALTH/ 151 Openly accessible at PDQuest analysis indicated that the quantity difference between pasteurized milk and reconstituted milk was less than two folds. Thus we suppose the remarkable diverge between cydye labeling and coomassie blue staining was due to different staining mechanism. Cydye DIGE fluors were designed to covalently attach to the epsilon amino group of lysine of proteins in a “minimal labeling” way which means the dyes labeled only on a single lysine per protein molecule. Therefore Maillard reaction would not affect staining efficiency. As for coomassie blue, the mechanism of staining is still not well understood ever since it was used in protein staining 45 years ago. How- ever some literatures proved that coomassie blue varied widely in its ability to bind proteins due to its affinity for protein rich in basic amino acids such as lysine, arginine and histidine and its poor ability to bind with glycoprotein [15]. Moreover, since coomassie blue staining was not a “minimal labeling” technique, its labeling efficiency would be affected significantly by Maillard reaction. In fact the content of available lysine has often been used as marker of heat damage affecting dairy protein [16]. In order to verify the practicality of the method, three commercialized milk samples plus the reference pas- teurized milk sample were tested in parallel. As shown in Figure 7, two pasteurized milk samples resulted in similar 2D pattern as reference sample. The reconstituted milk sample showed remarkably different 2D pattern. The seriously reduced level of protein staining indicated that the reconstituted milk sample might undergo stronger thermo treatment than pasteurization. Therefore, 2DGE-coomassie brilliant blue staining technique was proved to be very useful in differentiation between pasteurized milk and reconstituted milk in that color intensity of most proteins decreased significantly after heat treatment. DIGE experiment showed that true quantity of these proteins did not change much. Change of color intensity of different samples may be due to the decrease of labeling efficiency of coomassie blue caused by Mailard reaction after heat treatment. Therefore we could apply 2DGE-coomassie brilliant blue staining method for identification of pasteurized milk and recon- stituted milk. Moreover 2DGE could be used to detect adulterated milk product according to different 2D pattern of protein from different organism or tissue. 4. ACKNOWLEDGEMENT This work was supported by the CAIQ (China Academy of Inspection and Quarantine) Research Fund (2007JK005) and the Eleventh Five-year Plan Research Fund of the Ministry of Science and Technology, People’s Republic of China (2006BAD27B02). We greatly appreciate the kindness of professor Ren Zhenfa of Chinese Agriculture University in helping with sample preparation. REFERENCES [1] A. Fagerberg, (2008) Field study on milk quality in China, Internatinal Dairy Topics, 7(1), 11-12. [2] J. D. Block, M. Merchiers, L. Mortier, A. Braekman, W. Ooghe, R. V. Renterghem, (2003) Monitoring nutritional quality of milk powders: capillary electrophoresis of the whey protein fraction compared with other methods, In- ternational Dairy Journal, 13, 87-94. [3] G. X. Liu, (2003) Reconstituted milk≠Pure fresh milk, City Quality Supervision, 4, 46. [4] M. Lacroix, J. Leonil, C. Bos, G. Henry, G. Airinei, J. Fau- quant, D. Tome, C. Gaudichon, (2006) Heat markers and quality indexes of industrially heat-treated [15N] milk protein measured in rats, J. Agric. Food Chem., 54, 1508-1517. [5] F. Guyomarch, F. Warin, D. Muir, J. Leave, (2000) Lac- tosylation of milk proteins during the manufacture and storage of skim milk powders, International Dairy Journal, 10, 863-872. [6] M. Carbonaro, (2004) Proteomics: present and future in food quality evaluation, Trends in Food Science & Technology, 15, 209-216. [7] M. A. Manso, J. Leonil, G. Jan, V. Gagnaire, (2005) Ap- plication of proteomics to the characterization of milk and dairy products, International Dairy Journal, 15, 845-855. [8] R. O. Donnella, J. W. Hollanda, H. C. Deethb, P. Alewo- oda, (2004) Milk proteomics, International Dairy Journal, 14, 1013-1023. [9] G. Miranda, F. M. Mahé, C. Leroux, P. Martin, (2004) Proteomic tools to characterize the protein fraction of Equidae milk, Proteomics, 4, 2496-2509. [10] S. Kuy, V. C. Kelly, A. M. Smit, D. J. Palmer, G. J. Coo- per, (2007) Proteomic analysis of whey and casein pro- teins in early milk from the marsupial Trichosurus vulpecula, the common brushtail possum, Comparative Biochemistry and Physiology, 2, 112-120. [11] J. Joss, M. Molloy, L. Hinds, E. Deane, (2007) Proteomic analysis of early lactation milk of the tammar wallaby (Macropus eugenii), Comparative Biochemistry and Physiology, 2, 150-164. [12] J. W. Holland, H. C. Deeth, P. F. Alewood, (2004) Pro- teomic analysis of k-casein micro-heterogeneity, Pro- teomics, 4, 743-752. [13] C. J. Hogarth, J. L. Fitzpatrick, A. M. Nolan, F. J. Young, A. Pitt, P. D. Eckersall, (2004) Differential protein com- position of bovine whey: A comparison of whey from healthy animals and from those with clinical mastitis, Proteomics, 4, 2094-2100. [14] P. Resmini, L. Pellegrino, F. Masott, A. Tirelli, F. Prati, (1992) Detection of reconstituted milk powder in raw and in pasteurized milk by HPLC of furosine, Scienzae Tec- nica Lattiero Casearia, 3(3), 169-186. [15] K. McDonald, (2009) Overcoming the Coomassie blues. Drug Discovery & Development. http://www.dddmag.com/Article-Overcoming the Coomas-Sie Blues-060409.aspx [16] S. M. Rutherfurd, P. J. Moughan, (1997) Application of a new method for determining digestible reactive lysine to variably heated protein sources, J. Agric. Food Chem., 45(5), 1582-1586. |

