 Journal of Service Science and Management, 2011, 4, 476-485 doi:10.4236/jssm.2011.44054 Published Online December 2011 (http://www.SciRP.org/journal/jssm) Copyright © 2011 SciRes. JSSM Brand Equity and Brand Loyalty in the Internet Banking Context: FIMIX-PLS Market Segmentation Sandra Maria Correia Loureiro1, Francisco Javier Miranda2 1Department of Economy, Management, and Industrial Engineering, University of Aveiro, Campus of Santiago Aveiro, Santiago, Portugal; 2Departament of Business Management and Sociology, Univeristy of Extremadura, Economics and Business Faculty, Badajoz, Spain. E-mail: Sandra.loureiro@ua.pt, sandramloureiro@netcabo.pt, fmiranda@unex.es Received September 21st, 2011; revised November 2nd, 2011; accepted November 22nd, 2011. ABSTRACT This research presents a model that integrates trust, online risks and benefits, brand awareness/associations, perceived quality and explains ho w they impa ct on brand equ ity and b rand lo yalty in th e con text of in ternet bankin g . The research model estimation uses the PLS approach and applies FIMIX-PLS to segment the sample. The research findings show that the main difference characterizing the two uncovered customer segments lies in the place of residence. Thus, the impact of online benefits on trus t in the service provided is stronger for the first segment than for th e second. For cus- tomers of the second segment, confidence in the bank’s web site information leads to a better perception of service quality and this is very importan t to ensure loyalty to the brand. Keywords: Perceived Quality, trust, Brand Equity, Brand Loyalty, Finite M ixture Modeling 1. Introduction Nowadays, the online service has grown in interest and adoption due to its convenience, ease of use, among other features. According to Pikkarainen et al. [1], since the middle of the last decade of the 20th Century, a radical change has taken place in banking delivery channels to- wards using self-service channels such as online banking services. Internet banking provides consumers with a set of information-related benefits that favors its adoption, including easy access, responsive systems, opportunity for the user to control bank accounts at any time and place, and access to personalized information content to make inve- stment and finance decisions. Internet banking is also an easy way for the consumer to compare and contrast ser- vices [2,3]. In this study we follow the definition proposed by Pik- karainen et al. [1] to define internet banking: “an internet portal, through which customers can use different kinds of banking serv ices ranging from bill payment to making investments”. Thus, the focus is on technologies that cus- tomers use without any interacti on wi t h, or assi st ance from , bank employees. According to Meuter et al. [4], these te- chnologies can be summarized as self-service technolo- gies or SSTs. Several studies have been devoted to understand the factors that encourage or discourage the adoption or ac- ceptance of SST, perceived risk, and trust [1,5-8]. As far as I know, little research exits on antecedents and conse- quences of internet banking brand equity. Thus, the pur- pose of this study is to examine the impact of brand as- sociations/awareness, p erceived quality, and intern et ban- king trust on internet banking brand equity and also the impact of internet banking brand equity and perceived quality on brand lo yalty, using the PLS approach. Th e fi- nite mixture partial least squares (FIMIX-PLS), propo- sed by Hahn et al. [9] is also applied to segment the sa- mple. T his appr oach combin es a fin ite mixtu re pro cedur e with an expectation-maximization (EM)-algorithm spe- cifically coping with the ordinary least squares (OLS)- based predictions of PLS and enables reliable identifica- tion of distinctive customer segments, with their charac- teristic estimates for relationships of latent variables in the structural model. 2. Theoretical Background and Hypotheses The concept of brand equity has been a field of interest to both firms and researchers for several years. There are 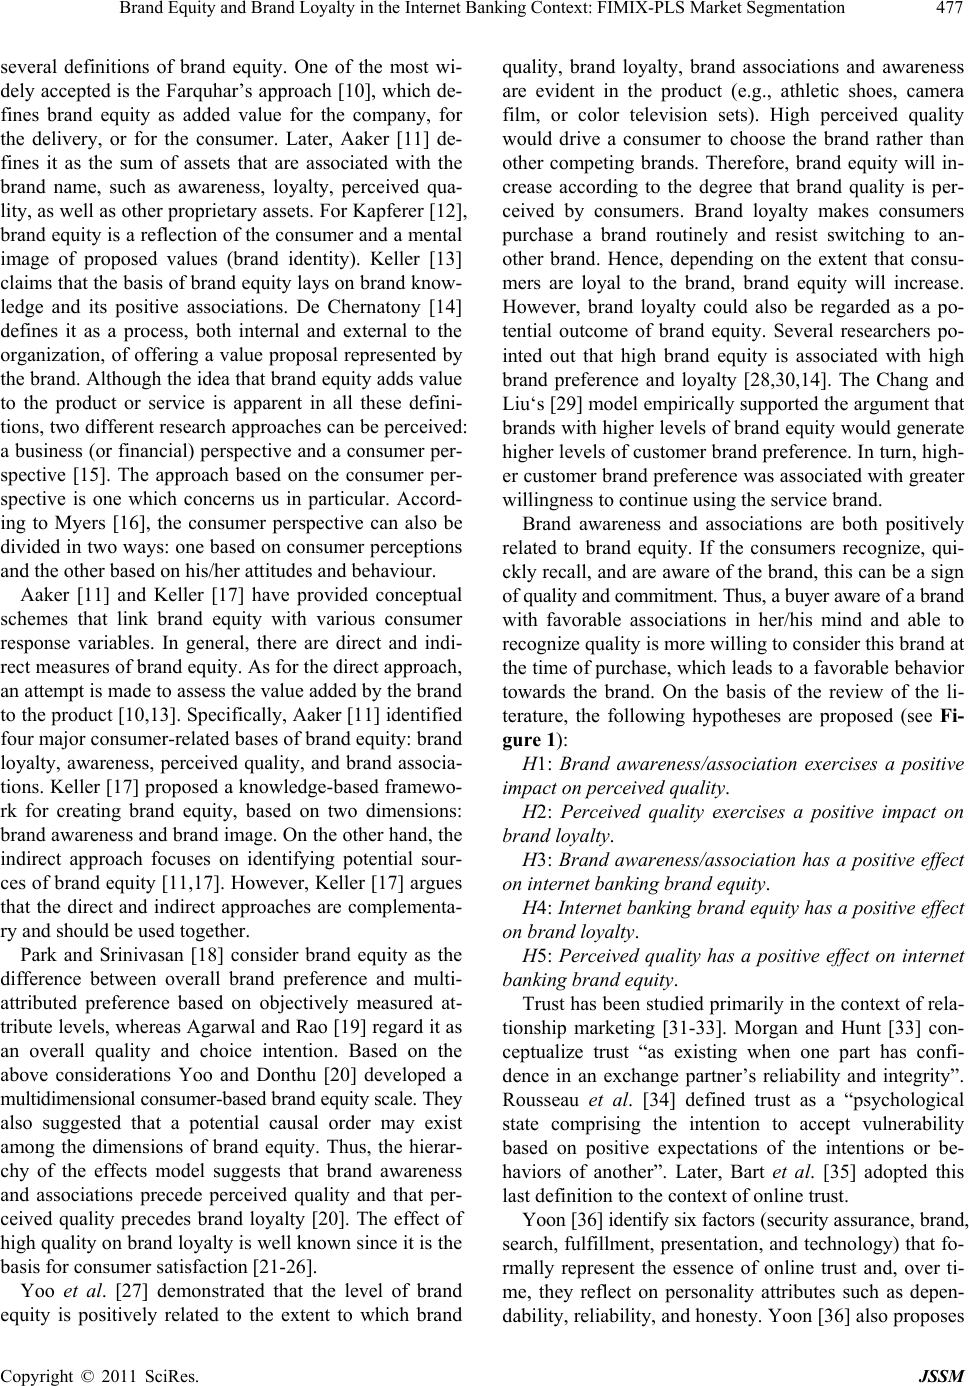 Brand Equity and Brand Loyalty in the Internet Banking Context: FIMIX-PLS Market Segmentation477 several definitions of brand equity. One of the most wi- dely accepted is the Farquhar’s approach [10], which de- fines brand equity as added value for the company, for the delivery, or for the consumer. Later, Aaker [11] de- fines it as the sum of assets that are associated with the brand name, such as awareness, loyalty, perceived qua- lity, as well as other proprietary assets. For Kapferer [12], brand equity is a reflection of the consumer and a mental image of proposed values (brand identity). Keller [13] claims that the basis of brand equ ity lays on brand know- ledge and its positive associations. De Chernatony [14] defines it as a process, both internal and external to the organization, of offering a value proposal represented by the brand. Although the idea that br and equity adds valu e to the product or service is apparent in all these defini- tions, two different research approaches can be perceived: a business (or financial) perspective and a consumer per- spective [15]. The approach based on the consumer per- spective is one which concerns us in particular. Accord- ing to Myers [16], the consumer perspective can also be divided in two ways: one based on consumer perceptions and the other based on his/her attitudes and behaviour. Aaker [11] and Keller [17] have provided conceptual schemes that link brand equity with various consumer response variables. In general, there are direct and indi- rect measures of brand equity. As for the direct approach, an attempt is made to assess the valu e ad ded by th e brand to the product [10,13]. Specifically, Aak er [11] identified four major consumer-related bases of brand equity: brand loyalty, awareness, perceived quality, and brand associa- tions. Keller [17] proposed a knowledge-based framewo- rk for creating brand equity, based on two dimensions: brand awareness and brand image. On the other hand, the indirect approach focuses on identifying potential sour- ces of brand equity [11,17]. However, Keller [17] argues that the direct and indirect approaches are complementa- ry and should be used together. Park and Srinivasan [18] consider brand equity as the difference between overall brand preference and multi- attributed preference based on objectively measured at- tribute levels, whereas Agarwal and Rao [19] regard it as an overall quality and choice intention. Based on the above considerations Yoo and Donthu [20] developed a multidimensional consumer-based brand equity scale. They also suggested that a potential causal order may exist among the dimensions of brand equity. Thus, the hierar- chy of the effects model suggests that brand awareness and associations precede perceived quality and that per- ceived quality precedes brand loyalty [20]. The effect of high quality on brand loyalty is well known since it is th e basis for consumer satisfaction [21-26]. Yoo et al. [27] demonstrated that the level of brand equity is positively related to the extent to which brand quality, brand loyalty, brand associations and awareness are evident in the product (e.g., athletic shoes, camera film, or color television sets). High perceived quality would drive a consumer to choose the brand rather than other competing brands. Therefore, brand equity will in- crease according to the degree that brand quality is per- ceived by consumers. Brand loyalty makes consumers purchase a brand routinely and resist switching to an- other brand. Hence, depending on the extent that consu- mers are loyal to the brand, brand equity will increase. However, brand loyalty could also be regarded as a po- tential outcome of brand equity. Several researchers po- inted out that high brand equity is associated with high brand preference and loyalty [28,30,14]. The Chang and Liu‘s [29] model empirically supported the argument that brands with higher levels of brand equity would generate higher levels of customer brand preference. In turn, high- er customer brand preference was associated with greater willingness to continue using the service brand. Brand awareness and associations are both positively related to brand equity. If the consumers recognize, qui- ckly recall, and are aware of the brand, this can be a sign of quality and commitment. Thus, a buyer aware of a brand with favorable associations in her/his mind and able to recognize quality is more willing to consider this br and at the time of purchase, which leads to a favorable behavior towards the brand. On the basis of the review of the li- terature, the following hypotheses are proposed (see Fi- gure 1): H1: Brand awareness/association exercises a positive impact on perceived quality. H2: Perceived quality exercises a positive impact on brand loyalty. H3: Brand awareness/association has a positive effect on internet banking brand equity. H4: Internet banking brand equity has a positive effect on brand loyalty. H5: Perceived quality has a positive effect on internet banking bra nd equi t y. Trust has been studied primarily in the co ntext of rela- tionship marketing [31-33]. Morgan and Hunt [33] con- ceptualize trust “as existing when one part has confi- dence in an exchange partner’s reliability and integrity”. Rousseau et al. [34] defined trust as a “psychological state comprising the intention to accept vulnerability based on positive expectations of the intentions or be- haviors of another”. Later, Bart et al. [35] adopted this last definition to the con text of online trust. Yoon [36] identify six factors (security assurance, brand, search, fulfillment, presentatio n, and technology) that fo- rmally represent the essence of online trust and, over ti- me, they reflect on personality attributes such as depen- dability, reliability, and honesty. Yoon [36 ] also pro poses Copyright © 2011 SciRes. JSSM  Brand Equity and Brand Loyalty in the Internet Banking Context: FIMIX-PLS Market Segmentation Copyright © 2011 SciRes. JSSM 478 Online Risks Online Be n ef its Intern et Bankin g Trus t Per ce ived Quality Br and Awareness/ association Internet Bankin g Br and Equity Br and Loyalty H1 H9 H8 H7 H5 H3 H6 H4 H2 Figure 1. Proposed conceptual model. that consumer awareness is a mediating variable in web site trust and satisfaction and suggests that online trust can exercise a positive effect on web site awareness. In their seminal work Ambler [37] presents trust as an affective and not a cognitive, analytical construct which can be a proxy for brand equity. On the other hand, Kim et al. [38] empirically found that trust had a positive in- fluence on brand awareness in the health care context. On the strength of the above considerations, the follow- ing hypotheses are proposed (see Figure 1): H6: Internet banking trust positively influences brand awareness/association. H7: Internet banking trust positively influences per- ceived quality. Trust is largely associated with lower perceived risk and customers’ perceptions of security and privacy. Trust acts as a mechanism designed to reduce consumers’ per- ceived risk in internet shopping [39], reduces consumers’ transaction-specific uncertain ty and related risks associa- ted with the possibility that a bank might behave oppor- tunistically [40], and lowers the perceived risk of facing a negative outcome of a transaction by reducing informa- tion complexity [41]. However, the causal relational or- der between trust and perceived risk has not yet been clarified. This research follows the works of Aldás-Man- zano et al. [7] and Yousafzai et al. [8] and states that high trust on internet banking reduces perceived risk. More- over, perceived benefits of online banking (such as easi- ness to use and conven ience) will help to build trust (see Figure 1). H8: Internet banking trust exercises a negative effect on risk perceived by the e-banking consumer. H9: Perceived benefits have a positive effect on inter- net banking trust. 3. Method 3.1. Sample and Data Collection Drawing from literature review, a research model was constructed for this study to explain the relationship a- mong brand awareness/association, perceived quality, in- ternet banking trust, internet banking brand equity, per- ceived quality, and brand loyalty. The questionnaire, in- cluding the items of the latent variables and a section with the socio-demographic variables was first devised in English and then translated into Portuguese. Back trans- lation was used to guarantee that the questionnaire com- municated similar information to all respondents [42,43]. A pilot sample of twenty-three internet banking users (personally interviewed) was used to ensure that the wo- rding of the questionnaire were clear. In order to collect online banking users’ information, we first required authorization from a large international and private bank operating in Portugal to express our need for the purposes of information research. After that, the private bank helped to email invitation letters to its users with a message explaining the need to understand their (the users’) experience in the initial adoption of on- line banking services. The invitation letter also lin ked up to a web site where users could fill out an online ques- tionnaire. The data analysis relies on 496 completed on- line questionnaires, conducted during July of 2009. The overall response rate was 34%.  Brand Equity and Brand Loyalty in the Internet Banking Context: FIMIX-PLS Market Segmentation479 Table 1. The demographic profile of the interviewed inha- bitants of the Portugal. Gender Age Male: 67.5% Female: 32.5 18 - 25: 7.1% 26 - 35: 40.0% 36 - 45: 31.5% 46 - 55: 12.9% 56 - 65: 5.6% 66 - 75: 2.4% >75: 0.5% As Table 1 shows, most of the respondents were ma- les. The majority of respondents (71.5%) were between 26 and 45 year old. We gathered questionnaires from almost all the regions of Portugal regions, though mostly from Lisbon and Oporto. 3.2. Variable and Measurement Brand awareness/associations, perceived quality, brand loyalty, and internet banking brand equity were opera- tionalized on the basis of Yoo & Donthu [27], Zeithaml et al. [26] and Keller [13,17]. Internet banking trust was measured using four items adapted from Bart et al. [35]. Online benefits and online risks were adapted from For- sythe et al. (2006). Each statement of the questionnaire was recorded on a 5-point Likert scale (1 = strongly dis- agree, 5 = strongly agree). 3.3. Data Analysis The Partial Least Squares (PLS) approach was employed to estimate structural paths coefficients, R2, Q2, and the Bootstrap technique. PLS is based on an iterative com- bination of principal components analysis and regression, and aims to explain the variance of the constructs in the model [45]. In terms of advantages, PLS simultaneously estimates all path coefficients and individual item load- ings in the context of a specified model and, as a result, enables researchers to avoid biased and inconsistent pa- rameter estimates. Moreover, it has proved to be an effe- ctive analytical tool to test interactions by reducing type II error [46]. Nevertheless, PLS models are based on pre- diction-oriented measures, not covariance fit like cova- riance structure models developed by Karl Jöreskog (or LISREL program developed by Jöreskog and Sörborn). Besides the variance explained (i.e.R2), as an indicator of how well PLS has met its objective [47]and Stone- Geisser’s Q2 measure, which can be used to evaluate the predictive power of the mode l, Tenenhaus et al. [48] pro- pose the geometric mean of the average communality (outer mode) and the average R2 (inner model) that is limited between values of 0 and 1 as overall goodness of fit (GoF) measures PLS (Cross validated PLS GoF) (see Equation 1). 2 .GoFcommunality R (1) Following the analysis of the structural model, the fi- nite mixture partial least squares (FIMIX-PLS) was ap- plied to segment the sample based on the estimated sco- res for latent variables [49]. Finally, through a t-test, a parametric analysis was employed to determine if the segments were statistically different. For each segment the model was estimated once more and the precision of the PLS estimates was also analyzed. The parametric test uses the path coefficients and the standard errors of the structural paths calculated by PLS with the samples of the two segments, using the following expression of t-value for multi-group comparison test (2) (m = segment 1 sample size and n = segment 2 sample size). 22 22 11 11 22 Segment 1Segment 2 Spx Segment1Segment 2 t mn mN Sp xSExSE mn mn (2) The PLS model is analyzed and interpreted in two stages. First, the adequacy of the measures is assessed by evaluating the reliability of the individual measures and the discriminant validity of the constructs [50]. Then, the structural model is appraised. The adequacy of the measures is assessed by evalua- ting the reliability of the individual items and the dis- criminant validity of the constructs [50]. Item reliability is assessed by examining the loading of the measures on their corresponding construct. All the loadings of scales that measure reflective constructs approximate or exceed 0.707 (see Table 2). This indicates that more than 50 pe- rcent of the variance in the observed variable is explained by the construct [51]. Composite reliability was used to analyze the reliabi- lity of the constructs since this has been regarded as a more exacting measurement than Cronbach’s alpha [52]. Table 2 indicates that all constructs are reliable since the composite reliability values exceed the threshold of 0.7 and even the strictest one of 0.8 [53]. The measures demonstrated convergent validity as the average variance of manifest variables extracted by con- structs (AVE) was at least 0.5, indicative that more vari- ance was explained than unexplained in the variables asso- ciated with a given construct. The criterion used to assess discriminant validity was the square root of AVE, which Copyright © 2011 SciRes. JSSM  Brand Equity and Brand Loyalty in the Internet Banking Context: FIMIX-PLS Market Segmentation Copyright © 2011 SciRes. JSSM 480 Table 2. Measurement results. Construct LV Index ValuesItem LoadingComposite reliabilityAVE* Brand Awareness/associations 4.1 0.87 0.69 BAW1: I can recognize x among other com peting brands 0.851 BAW2: I am aware of x 0.895 BAW3: I can quickly recall the symbol or l ogo of x 0.736 BAW4: I have diffi culty in imagining x in my mind. (r) a Perceived Quality 3.6 0.88 0.78 Q1: The quality of web site services provided by x is extremely high 0.903 Q2: The visual design of web site x has a quality extremely high 0.867 Brand Loyalty 3.6 1.00 1.00 L1: I consider myself to be loyal to x 1.000 Internet Banking Trust 3.8 0.93 0.82 T1: I have more confidence in this web site than other sites I have visited a T2: My overall trust in this site is high 0.864 T3: My overall believability of the information on this site is high 0.940 T4: My overall confidence in the recommendations on this site is high 0.909 Internet Banking Brand Equity 3.4 0.93 0.81 BE1: I sign products in web site x instead of any other bank, even if they are identical 0.876 BE2: Even if another bank has the same characteristics as x, I prefer to sign products in web site x 0.925 BE3: If there is a bank with an online service as good as x, I prefer the x 0.900 Online Benefits 4.1 0.90 0.70 B1: I can sign pr oducts at home 0.876 B2: I can sign products whenever I want 0.843 B3: I can sign products online without going to the agency 0.830 B4: I sign products easily 0.796 Online Risks 2.4 0.90 0.60 R1: I feel lack of confidence in the web site 0.769 R2: I may not get the product I want 0.769 R3: I may sign something by accident 0.722 R4: There may b e some technical failure 0.782 R5: It’s difficult to get information about the prod uct 0.788 R6: It’s too complicated sign products 0.780 *AVE Average Variance Extracted. (r) indicates reversed scoring. a indicates item eliminated. x indicates a brand name.  Brand Equity and Brand Loyalty in the Internet Banking Context: FIMIX-PLS Market Segmentation481 Table 3. Discriminant validity analysis. Correlations of constructs Construct Brand Awareness/associations Online Benefits Internet Banking Brand Equity Brand Loyalty Perceived Quality Online Risks Internet Banking Trust AVE1/2 0.83 0.84 0.90 1.00 0.88 0.78 0.90 Brand Awareness/associations 1.00 0.37 0.59 0.50 0.67 –0.19 0.51 Online Benefits 0.37 1.00 0.37 0.20 0.51 –0.37 0.56 Internet Banking Brand Equity 0.59 0.37 1.00 0.71 0.71 –0.24 0.52 Brand Loyalty 0.50 0.20 0.71 1.00 0.63 –0.14 0.46 Perceived Quality 0.67 0.51 0.71 0.63 1.00 –0.27 0.68 Online Risks –0.19 –0.37 –0.24 –0.14 –0.27 1.00 –0.46 Internet Banking Trust 0.51 0.56 0.52 0.46 0.68 –0.46 1.00 should be greater than the correlation between the con- struct and other constructs in the model [51]. Table 3 shows that all variables have discriminant validity. The Blindfolding technique was used to calculate the Q2 and a nonparametric approach, called Bootstrap, to estimate the precision of the PLS estimates. Thus, 500 samples sets were created in order to obtain 500 estima- tes for each parameter in the PLS model. Each sample was obtained by sampling with replacement of the origi- nal data set [52,45]. As all values of Q2 are positive, the relations in the model have predictive relevance. In the next analytical step, the FIMIX-PLS module of Smart PLS 2.0 was applied to segment the sample based on the estimated scores for latent variables. FIMIX-PLS results were computed for two, three, and four classes. The results reveal that the choice of two segments is ap- propriate for customer segmentation purposes. All rele- vant evaluation criteria considerably decrease in the en- suing numbers of segments (see Tab le 4) and each addi- tional segment has only a small size, which explains a marginal portion of heterogeneity in the overall set of da- ta. Over two thirds of all our observations are well assi- gned to one of the two classes with a probability of more than 0.7. Next, observations are assigned to each segment acco- rding to the segment membership’s maximum a posterio- ri probability. The first segment represents 79% of the sample and the second segment 21%. Table 5 shows the global model and FIMIX-PLS results for two latent seg- ments. Before evaluating goodness-of-fit measures and inner model relationships, all outcomes for segment-spe- cific path model estimations were tested with regard to reliability and discriminant validity. The analysis showed that all measures satisfy the relevant criteria for model evaluation [45]. All path coefficients of the global model are signify- cant at a level of 0.001 or 0.05, apart from the relation- ship between brand awareness/associations and internet banking brand equity. So, the H3 hypothesis is not sup- ported. As shown in Table 5, the relationship between brand awareness/associations and internet banking brand equity is also not significant for the first and second se- gments either. The strength of the relationship between perceived quality and brand loyalty is higher for the se- cond segment than for the first one. However, the stren- gth of the relationship between internet banking trust and online risks seems to be weaker for the second segment than for the first one. Moreover, the two segments dis- play significant differences, except for the structural pa- ths: brand awar eness/asso ciation - > internet banking brand equity, brand awareness/association - > perceived quality, perceived quality - > internet banking brand equity, and perceived quality - > brand loyalty. The final step involves the analysis of each segment, using socio-demographic variables. The analysis reveals that the place of residence is the principal difference that characterizes the two uncovered customer segments. Customers from the first segment, the largest of the sa- mple, live mainly in Oporto (the second largest city in Portugal) and other inner northern and southern Portu- guese regions. These customers ascribe special importan- ce to the perceived online benefits. The perceived bene- fits have a strong and positive implication on internet banking trust and reducing online risk. Trust significantly contributes to improving the favorable associations/awa- reness to the brand. Table 4. Model selection. K = 2 K = 3 K = 4 AIC (Akaike’s Information Cr iterion) 2903.8 3074.5 3046.3 BIC (Bayesian Information Criterion) 3007.6 3257.133231.83 CAIC (Consistent AIC) 3007.7 257.4 232.0 EN (Normed Entropy Statistic) 0.7689 0.6189 0.5020 Copyright © 2011 SciRes. JSSM 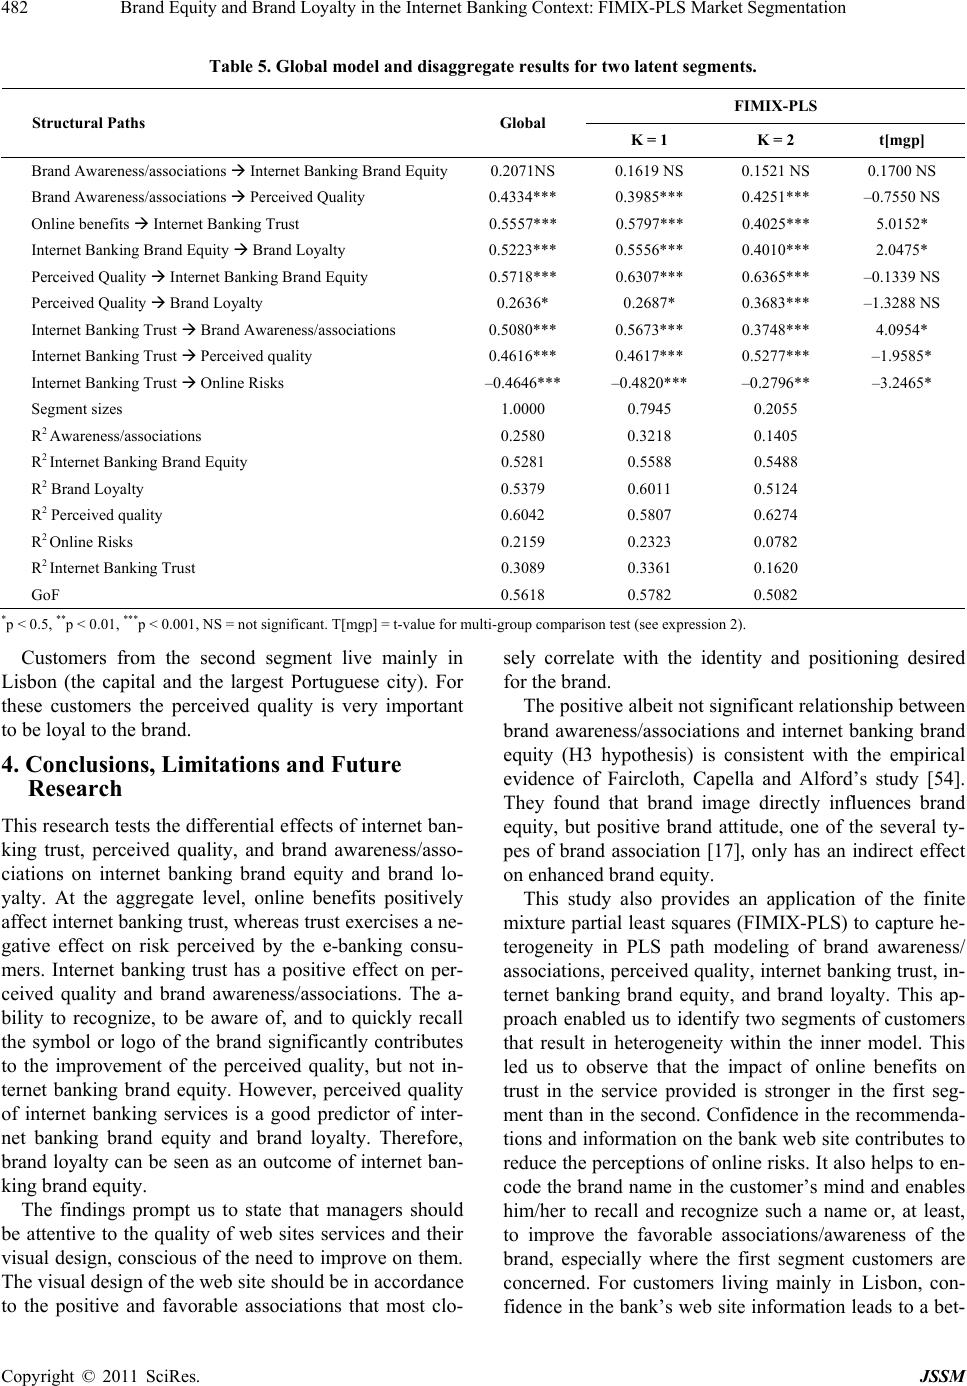 Brand Equity and Brand Loyalty in the Internet Banking Context: FIMIX-PLS Market Segmentation 482 Table 5. Global model and disaggregate results for two latent segments. FIMIX-PLS Structural Paths Global K = 1 K = 2 t[mgp] Brand Awareness/associations Internet Banking Brand Equity0.2071NS 0.1619 NS 0.1521 NS 0.1700 NS Brand Awareness/associations Perceived Quality 0.4334*** 0.3985*** 0.4251*** –0.7550 NS Online benefits Internet Banking Trust 0.5557*** 0.5797*** 0.4025*** 5.0152* Internet Banking Brand Equity Brand Loyalty 0.5223*** 0.5556*** 0.4010*** 2.0475* Perceived Quality Internet Banking Brand Equity 0.5718*** 0.6307*** 0.6365*** –0.1339 NS Perceived Quality Brand Loyalty 0.2636* 0.2687* 0.3683*** –1.3288 NS Internet Banking Trust Brand Awareness/associations 0.5080*** 0.5673*** 0.3748*** 4.0954* Internet Banking Trust Perceived quality 0.4616*** 0.4617*** 0.5277*** –1.9585* Internet Banking Trust Online Risks –0.4646*** –0.4820*** –0.2796** –3.2465* Segment sizes 1.0000 0.7945 0.2055 R2 Awareness/associations 0.2580 0.3218 0.1405 R2 Internet Banking Brand Equity 0.5281 0.5588 0.5488 R2 Brand Loyalty 0.5379 0.6011 0.5124 R2 Perceived quality 0.6042 0.5807 0.6274 R2 Online Risks 0.2159 0.2323 0.0782 R2 Internet Banking Trust 0.3089 0.3361 0.1620 GoF 0.5618 0.5782 0.5082 *p < 0.5, **p < 0.01, ***p < 0.001, N S = not significant. T[mgp] = t-value for multi-group c omparison test ( see expression 2). Customers from the second segment live mainly in Lisbon (the capital and the largest Portuguese city). For these customers the perceived quality is very important to be loyal to the brand. 4. Conclusions, Limitations and Future Research This research tests the differential effects of internet ban- king trust, perceived quality, and brand awareness/asso- ciations on internet banking brand equity and brand lo- yalty. At the aggregate level, online benefits positively affect internet banking trust, whereas trust exercises a ne- gative effect on risk perceived by the e-banking consu- mers. Internet banking trust has a positive effect on per- ceived quality and brand awareness/associations. The a- bility to recognize, to be aware of, and to quickly recall the symbol or logo of the brand significantly contributes to the improvement of the perceived quality, but not in- ternet banking brand equity. However, perceived quality of internet banking services is a good predictor of inter- net banking brand equity and brand loyalty. Therefore, brand loyalty can be seen as an outcome of internet ban- king brand equity. The findings prompt us to state that managers should be attentive to the quality of web sites services and their visual design, conscious of the need to improve on them. The visual design of the web site should be in accordance to the positive and favorable associations that most clo- sely correlate with the identity and positioning desired for the brand. The positive albeit not significant relationship between brand awareness/associations and internet banking brand equity (H3 hypothesis) is consistent with the empirical evidence of Faircloth, Capella and Alford’s study [54]. They found that brand image directly influences brand equity, but positive brand attitude, one of the several ty- pes of brand association [17], only has an indirect effect on enhanced brand equity. This study also provides an application of the finite mixture partial least squares (FIMIX-PLS) to capture he- terogeneity in PLS path modeling of brand awareness/ associations, perceived quality, internet banking trust, in- ternet banking brand equity, and brand loyalty. This ap- proach enabled us to identify two segments of customers that result in heterogeneity within the inner model. This led us to observe that the impact of online benefits on trust in the service provided is stronger in the first seg- ment than in the second. Confidence in the recommenda- tions and information on the bank web site contributes to reduce the perceptions of online risks . It also helps to en- code the brand name in the customer’s mind and enables him/her to recall and recognize such a name or, at least, to improve the favorable associations/awareness of the brand, especially where the first segment customers are concerned. For customers living mainly in Lisbon, con- fidence in the bank’s web site information leads to a bet- Copyright © 2011 SciRes. JSSM  Brand Equity and Brand Loyalty in the Internet Banking Context: FIMIX-PLS Market Segmentation483 ter perception of service quality, which is very important in ensuring loyalty to the brand. The differences encountered may be related to lifestyle, the frequency of recourse to internet banking, since cus- tomers from the second segment live mainly in Lisbon (the capital and the largest Portuguese city). These cus- tomers (living in the big Lisbon) tend to have a lifestyle that lead them to spend much time on the route between home and work (and reverse), so they tend to adopt more often and critically the online services. However, further research is required to understand and to explain the fin- dings. Future research should also examine other nega- tive constructs, such as dissatisfaction factors. The author considers it is also important to introduce variables like communication or commitment, and credibility, and to improve the items used in the variables Finally, the FIMIX-PLS methods could prove to be ve- ry interesting in the case of managerial practices as it can grasp differences even in a small country such as Portu- gal, where one does not anticipate a significant behavior difference. REFERENCES [1] P. Tero, K. Pikkarainen, H. Karjaluoto and S. Pahnila, “Consumer Acceptance of Online Banking: An Extension of the Technology Acceptance Model,” Internet Research, Vol. 14, No. 3, 2004, pp. 224-235. doi:10.1108/10662240410542652 [2] M. J. Bitner, A. L. Ostrom and M. L. Meuter, “Imple- menting Successful Self-Service Technologies,” The Aca- demy of Management Executive, Vol. 16, No. 4, 2002, pp. 96-108. doi:10.5465/AME.2002.8951333 [3] D. S. Johnson, “Achieving Customer Value from Ele- ctronic Channels through Identity Commitment, Calcula- tive Commitment and Trust in Technology,” Journal of Interactive Marketing, Vol. 21, No. 4, 2007, pp. 2-22. doi:10.1002/dir.20091 [4] M. L. Meuter, A. L. Ostrom, R. L. Roundtree and M. J. Bitner, “Self-service Technologies: Understanding Cus- tomer Satisfaction with Technology-Based Service En- counters,” Journal of Marketing, Vol. 64, No. 3, 2000, pp. 50-64. doi:10.1509/jmkg.64.3.50.18024 [5] G.-K. Sonja and R. Faullant, “Consumer Acceptance of Internet Banking: The Influence of Internet Trust,” Inter- national Journal of Bank Marketing, Vol. 26, No. 7, 2008, pp. 483-504. doi:10.1108/02652320810913855 [6] M.-C. Lee, “Factors Influencing the Adoption of Internet Banking: An Integration of TAM and TPB with Per- ceived Risk and Perceived Benefit,” Electronic Com- merce Research and Applications, Vol. 8, 2008, pp. 130- 141. doi:10.1016/j.elerap.2008.11.006 [7] J. Aldás-Manzano, C. Lassala-Navarré, C. Ruiz -Mafé and S. Sanz-Blas, “Key Drivers of Internet Banking Services Use,” Online Information Review, Vol. 33, No. 4, 2009, pp. 672-695. doi:10.1108/14684520910985675 [8] Yousafzai, Shumaila, J. Pallister and G. Foxall, “Multi- Dimensional Role of Trust in Internet Banking Adop- tion,” The Servic e Industries Journal, Vol. 29, N o. 5, 2009, pp. 591-605. doi:10.1080/02642060902719958 [9] Hahn, Carsten, M. D. Johnson, A. Herrmann and F. Huber, “Capturing Customer He terogeneity Using a Finite Mixture PLS Approach,” Schmalenbach Business Review, Vol. 54, No. 3, 2002, pp. 243-269. [10] P. H. Farquhar, “Managing Brand Equity,” Marketing Re- search, Vol. 1, 1989, pp. 24-33. [11] A. David, “Managing Brand Equity: Capitalizing on the Value of a Brand Name,” The Free Press, New York, 1991. [12] J.-N. Kapferer, “Strategic Brand Management: Creating and Sustaining Brand Equity Long Term,” Kogan Page, London, 1998. [13] K. Kevin Lane, “Brand Synthesis: The Multidimensiona- lity of Brand Knowledge,” Journal of Consumer Re- search, Vol. 29, No. 4, 2003, pp. 595-600. doi:10.1086/346254 [14] C. Leslie de, “From Brand Vision to Brand Evaluation: Strategically Building and Sustaining Brands,” Butter- worth-Heinemann, Oxford, 2003. [15] Pappu, Ravi, P. G. Quester and R. W. Cooksey, “Con- sumer-Based Brand Equity: Improving the Measure- ment-Empirical Evidence,” Journal of Product & Brand Management, Vol. 14, No. 3, 2005, pp. 143-154. doi:10.1108/10610420510601012 [16] C. A. Myers, “Managing Brand Equity: A Look at the Impact of Attributes,” Journal of Product and Brand Ma- nagement, Vol. 12, No. 1, 2003, pp. 39-51. doi:10.1108/10610420310463126 [17] K. Kevin Lane, “Conceptualizing, Measuring, and Man- aging Customer-Based Brand Equity,” Journal of Mar- keting, Vol. 57, 1993, pp. 1-22. doi:10.2307/1252054 [18] P. Chan Su and V. Srinivasan, “A Survey-Based Me- thod of Measuring and Understanding Brand Equity and it s Extendibility,” Journal of Marketing Research, Vol . 31, No . 2 , 199 4 , pp. 271-288. doi:10.2307/3152199 [19] M. K. Agarwal and V. R. Rao, “An Empirical Compari- son of Consumer-Based Measures of Brand Equity,” Marketing Letters, Vol. 7, No. 3, 1996, pp. 237-247. doi:10.1007/BF00435740 [20] Y. Boonghee and N. Donthu, “Developing and Validating a Multidimensioanl Consumer-Based Brand Equity Scale,” Journal of Business Research, Vol. 52, 2001, pp. 1-14. doi:10.1016/S0148-2963(99)00098-3 [21] R. L. Oliver, “Measurement and Evaluation of Satisfac- tion Processes in Retail Settings,” Journal of Retailing, Vol. 57, 1981, pp. 25-48. [22] M. J. Bitner, “Evaluating Service Encounters: The Eff- ects of Physical Surroundings and Employee Responses,” Journal of Marketing, Vol. 54, No. 4, 1990, pp. 69-82. doi:10.2307/1251871 [23] C. J. Joseph, Jr., M. K. Brady, G. Tomas and M. Hult, “Assessing the Effects of Quality, Value, and Customer Copyright © 2011 SciRes. JSSM  Brand Equity and Brand Loyalty in the Internet Banking Context: FIMIX-PLS Market Segmentation 484 Satisfaction on Consumer Behavioural Intentions in Ser- vice Environments,” Journal of Retailing, Vol. 76, No. 2, 2000, pp. 193-218. doi:10.1016/S0022-4359(00)00028-2 [24] F. Claes, “A National Customer Satisfaction Barometer: The Swedish Experience,” Journal of Marketing, Vol. 56, No. 1, 1992, pp. 6-21. doi:10.2307/1252129 [25] A. Parasuraman, L. L. Berry and V. A. Zeithaml, “Re- finement and Reassessment of the SERVQUAL Scale,” Journal of Retailing, Vol. 67, No. 4, 1991, pp. 420-450. [26] V. A. Zeithaml, L. Berry and A. Parasuraman, “The Be- havioural Consequences of Service Quality,” Journal of Marketing, Vol. 60, No. 2, 1996, pp. 31-46. doi:10.2307/1251929 [27] Y. Boonghee, N. Donthu and S. Lee, “An Examination of Selected Marketing Mix Elements and Brand Equity,” Journal of Academy of Marketing Science, Vol. 28, No. 2, 2000, pp. 195-211. doi:10.1177/0092070300282002 [28] C. J. Cobb-Walgren, C. A. Ruble and N. Donthu, “Brand Equity, Brand Preference, and Purchase Inte n t , ” Journal of Advertising, Vol. 24, No. 3, 1995, pp. 25-40. [29] H. H. Chang and Y. M. Liu, “The Impact of Brand Equity on Brand Preference and Purchase Intentions in the Ser- vice Industries,” The Service Industries Journal, 29, No. 12, 2009, pp. 1687-1706. doi:10.1080/02642060902793557 [30] J. F. Devlin, A. L. Gwynne and C. T. Ennew, “Antece- dents of Service Expectations,” The Services Industries Journal, Vol. 22, No. 4, 2002, pp. 117-131. doi:10.1080/714005102 [31] P. M. Doney and J. P. Cannon, “An Examination of the Nature of Trust in Buyer-Seller Relationships,” Journal of Marketing, Vol. 61, 1997, pp. 35-51. doi:10.2307/1251829 [32] G. Shankar and R. L. Hess, “Dimensions and Levels of Trust: Implications for Commitment to a Relationship,” Marketing Letters, Vol. 8, No. 4, 1997, pp. 439-448. [33] R. M. Morgan and S. D. Hunt, “The Commitment-Trust Theory of Relationship Marketing,” Journal of Marketing, Vol. 58, 1997, pp. 20-38. doi:10.2307/1252308 [34] D. M. Rousseau, S. B. Bitkin, R. S. Burt and C. Camerer, “Not So Different After All: A Cross-Discipline View of Trust,” Academy of Management Review, Vol. 23, No. 3, 1998, pp. 393-404. doi:10.5465/AMR.1998.926617 [35] B. Yakov, V. Shankar, F. Sulta n and G. L. Urban, “Ar e the Drivers and the Role of Online Trust the Same for All Web Sites and Consumers? A Large-Scale Exploratory Empirical Study,” Journal of Marketing, Vol. 69, 2005, pp. 133-152. doi:10.1509/jmkg.2005.69.4.133 [36] S.-J. Yoon, “The Antecedents and Consequences of Trust in Online Purchase Decisions,” Journal of Interactive Marketing, Vol. 16, 2002, pp. 47-63. doi:10.1002/dir.10008 [37] A. Tim, “How Much of Brand Equity is Explained by Trust?” Management Decision, Vol. 35, No. 4, 1997, pp. 283-292. doi:10.1108/00251749710169666 [38] K. K. Hoon, S. K. Kang, Y. K. Dong, H. K. Jong and S. H. Kang, “Brand Equity in Hospital Marketing,” Journal of Business Research, Vol. 6, 2008, pp. 75-82. [39] S. L. Jarvenpaa and P. A. Todd, “Consumer Reactions to Electronic Shopping on the World Wide Web,” Interna- tional Journal of Electronic Commerce, Vol. 2, 1997, pp. 59-88. [40] Y. Shumaila, J. Pallister and G. Foxall, “A Proposed Model of E-Trust for Electronic Banking,” Technovation, Vol. 23, No. 11, 2003, pp. 847-860. doi:10.1016/S0166-4972(03)00130-5 [41] R. C Mayer, J. H. Davis and F. D. Schoorman, “An Inte- grative Model of Organizational Trust,” Academy of Man- agement Rev iew, Vol. 20, No. 3, 1995, pp. 709-734. doi:10.2307/258792 [42] R. W. Brislin, “Back-Translation for Cross-Cultural Re- search,” Journal of Cross-Cultural Psychology, Vol. 1, No. 13, 1970, pp. 185-216. doi:10.1177/135910457000100301 [43] S. Uma, “Methodological and Theoretical Issues and Advancements in Cross-Cultural Research,” Journal of International Business Studies, Vol. 14, No. 2, 1983, pp. 61-73. doi:10.1057/palgrave.jibs.8490519 [44] F. Sandra, C. Liu, D. Shannon and L. C. Gardner, “De- velopment of a Scale to Measure the Perceived Benefits and Risks of Online Shopping,” Journal of Interactive Marketing, Vol. 20, No. 2, 2006, pp. 55-75. doi:10.1002/dir.20061 [45] W. W. Chin, “The Partial Least Squares Approach to Structural Equation Modeling,” Modern Methods for Business Research, In: G. A. Marcoulides, Ed., Lawrence Erlbaum Associates Publisher, New Jersey, 1998, pp. 295-336. [46] W. W. Chin, B. L. Marcolin and P. R. Newsted, “A Par- tial Least Squares Latent Variable Modelling Approach for Measuring Interaction Effects: Results from a Monte Carlo Simulation Study and an Electronic Mail Emotion/ Adoption Study,” Information Systems Research, Vol. 14, No. 2, 2003, pp. 189-217. doi:10.1287/isre.14.2.189.16018 [47] B. Donald, R. Thompson and C. Higgins, “The Partial Least Squares (PLS) Approach to Causal Modeling, Per- sonal Computer Adoption and Use as an Illustration,” Technology Studies, Vol. 2, 1995, pp. 285-309. [48] T. Michel, V. E. Vinzi, Y.-M. Chatelin and C. Lauro, “PLS Path Modeling,” Computational Statistics & Data Analysis, Vol. 48, 2005, pp. 159-205. doi:10.1287/isre.14.2.189.16018 [49] C. M. Ringle, S. Wende and W. Alexander, Smart PLS 2.0 (beta), www.smartpls.de, Hamburg, 2005, [50] J. Hulland, “Use of Partial Least Squares (PLS) in Stra- tegic Management Research: A Review of Four Recent Studies,” Strategic Management Journal, Vol. 20, No. 2, 1999, pp. 195- 204. doi:10.1002/(SICI)1097-0266(199902)20:2<195::AID-S MJ13>3.3.CO;2-Z [51] E. G. Carmines and R. A. Zeller, “Reliability and Validity Assessment,” Sage Publications, Inc., London, 1979, Copyright © 2011 SciRes. JSSM  Brand Equity and Brand Loyalty in the Internet Banking Context: FIMIX-PLS Market Segmentation Copyright © 2011 SciRes. JSSM 485 [52] F. Claes and D. F. Larcker, “Evaluatin g St ructural Models with Unobservables Variables and Measurement Error,” Journal of Marketing Research, Vol. 28, 1981, pp. 39-50. [53] J. C. Nunnally, “Psychometric Theory,” 2nd Edition, McGraw-Hill, New York, 1978. [54] J. B. Faircloth, L. M. Capella and B. L. Alford, “The Effect of Brand Attitude and Brand Image on Brand Eq- uity,” Journal of Marketing Theory and Practice, 2001, pp. 61-75.
|