 Journal of Service Science and Management, 2011, 4, 469-475 doi:10.4236/jssm.2011.44053 Published Online December 2011 (http://www.SciRP.org/journal/jssm) Copyright © 2011 SciRes. JSSM 469 Using TOPSIS & CA Evaluating Intentions of Consumers’ Cross-Buying Bancassurance Chiang Ku Fan1, Yu Hsuang Lee2, Li Tze Lee3, Wen Qin Lu4 1Department of Risk Management and Insurance, Shih Chien University, Taipei, Chinese Taipei; 2Department and Graduate Institu- tion of Business Administration, Shih Chien University, Taipei, Chinese Taipei; 3Department of Accounting and Information, Over- seas Chinese University, Taipei, Chinese Taipei; 4Department of Industrial Engineering and Management, Hsiuping University of Science and Technology, Taipei, Chinese Taipei. E-mail: ckfan@ms41.hinet.net Received August 23th, 2011; revised October 12th, 2011; accepted November 16th, 2011. ABSTRACT The purpose of this study is to develop and assess an objective research model to weigh the factors that affect intention of cross-buying insurance in banks. The Technique for Order Preference by Similarity to Ideal Solution (TOPSIS) was conduct firstly for the sho rtlist selection of factors of cross-bu ying intention. Then , the factors’ weights of cross-buying intention is also used as the evaluation criteria, and these are calculated effectively by employing Conjoint analysis (CA). This study finding: The TOPSIS is an effective method to help decision makers for the shortlist selection of idea factors of cross-buying intention. In order to collect data to identify and shortlist selection the intentions of cross-buying insurance in banks by Delphi & TOPSIS, and develop an evaluation structure to weigh the intentions of cross-buying insurance in banks, an interview protocol was designed. Keywords: Cross-Buying Intention, TOPSIS, CA 1. Introduction The banking industry in Taiwan has experienced tremen- dous change and an increased growth in earnings from selling insurance products. Banking networks represent the major distribution channel for life insurance products. According to the statistics reported by the Financial Su- pervisory Commission of the Republic of China, as of the third quarter of 2010, bancassurance accounted for over 67% of the total first-year life insurance premium income in Taiwan. Moreover, the number of insurance sales representatives employed by agencies and brokera- ges has tripled to approximately 142,000 people. The in- creased number of agencies and brokerages affiliated with banks account for 70% of all new entries, whereas the growth rate of insurance premiums from these banking agents now exceeds those from traditional direct writers of insurers. In this context, competition in the bancassu- rance industry is at an all-time high, which challenges pro- viders to retain existing customers while attracting new ones. Most banks are looking for the same things—better ways to retain customers and to increase income. Simi- larly, most insurers are looking for the same things—mo- re efficient distribution channels to sell policies and to expand premium incomes. Therefore, financial firms try to stimulate the relation- ship length and depth, and they are particularly focusing their efforts on cross-selling, which increases the breadth of the relationship with each customer (that is, the avera- ge number of services sold to each individual) [1]. In spi- te of cross-selling being associated with increased life- time duration and value [2], prior studies have implied that it is not easy to motivate customers to cross-buy ser- vices or products from the same provider. Day [3] has also found that cross-selling is unlikely to occur if cus- tomers are not willing to buy the services or products that they already have. In fact, not all customers are disposed to engage in expanding their relationships with firms [4]. Customers in some service categories intrinsically tend to develop a multibrand loyalty [5]. Unfortunately, the question of why customers decide to cross-buy and to enhance their relationships with a bank has received scant attention in the literature and has not been appropriately investigated in prior studies [5]. Fur- thermore, the major contributions of previous research have only implied the relationships between the factors of cross-buying intentions, and the weight of those fac- tors that impact crossing-buying intentions in the deci- sion-making process has not been confirmed by research 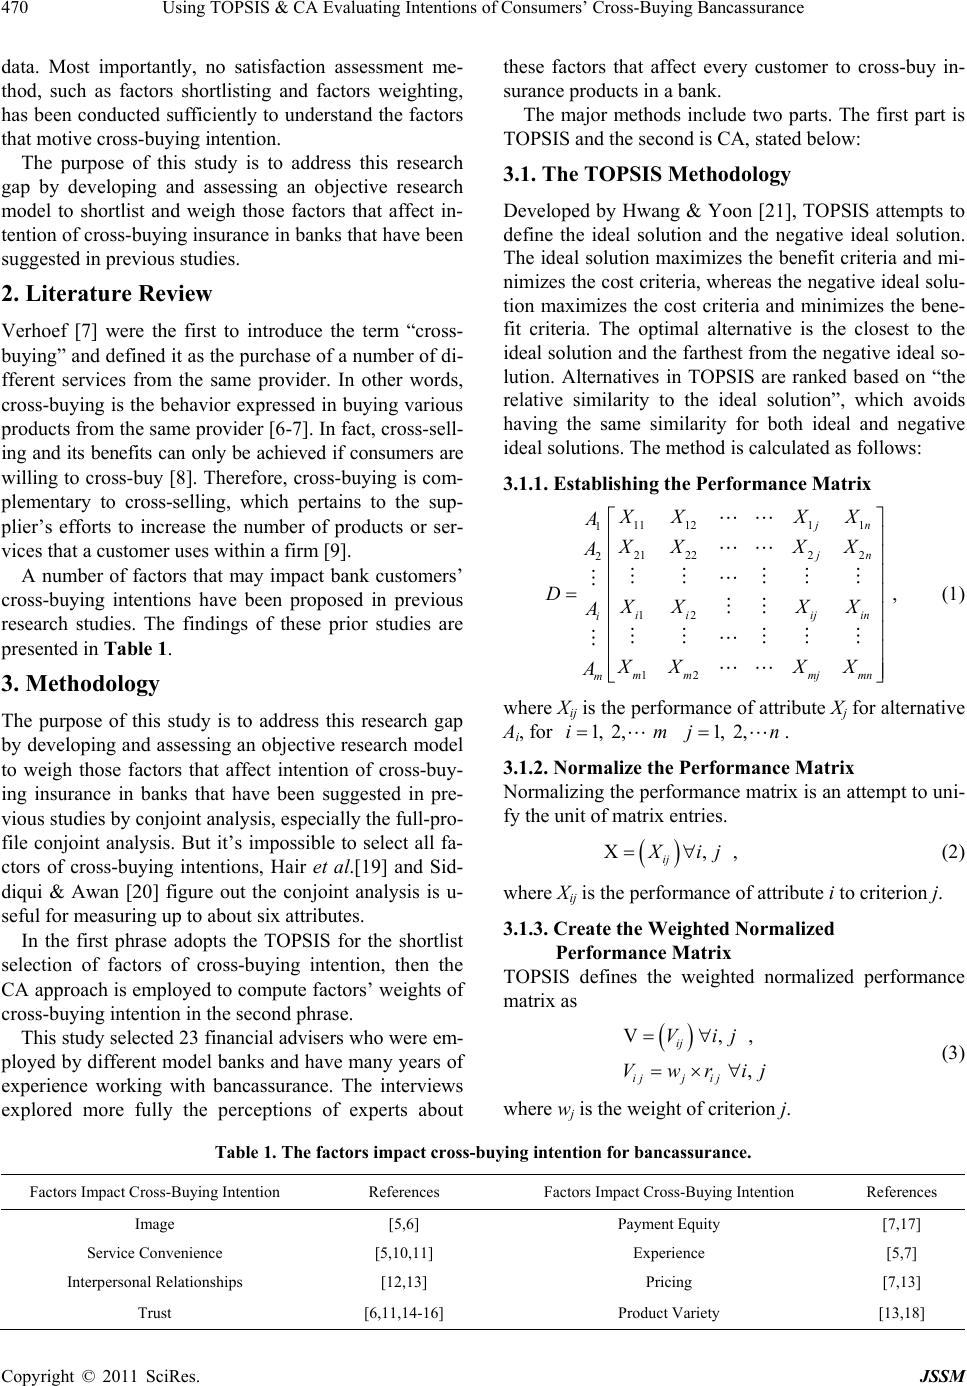 Using TOPSIS & CA Evaluating Intentions of Consumers’ Cross-Buying Bancassurance 470 data. Most importantly, no satisfaction assessment me- thod, such as factors shortlisting and factors weighting, has been conducted sufficiently to understand the factors that motive cross-buying intention. The purpose of this study is to address this research gap by developing and assessing an objective research model to shortlist and weigh those factors that affect in- tention of cross-buying insurance in banks that have been suggested in previous studies. 2. Literature Review Verhoef [7] were the first to introduce the term “cross- buying” and defined it as the purchase of a number of di- fferent services from the same provider. In other words, cross-buying is the behavior expressed in buying various products from the same provider [6-7]. In fact, cross-sell- ing and its benefits can only be achieved if consumers are willing to cross-buy [8]. Therefore, cross-buying is com- plementary to cross-selling, which pertains to the sup- plier’s efforts to increase the number of products or ser- vices that a customer uses within a firm [9]. A number of factors that may impact bank customers’ cross-buying intentions have been proposed in previous research studies. The findings of these prior studies are presented in Table 1. 3. Methodology The purpose of this study is to address this research gap by developing and assessing an objective research model to weigh those factors that affect intention of cross-buy- ing insurance in banks that have been suggested in pre- vious studies by conjoint analysis, especially the full-pro- file conjoint analysis. But it’s impossible to select all fa- ctors of cross-buying intentions, Hair et al.[19] and Sid- diqui & Awan [20] figure out the conjoint analysis is u- seful for measuring up to about six attributes. In the first phrase adopts the TOPSIS for the shortlist selection of factors of cross-buying intention, then the CA approach is employed to compute factors’ weights of cross-buying intention in the second phrase. This study selected 23 financial advisers who were em- ployed by different model banks and have many years of experience working with bancassurance. The interviews explored more fully the perceptions of experts about these factors that affect every customer to cross-buy in- surance products in a bank. The major methods include two parts. The first part is TOPSIS and the second is CA, stated below: 3.1. The TOPSIS Methodology Developed by Hwang & Yoon [21], TOPSIS attempts to define the ideal solution and the negative ideal solution. The ideal solution maximizes the benefit criteria and mi- nimizes the cost criteria, whereas the negative ideal solu- tion maximizes the cost criteria and minimizes the bene- fit criteria. The optimal alternative is the closest to the ideal solution and the farthest from the negative ideal so- lution. Alternatives in TOPSIS are ranked based on “the relative similarity to the ideal solution”, which avoids having the same similarity for both ideal and negative ideal solutions. The method is calculated as follows: 3.1.1. Establishing the Performance Matrix 11 1211 1 21 2222 2 12 12 , jn jn iiij in i mmmj mn m XX XX A XX XX A DXX XX A XX XX A (1) where Xij is the performance of attribute Xj for alternative Ai, for 1, 2, 1, 2,im jn . 3.1.2. Normalize the Performance Matrix Normalizing the performance matrix is an attempt to uni- fy the unit of matrix entries. , , ij ij (2) where Xij is the performance of attribute i to criterion j. 3.1.3. Create the Weighted Normalized Performance Matrix TOPSIS defines the weighted normalized performance matrix as V, , ij ijj ij Vij Vwrij , (3) where wj is the weight of criterion j. Table 1. The factors impact cross-buy i ng intention for bancassurance. Factors Impact Cross-Buying Intention References Factors Impact Cross-Buying Intention References Image [5,6] Payment Equity [7,17] Service Convenience [5,10,11] Experience [5,7] Interpersonal Relationships [12,13] Pricing [7,13] Trust [6,11,14-16] Product Variety [13,18] Copyright © 2011 SciRes. JSSM  Using TOPSIS & CA Evaluating Intentions of Consumers’ Cross-Buying Bancassurance471 3.1.4. Determine the Ideal Solution and Negative Ideal Solution The ideal solution is computed based on the following equations: |, max ' 1,2, , m ij ij VmaxVjJ VjJ i , (4) min , min ', 1,2, , m ij ij VVjJVj i J (5) where 1,2, , n belongs to benefit criteria ,jj j '1,2, , n belongs to cost criteria .jj j 3.1.5. Calculate the Distance between Idea Solution and Negative Ideal Solution for Each Alternative, Using the N-Dimensional Euclidean Distance 2 1 1, 2, , m , n iijj j SVVi (6) 2 1 1, 2,, m , n iijj j SVVi (7) 3.1.6. Calculate the Relative Closeness to the Ideal Solution of Each Alternative * * 1, 2, , m . i i ii S Ci SS (8) where That is, an alternative i is closer to 0 i C 1. A as approaches to 1. i C 3.1.7. Rank the Preference Order A set of alternatives can be preferentially ranked accord- ing to the descending order of . i C 3.2. The Conjoint Analysis Methodology The concept of conjoint analysis is introduced in this section, as well as the determined formula of the utility with the conjoint analysis. The final part in this section discusses the process of data analysis with conjoint analysis. CA has been employed in research for many years. Panda & Panda [22] have described CA as a “what if” experiment in which buyers are presented with different possibilities and asked which product they would buy. In other words, CA is a multivariate technique used spe- cifically to understand how respondents develop prefe- rences for products or services [19]. Sudman & Blair [23] emphasized that CA is not a data analysis process, such as cluster analysis or factor analysis; it can be regarded as a type of “thought experiment,” designed to display how various elements, such as price, brand, and style, can be used to predict customer preferences for a product or service. The basic CA model was computed with the ordinary least squares (OLS) regression parametric mathematic al- gorithm [24] using dummy variable regression. This ba- sic model can be represented as follows [25-26]. 11 UX mki ij ij ij where U(X) = Overall utility (importance) of an attribute; αij = Overall utility of the j level of the i attribute. 1, 2, 1, 2,i im jk Xij = 1, if the jth level of the ith attribute is present, or Xij = 0, otherwise. According to the CA basic model, Churchill & Iaco- bucci [27] presented a six-stage model that is based on the more critical decision points in a conjoint experiment. 3.2.1. Select Attri bu tes The attributes are those that the company can do something about and which are important to consumers. In other words, the company has the technology to make changes that might be indicated by consumer preferences. 3.2.2. Determine Attribute Levels The number of levels for each attribute has a direct bear- ing on the number of stimuli that the respondents will be asked to judge. 3.2.3. Determine Attribute Combinations This will determine what the full set of stimuli will look like. 3.2.4. Select Form of Presentation of Stimuli and Nature of Judgments Typically, three approaches can be used: a verbal descri- ption, a paragraph description, and a pictorial representa- tion. One method for characterizing judgments is to ask respondents to rank the alternatives according to prefer- ence or intention to buy. Another method that is gaining popularity among researchers is to use rating scales. 3.2.5. Decide on Ag greg a ti on of Jud gmen ts This step basically involves the decision as to whether the responses from consumers or groups of consumers will be aggregated. 3.2.6. Select Anal ysi s Technique The final step is to select the technique that will be used to analyze the data. The choice depends largely on the method that was used to secure the input judgments from the respondents. Copyright © 2011 SciRes. JSSM  Using TOPSIS & CA Evaluating Intentions of Consumers’ Cross-Buying Bancassurance 472 4. Results Based on the TOPSIS, a general consensus among ex- perts can be reached to rate their level of agreement to- ward factors of cross buying intention for CA. Those re- sults are in Table 2. The numerical illustration follows the procedure pre- viously discussed. 1). Sample 23 attitude tendency toward cross-buying intentions are graded based upon 23 Delphi panelists’ opinions (see Table 3). 2). Calculate the normalized performance matrix and calculate the weighted normalized performance matrix, using formulae (1) and (2). Table 4 summarizes those results. 3). Determine the distance of the ith alternative from the ideal and negative-ideal solutions, using formulae (6) and (7). Table 5 displays those results. 4). Calculate the relative closeness to the ideal solution and rank the preference order. 5). Calculate the relative closeness to the ideal solution of each alternative, , using formulae (8) and rank the preference order (Table 6). * i C Table 2. Descriptive statistics of expert attitude toward factors of cross-buying intention. Factors of Cross-Buying Intention SA A UD D SD N Mean Std. Deviation Image 21 2 0 0 0 23 4.91 0.29 Service Convenience 15 6 2 0 0 23 4.57 0.66 Interpersonal Relationships 12 11 0 0 0 23 4.52 0.51 Trust 8 8 7 0 0 23 4.04 0.82 Payment Equity 4 9 10 0 0 23 3.74 0.75 Experience 0 6 17 0 0 23 3.26 0.45 Pricing 0 0 0 3 20 23 1.13 0.34 Product Variety 0 0 0 16 7 23 1.70 0.47 Note: strongly agree = 5, agree = 4, undecided = 3, disagree = 2, and strongly disagree = 1. Table 3. 23 Attitude tendency toward cross-buying intentions. Experts Attitude Tendency Cross-Buying Intentions EPT 01 EPT 02 EPT 03 EPT 04 EPT 05 EPT 06 EPT 07 EPT 08 EPT 09 EPT 10 EPT 11 EPT 12 EPT 13 EPT 14 EPT 15 EPT 16 EPT 17 EPT 18 EPT 19 EPT 20 EPT 21 EPT 22 EPT 23 Image 5 55 5 5 555555445555 5 5 5 555 Service Convenience 5 5 5 4 5 5 44545355555 4 5 3 455 Interpersonal Relationship 4 55 4 4 454545455455 4 5 4 455 Trust 3 45 3 5 343434555445 4 3 5 435 Payment Equity 3 44 3 5 353533434444 3 3 5 434 Experience 3 34 3 4 333433333443 3 3 3 334 Pricing 1 11 1 1 112111211111 1 2 1 111 Product Variety 2 2 1 2 1 1 22222212222 2 1 2 211 Note: EPT = Expert. Table 4. Summary of data normalization. EPT 01 EPT 02 EPT 03 EPT 04 EPT 05 EPT 06 EPT 07 EPT 08 EPT 09 EPT 10 EPT 11 EPT 12 EPT 13 EPT 14 EPT 15 EPT 16 EPT 17 EPT 18 EPT 19 EPT 20 EPT 21 EPT 22 EPT 23 Image 0.56 0.51 0.50 0.59 0.52 0.57 0.54 0.58 0.51 0.59 0.51 0.46 0.41 0.49 0.54 0.51 0.49 0.57 0.53 0.56 0.57 0.54 0.50 Service Convenience 0.56 0.51 0.50 0.47 0.52 0.57 0.43 0.46 0.51 0.47 0.51 0.35 0.52 0.49 0.54 0.51 0.49 0.45 0.53 0.34 0.45 0.54 0.50 Interpersonal Relationship 0.45 0.51 0.50 0.47 0.41 0.46 0.54 0.46 0.51 0.47 0.51 0.46 0.52 0.49 0.43 0.51 0.49 0.45 0.53 0.45 0.45 0.54 0.50 Trust 0.34 0.41 0.50 0.36 0.52 0.34 0.43 0.35 0.41 0.36 0.41 0.58 0.52 0.49 0.43 0.41 0.49 0.45 0.32 0.56 0.45 0.32 0.50 Payment Equity 0.34 0.41 0.40 0.36 0.52 0.34 0.54 0.35 0.51 0.36 0.31 0.46 0.31 0.39 0.43 0.41 0.39 0.34 0.32 0.56 0.45 0.32 0.40 Experience 0.34 0.31 0.40 0.36 0.41 0.34 0.32 0.35 0.41 0.36 0.31 0.35 0.31 0.29 0.43 0.41 0.29 0.34 0.32 0.34 0.34 0.32 0.40 Pricing 0.11 0.10 0.10 0.12 0.10 0.11 0.11 0.23 0.10 0.12 0.10 0.23 0.10 0.10 0.11 0.10 0.10 0.11 0.21 0.11 0.11 0.11 0.10 Product Variety 0.22 0.20 0.10 0.24 0.10 0.110.21 0.23 0.20 0.24 0.20 0.23 0.10 0.20 0.21 0.20 0.20 0.23 0.11 0.22 0.23 0.11 0.10 Note: EPT = Expert. Copyright © 2011 SciRes. JSSM  Using TOPSIS & CA Evaluating Intentions of Consumers’ Cross-Buying Bancassurance473 Table 5. Resultant of i S and i S . Image Service Convenience Interpersonal RelationshipTrust Payment EquityExperience Pricing Product Variety i S 0.007 0.019 0.016 0.029 0.033 0.041 0.087 0.075 i S 0.086 0.079 0.077 0.068 0.061 0.050 0.005 0.018 Note: EPT = Expert. Table 6. Summary of the TOPSIS . * i C Cross-Buying Intentions Image Service ConvenienceInterpersonal RelationshipTrust Payment EquityExperience Pricing Product Variety * i C 0.927 0.809 0.825 0.698 0.647 0.549 0.050 0.190 Rank 1 2 3 45 6 8 7 Note: EPT = Expert. Figure 1. Factors affect inte ntion of c ross-buying insurance in a bank. From Table 6, this study decided the TOPSIS was fol- lowing C*1 > C*2 > C*3 > C*4 > C*5 > C*6 > C*8 > C*7. In other words, after conducting the TOPSIS, this re- search showed the experts’ attitude tendency toward the 8 cross-buying intentions from the most important to the least important as followings: (1) Image, (2) Service Convenience, (3) Interpersonal Relationship, (4) Trust, (5) Payment Equity, (6) Experience, (7) Product Variety, and (8) Pricing. However, according to Table 3, most of ex- perts graded “Product Variety” and “Pricing” 1 or 2. Therefore, this study decides to choose top six cross- uying intentions including [19]: Image (0.927), Service Convenience (0.809), Interpersonal Relationship (0.825), Trust (0.698), Payment Equity (0.647), and Experience (0.549) as factors of cross-buying intentions. The ad- justed cross-buying intentions by TOPSIS used in this study are reported in Figure 1. For a formal analysis, the different attribute levels ha- ve to be dummy-encoded in a binary manner. The lowest a- bute level serves as a reference point and gets a binary code of 0 [28]. For any other attribute level, a binary digit of 1 is given if the level is present, and 0 is given if it is not. Due to s of the attributes having two levels, the total number of possible combinations is 26 = 64 alternatives (stimuli). This is far too many possible combinations to be evaluated by any decision maker. Therefore, we had to construct a design of the inquiry that defined a re- stricted set of stimuli to be considered and the pairs of these stimuli to be compared. Starting with a basic orthogonal plan generated by A- delman [29], 8 stimuli were determined (see Table 7). Using the stimuli of the orthogonal array, a difference design was constructed by a randomized procedure fol- lowing the principles given by Hausruckinger & Herker [30]. The CA questionnaire was developed on the basis of some of the literature and shortlist select by TOPSIS methodology, planned with an orthogonal design, and distributed to 300 customers. 269 questionnaires were completed in the survey. According to the CA report (see Table 8), the most important factor was payment equity (relative importance = 31.352%), the second most important factor was image (relative importance = 23.827%) and the third most im- portant factor was interpersonal relationships (relative importance = 14.352 %). Copyright © 2011 SciRes. JSSM  Using TOPSIS & CA Evaluating Intentions of Consumers’ Cross-Buying Bancassurance 474 Table 7. Attribute level and orthogonal plan card of cross-buying intentions. Card No. Factors Attribute Level 123 4 5 6 78 Image 1 Good 0 Not Good 0 1 1 0 1 1 0 0 Services Convenience 1 Convenience0 Not Convenience 0 0 1 0 1 0 1 1 Interpersonal Relationships 1 Good 0 Not Good 0 1 0 1 1 0 1 0 Trust 1 High 0 Low 1 0 1 1 1 0 0 0 Payment Equity 1 Equal 0 Not Equal 1 1 0 0 1 0 0 1 Experience 1 Good 0 Not Good 0 0 0 1 1 1 0 1 Table 8. Relative importance of factors affecting intention of cross-buying insurance in a bank. Factors Variable Part-Worth Utility Relative Importance 1 Good 0.513 Image 0 Not Good 0.000 0.23827 1 Convenience 0.174 Services Convenience 0 Not Convenience 0.000 0.08082 1 Good 0.309 Interpersonal Relationships 0 Not Good 0.000 0.14352 1 High 0.229 Trust 0 Low 0.000 0.10636 1 Equal 0.675 Payment Equity 0 Not Equal 0.000 0.31352 1 Good 0.253 Experience 0 Not Good 0.000 0.11751 Total Utility 2.153 5. Conclusions & Recommendations Since 1964, conjoint analysis study are issued firstly by conjoint measure study of Luce & Tukey [31], and used many years. Since 1998, Hair et al. [19] suggest the con- joint analysis is useful for measuring up to about 6 at- tributes, but no research provides the method of shortlist selections, this study find the TOPSIS is an useful method to help this study to shortlist these attributes. In order to collect data to identify and shortlist selec- tion the intentions of cross-buying insurance in banks by TOPSIS, and develop an evaluation structure to weigh the intentions of cross-buying insurance in banks, an in- terview protocol was designed. The interview question was initially developed based on intentions found in prior studies and shortlist selection by TOPSIS. Moreover, the finalization of the interview question was enabled by means of qualitative research. REFERENCES [1] Y. F. Jarrar and A. Neely, “Cross-Selling in the Financial Sector: Customer Profitability is Key,” Journal of Tar- geting, Measurement and Analysis for Marketing, Vol. 10, No. 3, 2002, pp. 282-297. doi:10.1057/palgrave.jt.5740053 [2] W. Reinartz and J. S. Thomas, “Modeling the Firm-Cus- tomer Relationship,” Working Paper, INSEAD, Fon- tainebleau, 2001. [3] G. S. Day, “Managing Market Relationships,” Journal of Academy of Marketing Science, Vol. 28, No. 1, 2000, pp. 24-30. doi:10.1177/0092070300281003 [4] N. Bendapudi and L. L. Berry, “Customers’ Motivations for Maintaining Relationships with Service Providers,” Journal of Retailing, Vol. 73, No. 1, 1997, pp. 15-38. doi:10.1016/S0022-4359(97)90013-0 [5] P. V. Ngobo, “Drivers of Customers’ Cross-Buying In- tentions,” European Journal of Marketing, Vol. 38, No. 9, 2004, pp. 1129-1157. doi:10.1108/03090560410548906 [6] M. Soureli, B. R. Lewis and K. M. Karantinou, “Factors that Affect Consumers’ Cross-Buying Intention: A Model for Financial Services,” Journal of Financial Services Marketing, Vol. 13, No. 1, 2008, pp. 5-16. doi:10.1057/fsm.2008.1 [7] P. C. Verhoef, “The Impact of Satisfaction and Payment Equity on Cross-Buying: A Dynamic Model for a Multi- Service Provider,” Journal of Retailing, Vol. 77, No. 3, 2001, pp. 359-379. doi:10.1016/S0022-4359(01)00052-5 [8] M. J. Polonsky, H. Cameron, S. Halstead, A. Ratcliffe, P. Stilo and G. Watt, “Exploring Companion Selling: Does the Situation Affect Customers’ Perceptions?” Interna- Copyright © 2011 SciRes. JSSM  Using TOPSIS & CA Evaluating Intentions of Consumers’ Cross-Buying Bancassurance475 tional Journal of Retail & Distribution Management, Vol. 28, No. 1, 2000, pp. 37-45. doi:10.1108/09590550010306764 [9] W. A. Kamakura, N. R. Sridhar and K. S. Rajendra, “Ap- plying Latent Trait Analysis in the Evaluation of Pros- pects for Cross-Selling of Financial Services,” Interna- tional Journal of Research in Marketing, Vol. 8, 1991, pp. 329-349. doi:10.1016/0167-8116(91)90030-B [10] L. L. Berry, K. Seiders and D. Grewal, “Understanding Service Convenience,” Journal of Marketing, Vol. 66, No. 1, 2002, pp. 1-17. doi:10.1509/jmkg.66.3.1.18505 [11] T. C. Liu and L. W. Wu, “Customer Retention and Cross-Buying in the Banking Industry: An Integration of Service Attributes, Satisfaction and Trust,” Journal of Financial Services Marketing, Vol. 12, No. 2, 2007, pp. 132-145. doi:10.1057/palgrave.fsm.4760067 [12] W. J. Reinartz and V. Kumar, “The Impact of Customer Relationship Characteristics on Profitable Lifetime Dura- tion,” Journal of Marketing, Vol. 67, No. 1, 2003, pp. 77-99. doi:10.1509/jmkg.67.1.77.18589 [13] S. P. Jeng, “Effects of Corporate Reputations, Relation- ships and Competing Suppliers’ Marketing Programmes on Customers’ Cross-Buying Intentions,” The Service Industries Journal, Vol. 28, No. 1, 2008, pp. 15-26. doi:10.1080/02642060701725370 [14] E. Anderson and B. Weitz, “Determinants of Continuity in Conventional Industrial Channel Dyads,” Marketing Science, Vol. 8, 1990, pp. 310-323. doi:10.1287/mksc.8.4.310 [15] P. M. Doney and J. P. Cannon, “An Examination of the Nature of Trust in Buyer-Seller Relationships,” Journal of Marketing, Vol. 61, No. 2, 1997, pp. 35-51. doi:10.2307/1251829 [16] T. C. Liu and L. W. Wu, “Relationship Quality and Cross-Buying in Varying Levels of Category Similarity and Complexity,” Total Quality Management, Vol. 19, No. 5, 2008, pp. 493-511. doi:10.1080/14783360802018152 [17] R. N. Bolton, “A Dynamic Model of the Duration of the Customer’s Relationship with a Continuous Service Pro- vider: The Role of Satisfaction,” Marketing Science, Vol. 17, No. 1, 1998, pp.45-65. doi:10.1080/14783360802018152 [18] V. Kumar, M. George and J. Pancras, “Cross-Buying in Retailing: Drivers and Consequences,” Journal of Retail- ing, Vol. 84, No. 1, 2008, pp. 15-27. doi:10.1016/j.jretai.2008.01.007 [19] J. F. Hair, R. E. Anderson, R. L. Tatham and W. C. Black, “Multivariate Data Analysis,” 5th Edition, New Jersey: Prentice-Hall International, 1998. [20] F. A. Siddiqui and M. S. Awan, “Analysis of Consumer Preference of Mobile Phones Through the Use of Con- joint Analysis,” Journal of Management Thought, Vol. 3, No. 4, 2008. [21] C. Hwang and K. Yoon, “Multiple Attribute Decision Making: Methods and Application,” Springer, New York, 1981. [22] T. K. Panda and S. Panda, “An Alternative Method for Developing New Tourism Products,” National Journal (SIDDHANT) of Regional College of Management, Bhu- baneswar, 2001. [23] S. Sudman & E. Blair (1998), Marketing Research, Bos- ton: McGraw Hill. [24] J. Fox, “Applied Regression Analysis, Linear Models, and Related Methods,” Thousand Oaks, CA: Sage, 1997. [25] M. Wedel, W. Kamakura and U. Böckenholt, “Marketing Data, Models and Decisions,” International Journal of Research in Marketing, Vol. 17, 2000, pp. 203-208. doi:10.1016/S0167-8116(00)00010-0 [26] S. N. Tripathi and M. H. Siddiqui, “An Empirical Study of Tourist Preferences Using Conjoint Analysis,” Inter- national Journal of Business Science and Applied Man- agement, Vol. 5, No. 2, 2010, pp. 203-208. [27] G. Churchill and D. Iacobucci, “Marketing Research, Methodological Foundations,” 8th Edition, Harcourt Pub- lishing, London, 2002. [28] R. Helm, L. Manthey, A. Scholl and M. Steiner, “Em- pirical Evaluation of Reference Elicitation Techniques from Marketing and Decision Analysis,” Jenaer chriften zur Wirtschaftswissenschaft, Vol. 2, 2003. [29] S. Addelman, “Orthogonal Main-Effect Plans for Asym- metrical Factorial Experiments,” Technometrics, Vol. 4, 1962, pp. 21-46. doi:10.2307/1266170 [30] G. Hausruckinger and A. Herker, “Die Konstruktion von Schätzdesigns für Conjoint—Analysen auf der Basis von Paarvergleichen,” Marketing eitschrift für Forschung und Praxis, Vol. 14, No. 2, 1992, pp. 99-110. [31] D. R. Luce and J. W. Tukey, “Simultaneous Conjoint Measurement: A New Type of Fundamental Measure- ment,” Journal of Mathematical Psychology, Vol. 1, No. 1, 1964, pp. 1-27. doi:10.1016/0022-2496(64)90015-X Copyright © 2011 SciRes. JSSM
|