Journal of Service Science and Management, 2011, 4, 486-490
doi:10.4236/jssm.2011.44055 Published Online December 2011 (http://www.SciRP.org/journal/jssm)
Copyright © 2011 SciRes. JSSM
Empirical Study on the Performance of Patent
Strategy of China
Zhongguo Shi1,2, Jing Li2
1School of Management and Economics, University of Electronic Science and Technology, Chengdu, China; 2Institute of Electronic
Science and Technology, University of Electronic Science and Technology, Chengdu, China.
E-mail: shizg@uestc.edu.cn
Received August 13th, 2011; revised October 11th, 2011; accepted November 5th, 2011.
ABSTRACT
Since the middle age of 1980s, China has made great performance at economic growth, and greatly improved its inn o-
vation level. As the representation index of innovation activity, patents number growth is also significant. This paper
constructed quintic overdetermined equation of one variable to simulate the trend of patent number varying with the
time from 1985 to 2010, made use of Matlab Software and took the solution of simulation model. By comparing the
simulation curve and rea l data curve, good agreement is obta ined. After F-test and compa rison between the simu lation
data and real data of 2008, 2009, 2010 respectively, it is believed that the simulation model is reliable. Based on this
model, scientific estimation about the variation of Chinese patents from 2011 to 2014 is presented.
Keywords: Patent, Simulation Model, Overdetermined Equation, Ma tlab
1. Introduction
Since 1980s, world economy structure is undergoing a new
round of major adjustment. High technology industry ri-
ses quickly, which radiates and drives the development
of the whole economy. National trades and investment
activities are increasingly active, the competition between
countries and enterprises is more intensive. This entire
situation makes global economy, science and technology
development pattern undergo a profound and significant
change. The overall trend of world economy growth has
had a profound and important influence on the interna-
tional protection of intellectual property rights. Economic
competition between countries has already been transla-
ted into competition of patents. For developed countries,
patent strategy is one part of its global strategy to mono-
polize the global market. More and more countries and
enterprises realize that intellectual property is the most
important strategic resource for improving their core co-
mpetition capabilities [1 ].
As a member of WTO, China has its crucial task to de-
velop high-tech industries in order to meet the challenge
of globalization. In Jun 5, 2008, the Sate Council promu-
lgated “Outline of the national intellectual property stra-
tegy”, decided to put intellectual property strategy into e-
ffect. Based on this situation, it is significant to find the
rule of change and supply some advices for government
decisions by studying on the trend of paten ts qu antities in
China from the middle age of 1980s till now.
2. Data Source and Model Design
From the website of State Intellectual Property Office
(SIPO), we can find the whole sum of patents of China
from 1985 to 2010, including invention patent, utility
model patent and design patent, as shown in Table 1. In
this paper, according to the patents number of each year,
a simulation model of overdetermined equation group is
constructed to describe the variation and developmental
trends of patents from 1985 to 2007. To verify the fitting
degree of the simulation model, patents data of 2008,
2009 and 2010 forecasted by the simulation model was
compared with the real data published at the website of
SIPO. Additionally, statistics test methods such as F test
are used to verify the fitting degree. The whole solving
process is underdone by Matlab software.
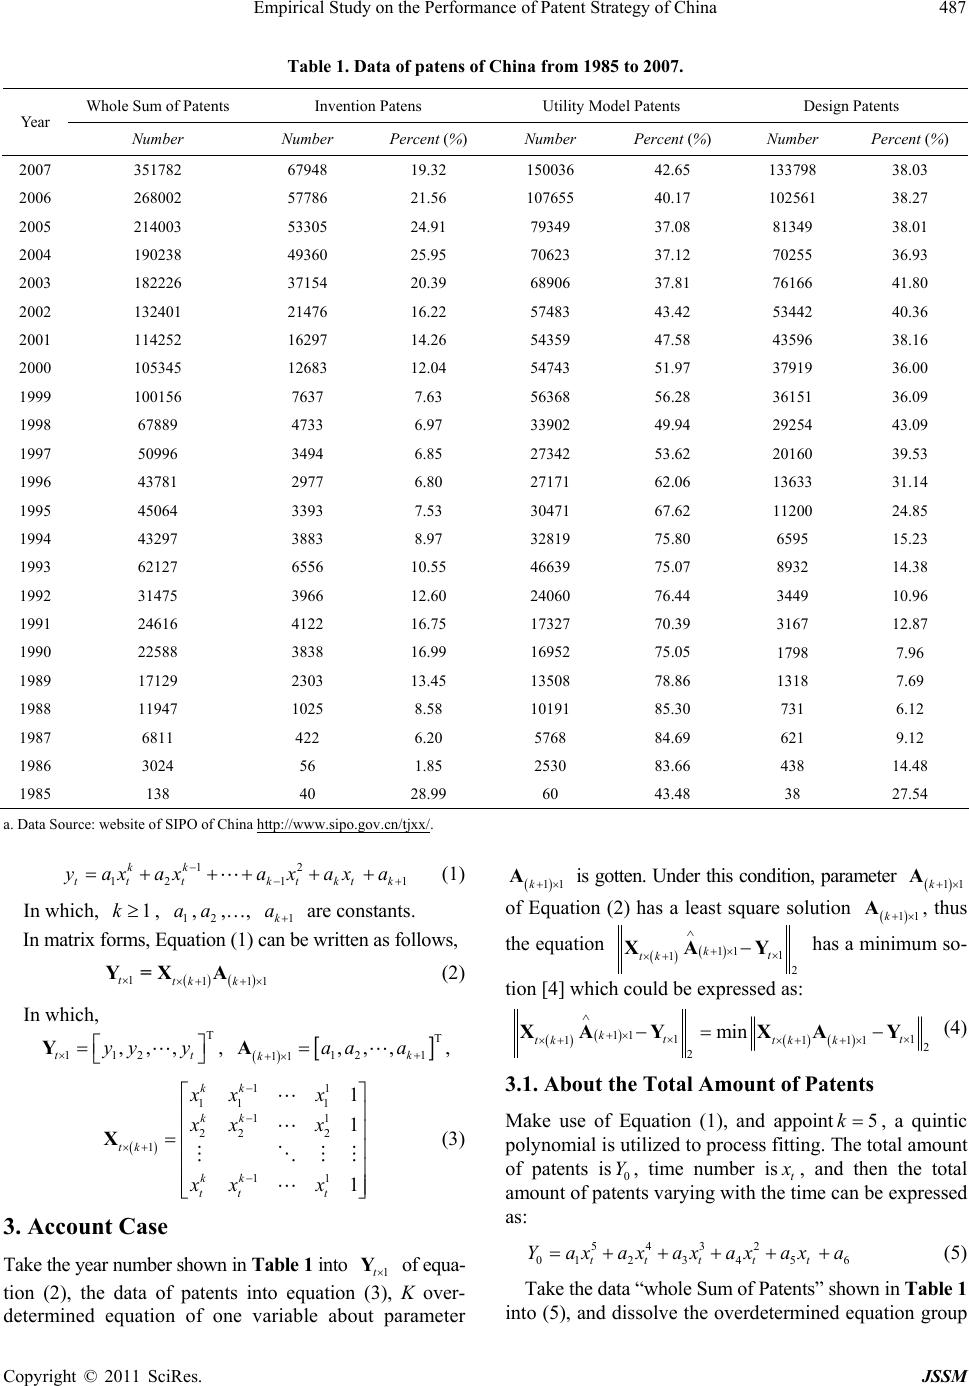
According to the data shown in Table 1, a trend curve
of the number of patents (observed value) varying with
the time (year) is drawn. Assume that there has one par-
allel curve intersect with the trend curve, k points are ob-
tained. Regarding time (year) t
X
as independent varia-
ble, number of patents i as dependent variable, k over-
determined equation of one variable is constructed [2,3],
as shown in Equation (1).
Y
Empirical Study on the Performance of Patent Strategy of China487
Table 1. Data of patens of China from 1985 to 2007.
Whole Sum of Patents Invent io n Pa te ns Utility Model Patents Design Patents
Year
Number Number Percent (%) Number Percent (%) Number Percent (%)
2007 351782 67948 19.32 150036 42.65 133798 38.03
2006 268002 57786 21.56 107655 40.17 102561 38.27
2005 214003 53305 24.91 79349 37.08 81349 38.01
2004 190238 49360 25.95 70623 37.12 70255 36.93
2003 182226 37154 20.39 68906 37.81 76166 41.80
2002 132401 21476 16.22 57483 43.42 53442 40.36
2001 114252 16297 14.26 54359 47.58 43596 38.16
2000 105345 12683 12.04 54743 51.97 37919 36.00
1999 100156 7637 7.63 56368 56.28 36151 36.09
1998 67889 4733 6.97 33902 49.94 29254 43.09
1997 50996 3494 6.85 27342 53.62 20160 39.53
1996 43781 2977 6.80 27171 62.06 13633 31.14
1995 45064 3393 7.53 30471 67.62 11200 24.85
1994 43297 3883 8.97 32819 75.80 6595 15.23
1993 62127 6556 10.55 46639 75.07 8932 14.38
1992 31475 3966 12.60 24060 76.44 3449 10.96
1991 24616 4122 16.75 17327 70.39 3167 12.87
1990 22588 3838 16.99 16952 75.05 1798 7.96
1989 17129 2303 13.45 13508 78.86 1318 7.69
1988 11947 1025 8.58 10191 85.30 731 6.12
1987 6811 422 6.20 5768 84.69 621 9.12
1986 3024 56 1.85 2530 83.66 438 14.48
1985 138 40 28.99 60 43.48 38 27.54
a. Data Sou r ce: website of SIPO of China http://www.sipo.gov.cn/tjxx/.
12
12 1
kk
tt tktktk1
y
axaxa xaxa

   (1)
In which, , ,,…, are constants.
1k1
a2
a1k
a
In matrix forms, Equation (1) can be written as follows,

111
ttk k
 
Y=XA 1
(2)
In which,
112
,,,
tt
yy y


Y,


12 1
11 ,,,
k
kaa a
 A,

11
11 1
11
22 2
1
11
1
1
1
kk
kk
tk
kk
tt t
xx x
xx x
xx x

X

(3)
3. Account Case
Take the year number shown in Tab le 1 into of equa-
tion (2), the data of patents into equation (3), K over-
determined equation of one variable about parameter
1t
Y

11k
A is gotten. Under this condition, parameter

11k
A
11
of Equation (2) has a least square solution
k
A, thus
the equation

11 1
12
kt
tk

 XA Y
has a minimum so-
tion [4] which could be exp re ssed as:
 
11 11
11
2
2
min
ktt
tktk k
 
 
 XA YXAY
11
(4)
3.1. About the Total Amount of Patents
Make use of Equation (1), and appoint, a quintic
polynomial is utilized to process fitting. The total amount
of patents is0, time number ist
5k
Y
x
, and then the total
amount of patents varying with the time can be expressed
as:
5432
012345ttttt
Yaxaxaxaxaxa
6
 (5)
Take the data “whole Sum of Patents” shown in Table 1
into (5), and dissolve the overdetermined equation group
Copyright © 2011 SciRes. JSSM
Empirical Study on the Performance of Patent Strategy of China
488
constructed by (5), solutions of parameters are: a1 = 0.27,
a2 = –12.42, a3 = 239.85, a4 = –2068.49, a5 = 2010.36
and a6 = –12982.78. The comparison figure between
simulation curve and real curve is shown in Figure 1.
3.2. About the Invention Patents
The same as section 3.1, appoint the number of invention
patents is 1
Y and time (year) ist
x
, number of patents
varying with time can be expressed as:
5432
11 23 45ttttt
Yaxaxaxaxaxa
6
(6)
Take the data “invention patents” shown in Table 1 and
dissolve the overdetermined equation group constructed
by (6), the solution of parameters can be obtained as: a1
= –0.322, a2 = 18.33, a3 = –351.53, a4 = 2761.10, a5 =
–7793.88, a6 = 6216.43. The comparison figure between
simulation curve and real curve is shown in Figure 2.
Figure 1. The comparison between simulation curve and real
curve of whole sum of patents.
Figure 2. The comparison between simulation curve and real
curve of invention patents.
3.3. About the Utilize Model Patents
The same as section 3.1, appoint the number of invention
patents is 2 and the time (year) ist
Y
x
, the number of
patents varying with time can be expressed as:
5432
212345ttttt
Y axaxaxaxaxa
6
 (7)
Take the data “invention patents” shown in Table 1 and
dissolve the overdetermined equation group constructed
by (6), the solutions of parameters are obtained as: a1 =
–0.31, a2 = –15.20, a3 = 272.86, a4 = –2213.33, a5 =
11154.51, a6 = –11638.51. The simulation curve and the
real curve are shown in Figure 3.
3.4. About the Design Patents
The same as section 3.1, appoint the number of invention
patents is 3 and the time (year) ist
Y
x
, the number of pa-
tents varying with time can be expressed as:
5432
312345ttttt
Yaxaxaxaxaxa
6
 (8)
Take the data “design patents” shown in Table 1 and
dissolve the overdetermined equation group (8), the solu-
tion of parameters are achieved as: a1 = 0.28, a2 = –15.82,
a3 = 325.24, a4 = –2691.60 , a5 = 9023.94, a6 = –8186.80.
The comparison between simulation curve and real curve
is shown in Figure 4.
3.5. Forecast data
From the above description, it is believed that the fitting
degree between the simulated and real curve is good. The
simulation model can be used to forecast the data of
coming years. The forecast patents data of 2011, 2012,
2013 and 2014 are shown in Table 2.
From Table 2, it can be seen that the growth rate of
patents keeps about 30% in the coming years, and the
growth rate of invention patents is slower than those of
other two kinds of patents.
4. Test Method and Result
4.1. F-Test
In order to test the reliability of the simulation model, F-
test method is used as below.
Total sum of squares of deviations:
2
1
n
Ti
i
Qy


y
(9)
Equation (9) described the total dispersion degree of
the observe value for dependable variable
. Decompounds T to two parts, that is, square sum
of residuals (
12
,, n
yy y
QY
Q) and sum of squares of deviations in
regression (
Q)
TE
QQQ
R
(10)
Copyright © 2011 SciRes. JSSM
Empirical Study on the Performance of Patent Strategy of China
Copyright © 2011 SciRes. JSSM
489
Figure 4. The comparison between simulation curve and real
curve of design patents.
Figure 3. The comparison between simulation curve and real
curve of utilize model patents.
Table 2. The forecast data of the coming years.
Whole Sum of Patents Invention Patens Utility Model Patents Design Patents
Year
Number Growth Rate Number Growth RateNumber Growth Rate Number Growth Rate
2011 1059688 30.05 165191 22.26 437133 26.89 457454 36.45
2012 1407002 32.27 194591 17.79 585540 33.94 627082 37.08
2013 1853821 31.75 227576 16.95 776802 32.66 849842 35.52
2014 2420316 30.56 264400 16.18 1019460 31.23 1137133 33.81
Table 3. Compare between forecast data and real data of 2008-2010.
Year Whole Sum of PatentsInvention Patents Utilize Model Patents Design Patents
Real Data 814825 135110 344472 335243
Forecast data 632683 121381 331258 353126
2010
Error –22.35% –10.16% –3.83% 5.33%
Real Data 581992 128489 203802 249701
Forecast data 513895 103381 250291 248039
2009
Error –11.70% –19.54% 22.81% –0.66%
Real Data 411982 93706 176675 141601
Forecast data 417802 87284 189210 147997
2008
Error 1.41% –6.85% 7.09% 4.51%
In which
2
1
n
Ei
i
i
Qyy




;
2
1
n
Ri
i
Qyy





test statistics

/~, 1
/1
R
E
Qk
FFk
Qnk


nk
(11)
As for the given significance
, test whether
F
is bi-
gger than
F
.
To test Equation (5), 623,nk
We can get QT = 1.9211e + 011; QR = 1.8976e + 011;
QE = 2.3542e + 009. F = 214.9 479 > F0.01(6, 16) = 4.20.
To test Equation (6)
We can get QT = 9.9524e + 009; QR = 9.8738e + 009;
QE = 7.8567e + 007. F = 335.1285 > F0.01(6, 16) = 4.20.
To test Equation (7)
We can get QT = 2.8411e + 010; QR = 2.7276e + 010;
QE = 1.1346e + 009. F = 64. 1051 > F0.01(6, 16) = 4.20.
To test Equation (8)
We can get QT = 3.1413e + 010; QR = 3.1093e + 010;
QE = 3.2013e + 008. F = 25 9.0053 > F0.01(6, 16) = 4.20.
From the test result, we can conclude that Equation (5),
(6), (7) and (8) all reach the significance level.
Empirical Study on the Performance of Patent Strategy of China
490
4.2. Observe Data Test
We can also use the simulation model to forecast the
patents number of 2008, 2009, and 2010, thus further test
the significance of the model by comparing the simula-
tion data with the real data published at the website of
SIPO. The results are shown in Table 3.
From the above table, it can be concluded that the ma-
ximum error between the forecast data and real data is
about 20%, the minimum error is less than 1%. The er-
rors are tolerable, thus the simulation model is effective.
5. Conclusions
Firstly, the trend of patents number varying with time from
1985 to 2010 in China can be explained by quintic over-
determined equation of one variable. Three kinds of pa-
tens, that is, invention patent, utilize model patent and
design patent, are all showing the same trend. The fitting
degree is well. Under the F-test and observe data test, the
significance level of the simulation model is also good.
Secondly, from the simulation model, we can get the
forecast data about the several coming years. It is helpful
for decision support. Thirdly, the distinction between
three kinds of patents is that the growth rate is different,
invention patent is slowest, and design patent is fastest.
This phenomenon should be taken into consideration.
And finally, the curve is steep, especially after 2000, it
shows that self-innovation strategy of China has taken
great effect in the decades.
REFERENCES
[1] S.-J. Zhang, “Literature Review of Patent Strategy Study
in China,” Management of Science and Technology, Vol.
2, 2011, pp. 174-175.
[2] Z.-Q. GE and J. Yang, “The Experimental Study on the
Patent Application of Universities and Colleges in
China,” Journal of UESTC of China, Vol. 35, No. 2, 2006,
pp. 285-286.
[3] Z.-Q. GE, B. Zhang and T. Jin, “An Empirical Study on
the Relationship between Input of R & D and Patent in
China,” Proceedings of 2004 International Conference on
Management Science and Engineering, Orient Academic
Forum Beijing-Sidney, September 15-25, 2004, pp. 118-
120.
[4] B.-J. Li and H.-Y. Liu, “A Solving Method of Overde-
termined Systems,” Journal of Shenyang University of
Technology, Vol. 24, No.1, 2002, pp. 76-77.
Copyright © 2011 SciRes. JSSM