Journal of Electromagnetic Analysis and Applications
Vol. 2 No. 3 (2010) , Article ID: 1548 , 6 pages DOI:10.4236/jemaa.2010.23026
A New Analysis Method for Locating the Focus and for Estimating the Size of the Focus of the Backscatter Light of a LIDAR System
![]()
1School of Atmospheric Physics, Nanjing University of Information Science & Technology, Nanjing, China; 2Department of Electrical Engineering, City College and Graduate School, City University of New York, New York, USA; 3Toshiba Stroke Research Center, University at Buffalo, New York, USA.
Email: nwcao@yahoo.com.cn
Received October 13th, 2009; revised November 14th, 2009; accepted November 19th, 2009.
Keywords: Backscatter Light, Focus, Telescope
ABSTRACT
This paper presents a new analysis method for locating the focus and estimating the size of the focus of the backscatter light of a Lidar system. The formula for calculating the uncertainty of the location of the focus of backscatter light of a Lidar system is given, and the estimation of the size of the focus is also presented. This calculation coincides with the analysis result of ZEMAX software. By the analysis, the experiment to exactly locate the focus of the backscatter light of Lidar is carried out.
1. Introduction
In traditional Lidar systems without optical fiber application and not eye-safe, the low-optical efficiency is due to: 1) The weak optical signal, especially, the Raman return signal; 2) The background noise. In eye-safe Lidar system, the active area of infrared detector (infrared photodiode) is very small, compared with photomultiplier-tube (PMT), only several millimeters [1]. Therefore, to focus the backscatter light completely on the active area of the detector and remove the background noise becomes very important. The size of the field stop (aperture) of telescope at the location of the focus defines the field of view (FOV) of the telescope, dominates the background noise. Smaller field stop greatly reduces the active area of the primary mirror of a telescope [2]; Therefore, the smaller field stop reduces the amount of the Lidar return signal reaching the detector and results in the inefficiency of the Lidar system. Field stop coupling with the size of focus of backscatter light can optimize the optical efficiency of a Lidar system.
Optical fiber has been conveniently and widely used in Lidar measurements. For instance, optical fiber is used in conical-scanning time-correction Lidar system to easily measure wind speed in different directions [3]. Recently, the optical fiber is well used in multi-wavelength Raman-Lidar system for aerosol measurements in the troposphere. The existing fiber to telescope match is discussed in reference [4] in detail. In Lidar measurements, especially, optical fiber-based Raman Lidar measurements, how to improve the Signal to Noise Ratio is a critical issue which has been investigated by many researchers. A novel rotational Raman and Rayleigh Lidar system incorporate a fiber-based optical element to analyze the narrow Raman spectral feature [5]. For noncoaxial Lidar system, how to match the telescope to optic fiber is analyzed in reference [6].
The combination of the Numerical Aperture (NA) (NA defines the maximal acceptance cone of the optical fiber as , where
  is the refractive index of the fiber core, and
  is the refractive index of the fiber cladding) of optical fiber and the size of the focus of a telescope can dominate the field of view (FOV) of a telescope, therefore, the maximal couple efficiency of the optical fiber and the telescope can be obtained. Reversely, the Numerical Aperture (NA) of optical fiber can also be designed by the size of focus of telescope.
Therefore, accurately locating the focus of the backscatter light of the Lidar system and estimating the size of the focus will contribute to the improvement of the optical efficiency in traditional Lidar system, and in optical fiber coupled telescope Raman or wind Lidar system, as well as in the infrared Lidar system with infrared photodiode.
In general, the researchers estimate the size of the focus of the backscatter light of a Lidar system by the limitation of the diffraction (airy disk) of the primary mirror of the telescope to collimate backscatter light of Lidar to the active area of the detector or the optical fiber. Actually, the size of the focus of the backscatter light is much larger than the airy disk. In this case, much energy of backscatter light will be lost. To locate the focus of a telescope, researchers have considered pointing the telescope to the moon; however, it is not convenient [7]. Furthermore, the location of the focus is not accurate and the observed focus is blurry.
This paper presents a new analysis method and relative experiment to accurately locate the focus of the backscatter light of a Lidar system and to estimate the size of the focus.
2. Theoretic Analysis for Locating the Focus and Estimating the Size of the Focus of the Backscatter Light of a Lidar System
Theoretically, the size of the focus of the backscatter light of a Lidar system is identical to the airy disk, relative to the wavelength of the backscatter light and diameter of the primary mirror of a telescope (the size of airy disk is defined as , where
  is the diameter of the primary mirror,
  is the wavelength of backscatter light,
  is the focus of telescope). Actually, the blurry of image (or image error) of telescope optical systems always occurs. The divergence of incident light is not zero; therefore, the field of view of a telescope is not zero. The size of the focus of a telescope is much larger than the size of airy disk; therefore, we cannot regard the actual focus as an airy disk. This paper analyzes the location uncertainty of backscatter light’s focus and the uncertainty of the focus size, according to the image optical path of a telescope.
For easy discussion, the optical path of Newtown telescope is shown in Figure 1. The refraction index of the object space and the image space is n; the object space and image space of Newtown telescope overlap completely; the propagation direction of incident light in object space reverses in image space. Figure 1 shows that the image distance variation is  and the image height variation is
  from the variation of incident angle
 .
.  and
and  will be close to zero when
  is close to zero. Variation
  (
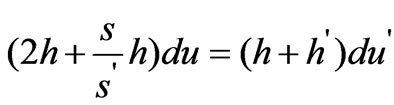
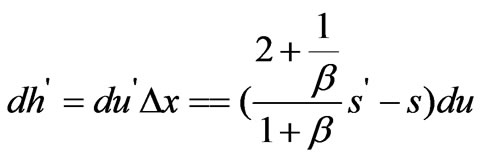
( ) is introduced for easy discussion. From Figure 1, Equations (1) and (2) can be easily deducted as follows:
 (1)
(1)
 (2)
(2)

Figure 1. Analysis of optical path of telescope ( : the object height,
 : image height,
 : incident angle,
 : the angle in image space corresponds to
  in object space,
 : variation of incident angle,
 : corresponds to
  in object space,
 : object distance,
 : image distance,
 : variation of image distance,
 : variation introduced for easy discussion)
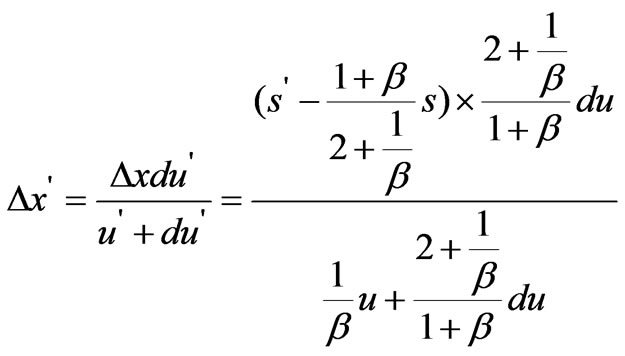
Equation (3) can be obtained from the combination of Equations (1) and (2):
 (3)
(3)
 is the image distance.
The refraction index in object space is identical to that in image space, Equation (4) exists.
 (4)
(4)
Combine differential calculation of Equations (4) and (3), Equation (5) or (6) is obtained at 
 (5)
(5)
 (6)
(6)
Take  into account, Equation (7) can be obtained:
 (7)
(7)
where  is the object distance,
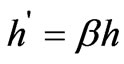 (8)
(8)
 is amplification ratio of the image.
Equation (9) is obtained from the combination of (7) and (8).
 (9)
(9)
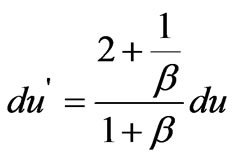
when the object distance is very large, the amplification ratio of the image very small and we can assume it is zero. In this case,  occurs. It can be seen in Equation (9) that
  is identical to a certain value when
  is very small. (Incident beam is parallel.) It means that the parallel beam will be focused by telescope.
Equation (10) can be obtained by (2):
 (10)
(10)
(11) is obtained with consideration of (9):
 (11)
(11)
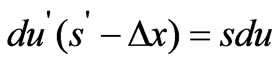
Combine Equations (1) and (11), we get Equation (12):
 (12)
(12)
From the geometrical relationships of Figure 1, we have:
 (13)
(13)
According to Equations (9–13), we have Equation (14):
 (14)
(14)
According to the above equations, we build the curve showing the relationship between , the divergence, and the object distance, as well as the relationship between
 , the divergence, and the objective distance. Figure 2 shows the relationship between
  and the divergence. The uncertainty of image distance
  is proportional to the divergence of the incident beam; as a result,
  becomes larger when the divergence of the incident beam becomes larger. And
  is also relative to object distance.
  becomes smaller at larger object distance. When object distance is 1000m (assume it is possible that the axis of the incident beam is parallel to the axis of telescope),uncertainty of image distance
  is 1 millimeter at divergence of 1 mrad; if object distance is larger than 1000m,
  is less than 1 millimeter.
  is close to zero at object distance at
 . Figure 3 shows the relationship between the uncertainty of the size of image disk (
 ) and divergence of the
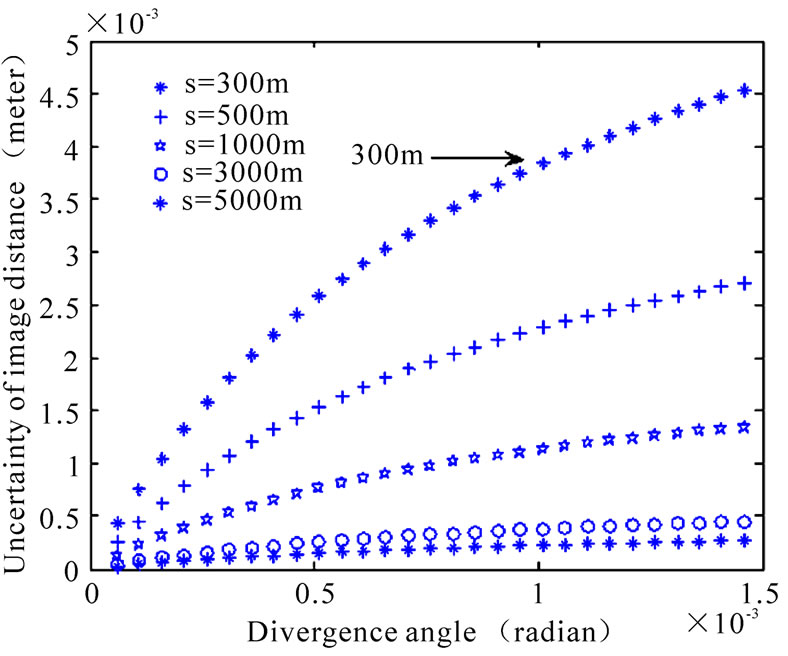
Figure 2. The relationship between  and divergence of incident beam
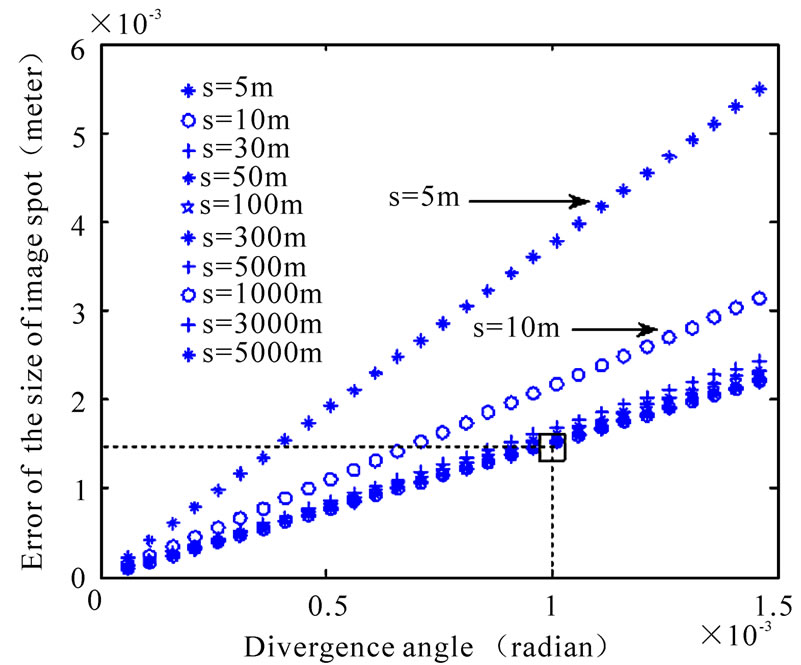
Figure 3. The relationship between  and divergence
incident beam.  is relative to object distance and is proportional to divergence of incident beam.
  becomes larger at larger divergence of incident beam and becomes smaller at larger object distance.
3. Focus Size of Backscatter Light of a Lidar System
According to Equation (14), we can assume that the axis of the incident beam is parallel to the axis of the telescope in the case of ,
,  is the divergence of the incident beam. In the case of large object distance (
 is close to infinite), we put
  into (14) to obtain
 . This indicates that the location of focus does not vary with the variation of divergence of incident beam. In this case, we obtain
  by Equation (12), the uncertainty of the size of focus is double of focal length times divergence of incident beam. The size of focus is 0.3 millimeter at divergence of 0.1 mrad (mili-radian) at
 . According to diffraction limitation (airy disk), the diffraction angle is about 10-5 rad (radian) if the diameter of laser beam is 10 millimeter, and the radius of the airy disk is about 0.015 milimeter. The actual size of focus is much larger than that of the airy disk; it is about 10~200 times of the airy disk.
Figure 4 presents the uncertainty of the location and the size of the focus. Figure 5 corresponds to Figure 4, it is image disk at different image distance analyzed by ZEMAX software which is powerful, accurate and affordable software for all aspects of optical system design. The middle image disk 3 TSA (min) (Transverse spherical aberration) corresponds to the focus of the laser beam [5]. Compared Figure 3 to Figures 4 and 5, Figure 3 is analysis result by the above optical path, it shows the size of image disk relative to object distance; the image disk is smaller if the object distance larger; the smallest image disk is the size of focus, corresponding to object distance at infinity. From Figures 4 and 5, we can see that the image disk 3 is smaller than image disk 1, 2, 4, and 5; the image disk 3 correspond to the smallest Transverse spherical aberration, the focus spot. Figure 3 coincides with Figures 4 and 5 analyzed by ZEMAX software.

Figure 4. The optical path distribution near TSA

Figure 5. The image disks near TSA analyzed by ZEMAX software
4. Experiment
According to above analysis, the focal spot is the smallest image disk. In principle, the location of the focus of backscatter light of a Lidar system can be decided by focusing one laser beam with telescope, but it does not provide enough accuracy. We use three identical parallel laser beams that distributed in one circle symmetrically to accurately locate the focus of the Newton telescope. The design is shown in Figure 6. The He-Ne laser (Melles Griot company) beam is separated to three beams by two beam splitters (with about 50% transmission, about 50% reflection) and two reflect mirrors, the three beams are reflected respectively by three 45o reflect mirrors and transmit down vertically, the three 45o reflect mirrors distribute in one circle symmetrically. Figure 7 shows the experimental setup: the He-Ne laser, the beam splitters, and the reflect mirrors are all fixed on an optical table with 50 cm length and 45 cm width, and the center of all mirrors and beam splitters are all at identical height to the optical table. The He-Ne laser beam was aligned to make all separated beams incident at the center of these optical components. The laser beams reflect at 45o incident angle and then transmit down vertically through the

Figure 6. Schematic diagram for three parallel beams generation
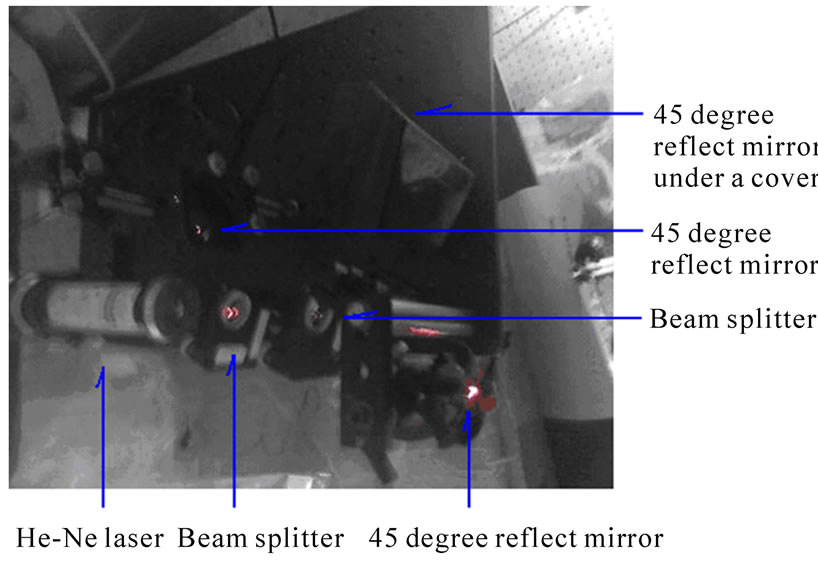
Figure 7. Experimental setup for three parallel beams generation
pinhole of the optical table. After finely beam alignment, the optical table with these optical components is fixed directly above the telescope at the height of 10 meters from the center of the primary mirror. The three beams transmit downwards vertically to the primary mirror of the telescope and focus at the focal points of the telescope.
5. Alignment of the Three Parallel Beams
In order to ensure the three beams are parallel to each other and transmit down vertically, we performed the alignment as follows. The optical table with the experiment setup is fixed at the top of a tower at the height of 4 meters. Figure 8 is the setup of the tower fixed on the big optical table in the laboratory. We first aligned the He-Ne laser beam and the angle of the 45o reflect mirror to make the three beams transmit downward vertically by the pinhole of the optical table. The three beam spots on the big optical table in the laboratory should distribute in one circle. Then we performed the fine alignment. At the bottom of the tower, we put reflect mirror at the beam spot on the big optical table in the laboratory, to reflect the laser beam and make the beam transmit reversely on the optical path. We can observe the beam spot in the incident path and the beam spot in the reflect path by using lens paper in the optical path. We then finely aligned the optical components, and tried to move the lens paper along the optical path, to make the incident beam spot overlap with the beam spot in the reflect path, as shown in the Figure 9. It means that the incident beam overlaps with the reflect beam completely; in other word, the laser beam transmit downward vertically; We aligned the other two laser beams in the same way. It ensures the three beams are parallel to each other and transmit downward vertically.
After the alignment, the three laser beams are parallel to each other and transmit downward vertically. In this
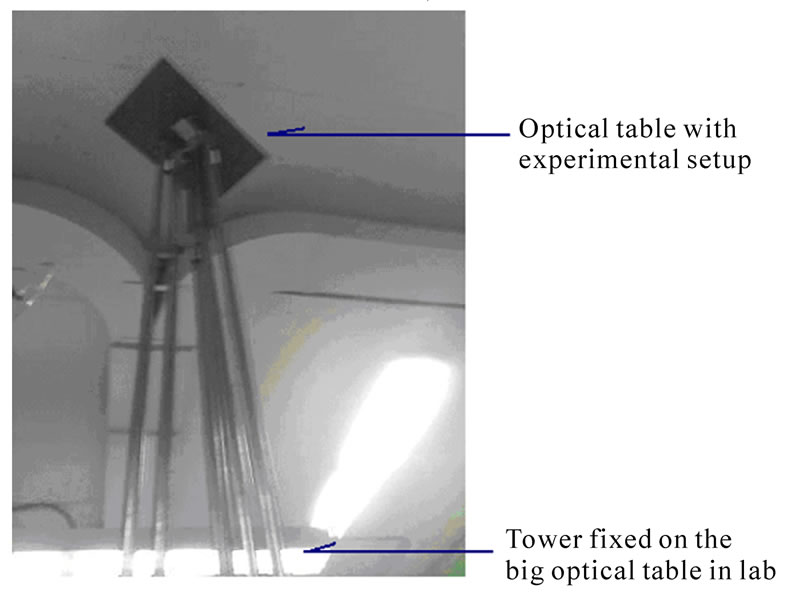
Figure 8. The tower for the three parallel beams alignment

Figure 9. Schematic diagram for parallel beams alignment
case, fix the optical table on the roof directly above the telescope 10m high to the center of the primary mirror. The cavity length of the He-Ne laser is: L = 30 cm, and the wavelength is . According to the divergence calculation equation [8]:
 , the divergence angle is calculated as
 . Thus, the diameter of the incident beam spot on the surface of primary mirror of the telescope is about 20 millimeters; the diameter of airy disk should be 0.0286 milimeter (if the focal length is 1.5 meter). Actually, according to the above analysis, the size of the focus is 3 millimeters, as shown in Figure 3, which is much larger than the size of the airy disk. The three laser beams transmit downward vertically, reflected by the primary mirror and secondary mirror of the telescope, and then focus at the focal spot of the telescope. The beam spot can be detected by using lens paper in the optical path, and distance between the three beam spots varies with the lens paper movement: the distance between the three beam spots becomes smaller while the lens paper moving toward the focus spot, eventually, the three beam spots exactly overlap at the focus spot. According to this experimental result (three beam spots overlap at the focus spot), we can locate the focus of backscatter light of a Lidar system.
6. Conclusions
According to this theoretic analysis, the uncertainty of focus location is close to zero when the backscatter light is from infinity; and the size of focus is relative to object distance and divergence of incident beam (corresponding to the field of view of telescope). The relationship between the size of focus and divergence of backscatter light can be quantificationally described as  which coincide with the analysis in reference [6]. Compared with the analysis result by ZEMAX software, this calculation is also quite reasonable. Therefore, we can exactly locate the focus and obtain the size of the focus of backscatter light of a Lidar system by combination of this calculation and experiment.
7. Discussion (Future Plan for Experiment Modification)
1) In the experiment of alignment of three parallel beams (shown in Figures 8 and 9), in order to make the reflect mirror on the big optical table in lab perfectly horizontal to the earth surface, we are going to use an oil cup instead of the reflect mirror to ensure the three beams exactly parallel and transmit down vertically.
2) According to the calculation in above paragraph, the divergence angle of He-Ne laser is about 2 mrad; to improve the beam quality of He-Ne laser, a beam expender should be housed in the optical path in front of He-Ne laser (shown in Figures 6 and 7) to reduce the divergence angle of He-Ne laser beam to increase the experimental accuracy.
8. Acknowledgements
Authors thank Prof. Barry Gross for great supports in this work.
REFERENCES
- N. W. Cao, R. L. Collins, and C. F. Cahill, “An eye-safe Lidar for studies of urban ice fog,” A Report Prepared under the Program, University Partnering for Operational Support (UPOS), Geophysical Institute, University of Alaska Fairbanks, January 2003.
- Y. Suematsu, S. Tsuneta, K. Ichimoto, T. Shimizu, M. Otsubo, Y. Katsukawa, M. Nakagiri, M. Noguchi, T. Tamura, Y. Kato, H. Hara, M. Kubo, I. Mikami, H. Saito, T. Matsushita, N. Kawaguchi, T. Nakaoji, K. Nagae, S. Shimada, N. Takeyama, and T. Yamamuro, “The solar optical telescope of solar-B (Hinode): The optical telescope assembly,” Solar Physics, No. 249, pp. 197–220, 2008.
- I. Matsui, N. Sugimoto, Y. Sasano, and H. Shimizu, “Wind profiling by a conical-scanning time-correction Lidar,” Japanese Journal of Applied Physics, Vol. 29, No. 2, pp. 441–444, February 1990.
- P. Kokkalis, G. Georgoussis, A. Papayannis, D. Hatzidimitriou, J. Porteneuve, R. E. Mamouri, and G. Tsaknakis, “Optimization-through optical design-of a multi-wavelength fiber-based Raman-Lidar system in the near field for vertical aerosol measurements in the troposphere,” Proceedings of the 8th International Symposium on Tropospheric Profiling, The Netherlands, October 2009.
- G. Andersen, J. K. Brasseur, R. J. Knize, and P. Haris, “Raman and Rayleigh holographic Lidar,” Applied Optics, Vol. 41, No. 9, pp. 1798–1804, 2002.
- G. Chourdakis, A. Papayannis, and J. Porteneuve, “Analysis of the receiver response for a noncoaxial Lidar system with fiber-optic output,” Applied Optics, Vol. 41, No. 15, pp. 2715–2723, 2002.
- http://www.answerbag.com/articles/how-to-view-the-moonwith-a-telescope/32b45360-b7f0-f3f8-5c5d-ccec6e59fba0
- K. X. Yu and T. L. Jiang, “Laser theory and technology,” Beijing Technology University Book Concern, pp. 195– 196.