Journal of Water Resource and Protection
Vol.4 No.5(2012), Article ID:19472,7 pages DOI:10.4236/jwarp.2012.45035
Agricultural Water Foot Print and Virtual Water Budget in Iran Related to the Consumption of Crop Products by Conserving Irrigation Efficiency
1Ferdowsi University of Mashhad, Mashhad, Iran
2Water Engineering Department, Azad University of Ferdows, Iran
3Regional Water Authority Company of Razavi Khorasan, Mashhad, Iran
4Water Engineering Department, Shiraz University, Shiraz, Iran
Email: *azamarabi@gmail.com
Received November 29, 2011; revised December 26, 2011; accepted January 27, 2012
Keywords: Water Footprint; Virtual Water Trade; Blue Water Resource; Water Budget
ABSTRACT
In this study we estimate agricultural water footprint and its components from consumption perspective in arid and semi-arid region like Iran. This study is based on blue water consumption in irrigated land. Iran has imported net virtual water about 11.64 billion cubic meters (bcm) as international crop trade in 2005-2006. Therefore, Iran has depended on virtual water imports. By conserving about 60% irrigation efficiency, the total water requirement to produce imported crops in Iran is nearly 20.78 billion cubic meters. It is nearly 9 percent of renewable water resources and 12.65% agricultural appropriated water which has added to internal water resources. Agricultural virtual water budget is about 112.78 Gm3/yr. Agricultural water footprint is 110.2 Gm3/yr. About 12.83% of agricultural water footprint of Iran is related to external water resources on the country boundaries. It means external water footprint. Water dependency, water self-sufficiency and water scarcity indexes in agricultural sector of Iran, are estimated 10.1%, 89.9% and 70.8%, respectively.
1. Introduction
Water is an essential factor for producing goods and services. By increasing population, water resources have become scarce to sufficient production of food. Since the largest share of water consumption is used for food production, the relation between food and water is closed. Per person consumes about 4 liter water in different form, whereas for producing daily food per capita it needs about 2000 liter water [1]. It has estimated that population of Iran will increase to 100 million people in 2030 and we will need about 150 billion cubic meter of water per year to supply food security based on 2600 K Calories energy per capita [2]. Hoekstra and Hung discussed that water should be considered as an economic good. So, they defined three different levels at which decisions can be made and improvements be achieved; local water use efficiency, water allocation efficiency and global water use efficiency [3] and [4]. In addition, Allan introduced “virtual water” in relation to water, food and their trades as the total volume of water used in the production process of commodity [5-7].
There are some studies about virtual water trade that show water is a key factor to produce water-intensive products and countries can save their water resources due to using virtual water trade. Consequently, they will allocate water in other sections by virtual water import. This view can reform some water consumption pattern in future. Falkenmark [8], Savenije [9], Ringersma [10] and Obuobie et al. [11] mentioned green, blue and gray water distinction. Yang et al. [12] comprised green and blue water features. In addition, in 2002, Water footprint concept was introduced in order to have a consumption based indicator of water use that could provide useful information instead of the traditional production-sectorbased indicators of water use [3]. The water footprint of a country is the volume of water needed for the production of the goods and services consumed by the inhabitants of the country. The water footprint of a nation is related to consumption pattern of nation [3] and [4]. Water footprint presents a wider perspective on how a consumer or producer relates to the use of water resources [13]. Hoekstra and Chapagain [14] defined water footprint components, internal water foot print and external water foot print. Van oel et al. [15] and Hoekstra et al. [16] classified water footprint to green, blue and gray.
In this research, we estimate Water footprint index on agricultural sector of Iran from the user perspective in 2006-2007 based on international virtual water flows related to crop product trades. Therefore, we subtract the virtual water export and add the virtual water import to total national water withdrawal to assess water footprint of Iran. In this study, we conserve irrigation efficiency related to international crop trade from consumption perspective. In Iran an agricultural sector annually uses over 93 percent of total renewable water resources (Table 1). The agricultural sector contributes about 27% to the Gross National product (GNP), 23% to employment and more than 80 % to food security of country.
Iran, with an area of 165 million hectares (Mha), is located in semi-arid region of the Middle East. Distribution of precipitation is uneven. The average amount of precipitation over the country is 252 mm/year, which is less than one-third of the world average [2]. Table 1 shows water allocation and use in different categories in Iran.
2. Methods
In this study, virtual water of 31 important agricultural products (m3/ton) is estimated based on crop water requirements and yields according to Hoekstra and Hung [3] These products are categorized in different groups such as cereals, fruits, industrial crops, oil seeds, summer crops, selected fodder crops. The selected crops which have more share in international trade. We have divided the whole irrigated area to 629 agricultural plains that have specific crop pattern (Figure 1). The computations of net water requirement per crop have been done based on the FAO Penman-Monteith equation in non standard condition. In addition, crop coefficient variation as a function of the plant growth stage was calculated [17]. We have considered typical irrigation methods and irrigation efficiency to calculate irrigation need per each crop. For water footprint calculation, the methodology described Hoekstra and Hung [3] and Van Oel et al. [15] have been used. In this approach, to assess water footprint (Top-Down method), we subtract virtual water export and add virtual water import to total national water withdrawal. National water scarcity, water dependency on foreign water resources and sustainability of national consumption (water self-sufficiency) index had calculated to explain relation between water scarcity and virtual water import of country according to Hoekstra and Hung [3].
The object of this study has been only focused on the consumption of agricultural products. Since based on Power ministry report, agricultural water allocation is about 94.25% of water resources (Table 1). The focus of this study will be on irrigated crops that is mentioned blue water use. In Iran more than 90% of agricultural
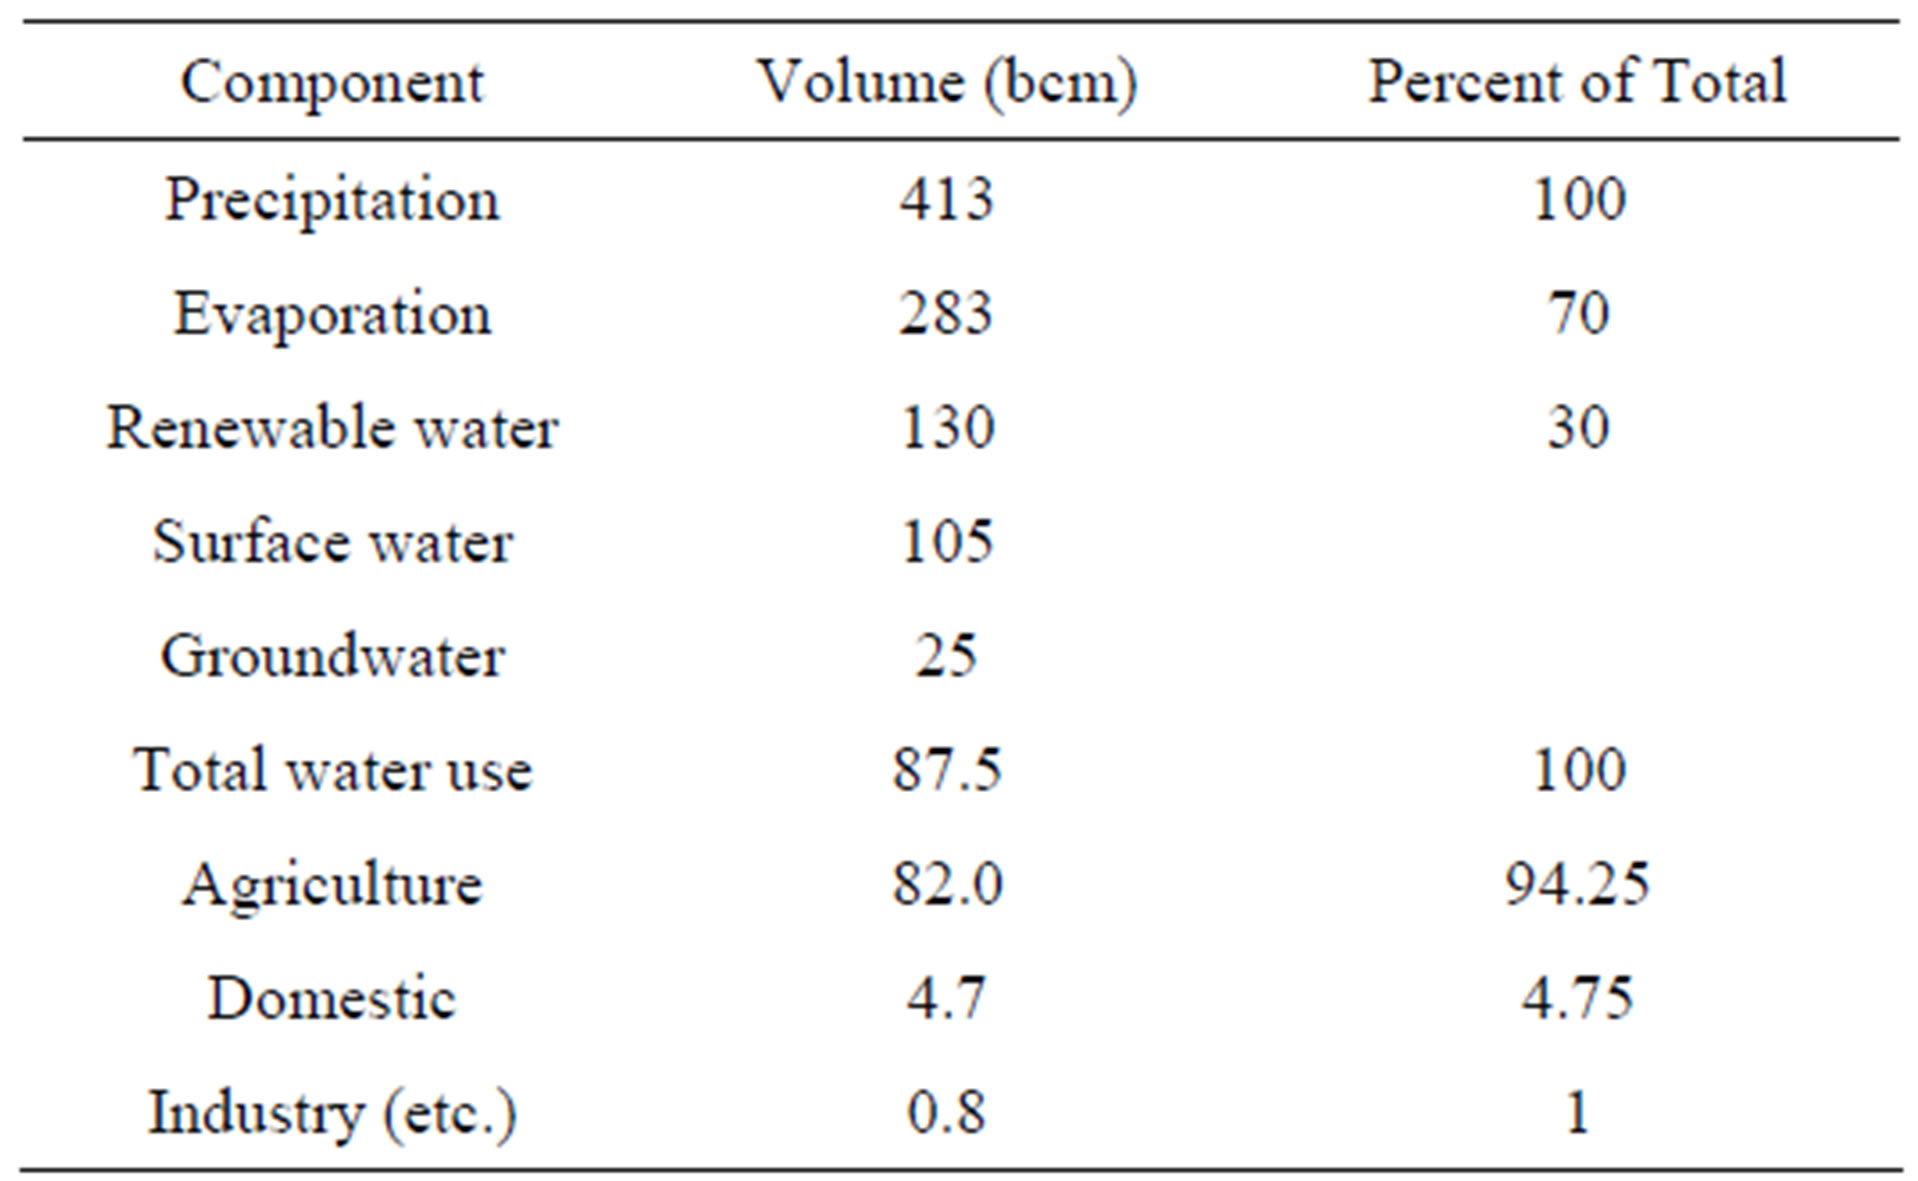
Table 1. Water availability and use in Iran, [2].
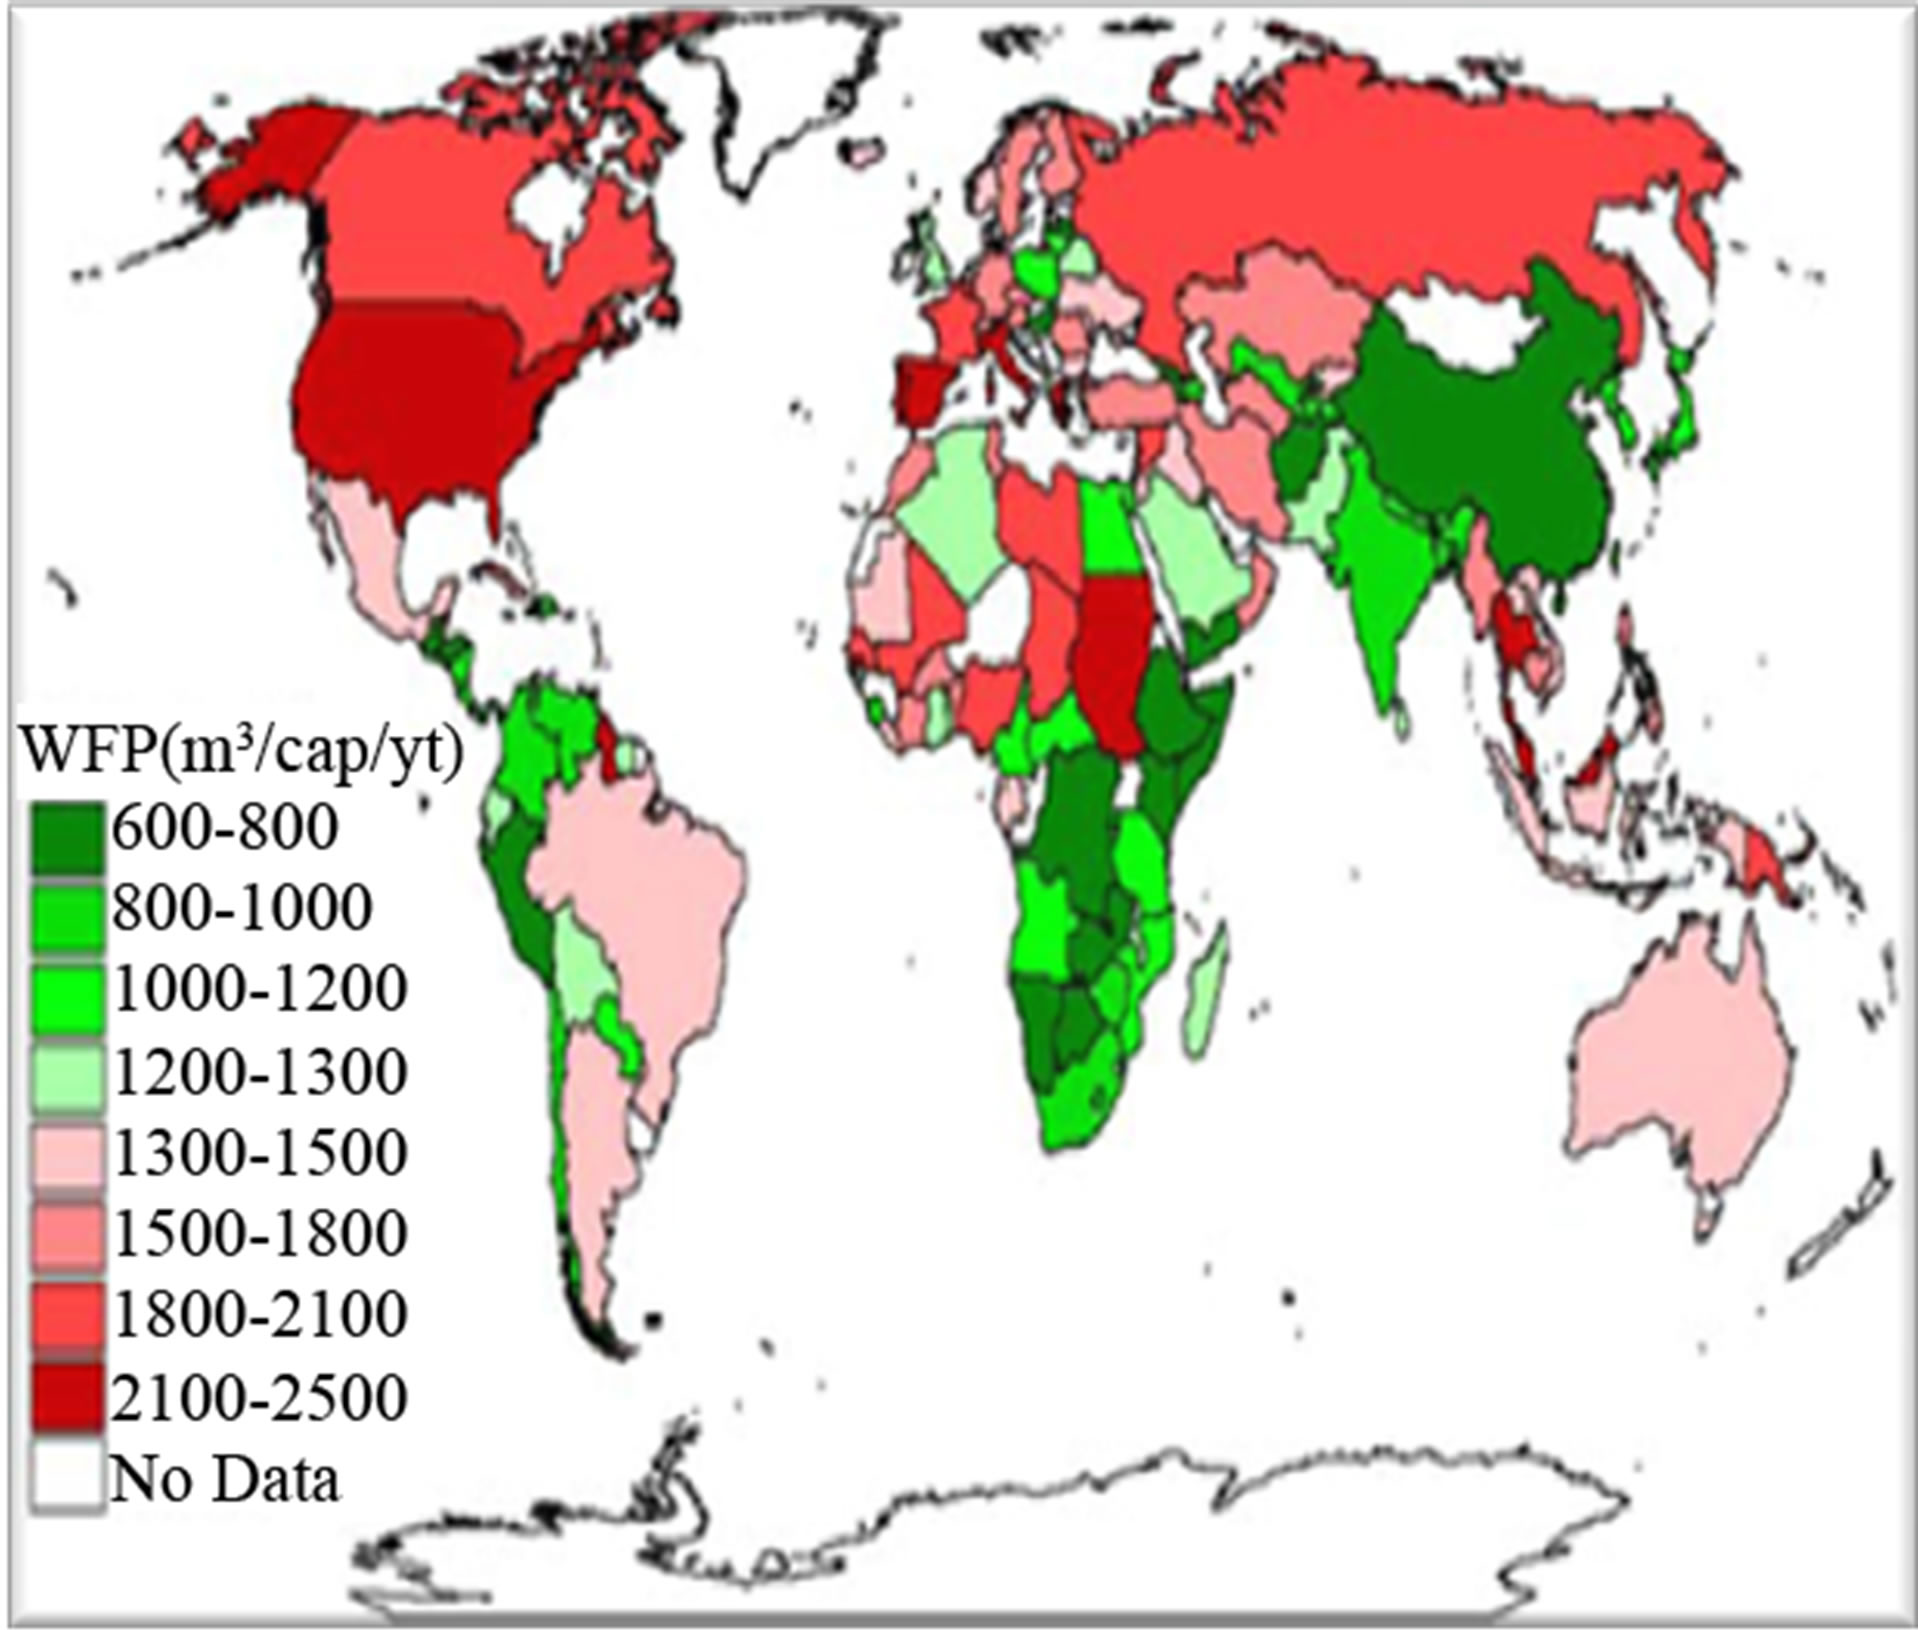
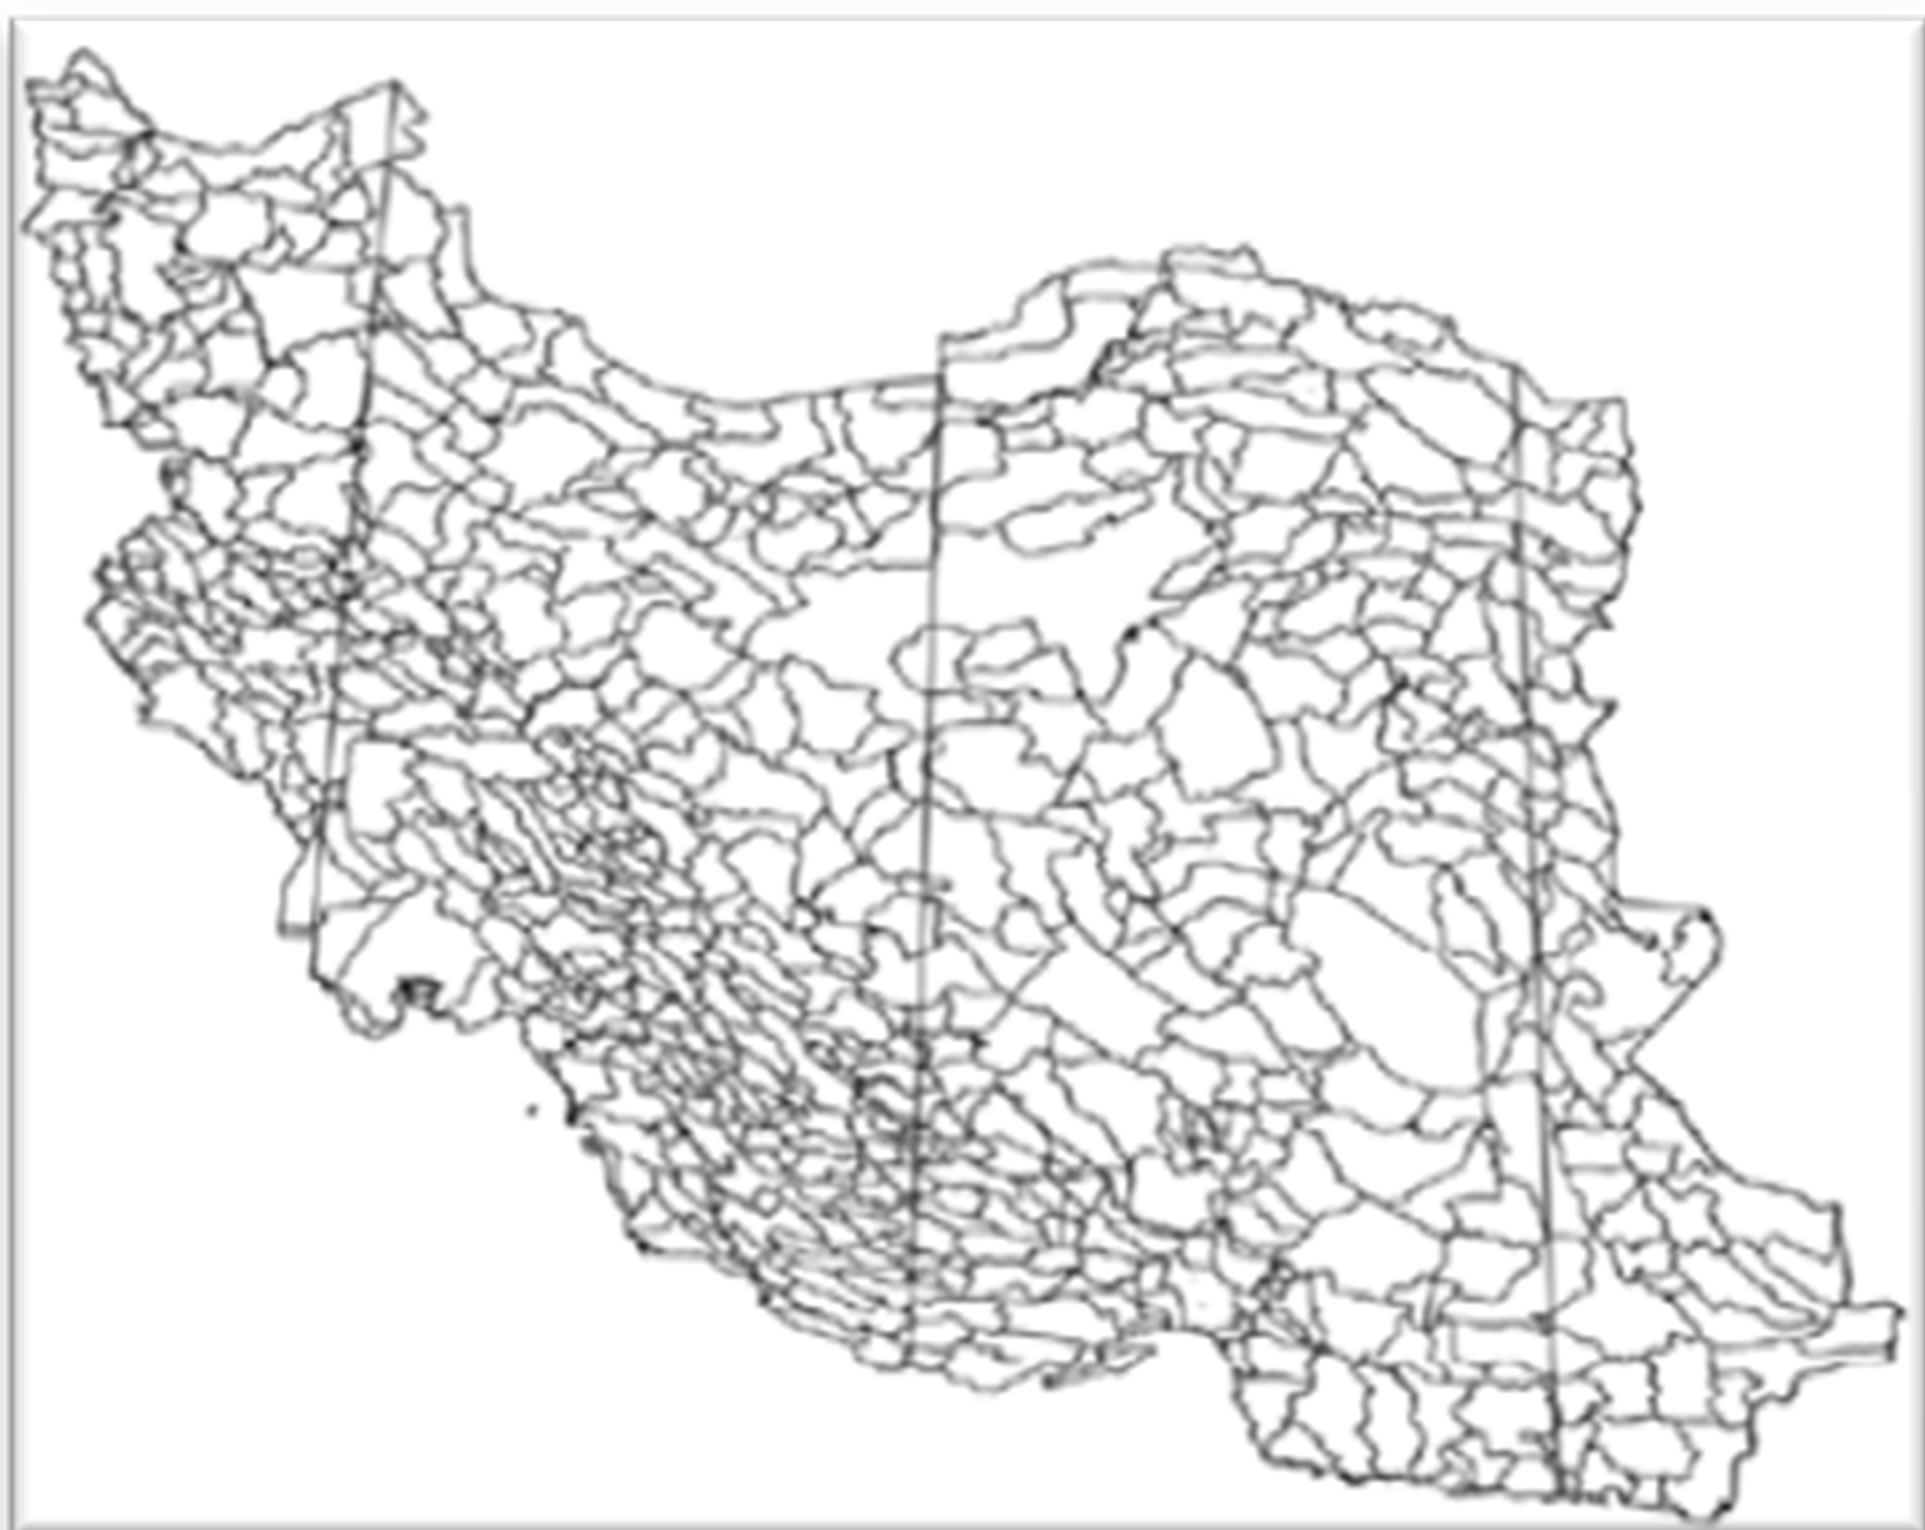
Figure 1. Agricultural plain distribution in Iran (source: Hoekstra and Chapagain, 2007; Agricultural ministry of Iran).
products have harvested from irrigated land due to climate condition. The blue water use is equal to the irrigation water requirement multiplied by the fraction of the total area of a crop that is irrigated [18]. Water saving due to agricultural virtual water trade by considering irrigation efficiency has estimated in 2006-2007.
Some information about crop pattern, crop productiveity, water resources and soil properties in each region of the country is derived from Power and Agricultural ministry [19]. Climatic data have been taken from Organization weather of Iran [20]. Climatic database have classified daily for 30-year period. In 2005 to 2006, total irrigated land was over 8.425 million hectares. Figure 2 shows the proportion of major agricultural crops and garden products (fruits) from irrigated land area. Also total raw and dry agricultural products were about 77,411 million tons (statistics of agricultural ministry, 2006). Cereals such as wheat (10 million tons), barely (2 million tons), rice (2.5 million tons) were the great product category.
2.1. Calculation of International Virtual Water Trade
Virtual water content of product import is the amount of water that would have been required to produce the product at the place where the product is needed. This definition is particularly relevant how much water Iran needs to supply its agricultural water needs for food security. International crop trade statistics has derived from FAO [21]. The net virtual water import of a country is equal to the gross virtual water import minus the gross virtual water export as described [3]. This study is based on blue water resources (ground and surface water [10,11] as total volume of water resources consumed in agricultural sector in Iran [22,23].
2.2. Calculation of Agricultural Water Footprint
Calculating the water footprint of a nation requires quantifying the flows of virtual water leaving and entering the country. The sum of domestic water use and net virtual water import can be seen as a kind of “water footprint” of a country, [3,15]. The difference of import and export virtual water is the net virtual water content of a country. We have calculated weight average of irrigation efficiency in 629 agricultural plains. So, the real saving water due to the net virtual water import has predicted.
3. Results
Figure 3 shows virtual water content of different crops in Iran in 2005-2006. Virtual water content of each crop has been affected from water requirement and water productivity which are variable in each place. In Iran, some crops such as pistachio, almond, walnut and sunflower have high virtual water. In addition, agricultural water productivity is variable between 0.132 to 8.852 kg·m–3 in different crops without considering irrigation efficiency. In this way we need nearly 40 bcm to produce about 62 million tons of agricultural products. While, by considering irrigation efficiency about 60 %, water productivity average has decreased to 0.67 kg·m–3 at irrigated land. Water productivity for each crop varies due to agricultural practices and water management in each region.
Figure 4 represents the average of virtual water content
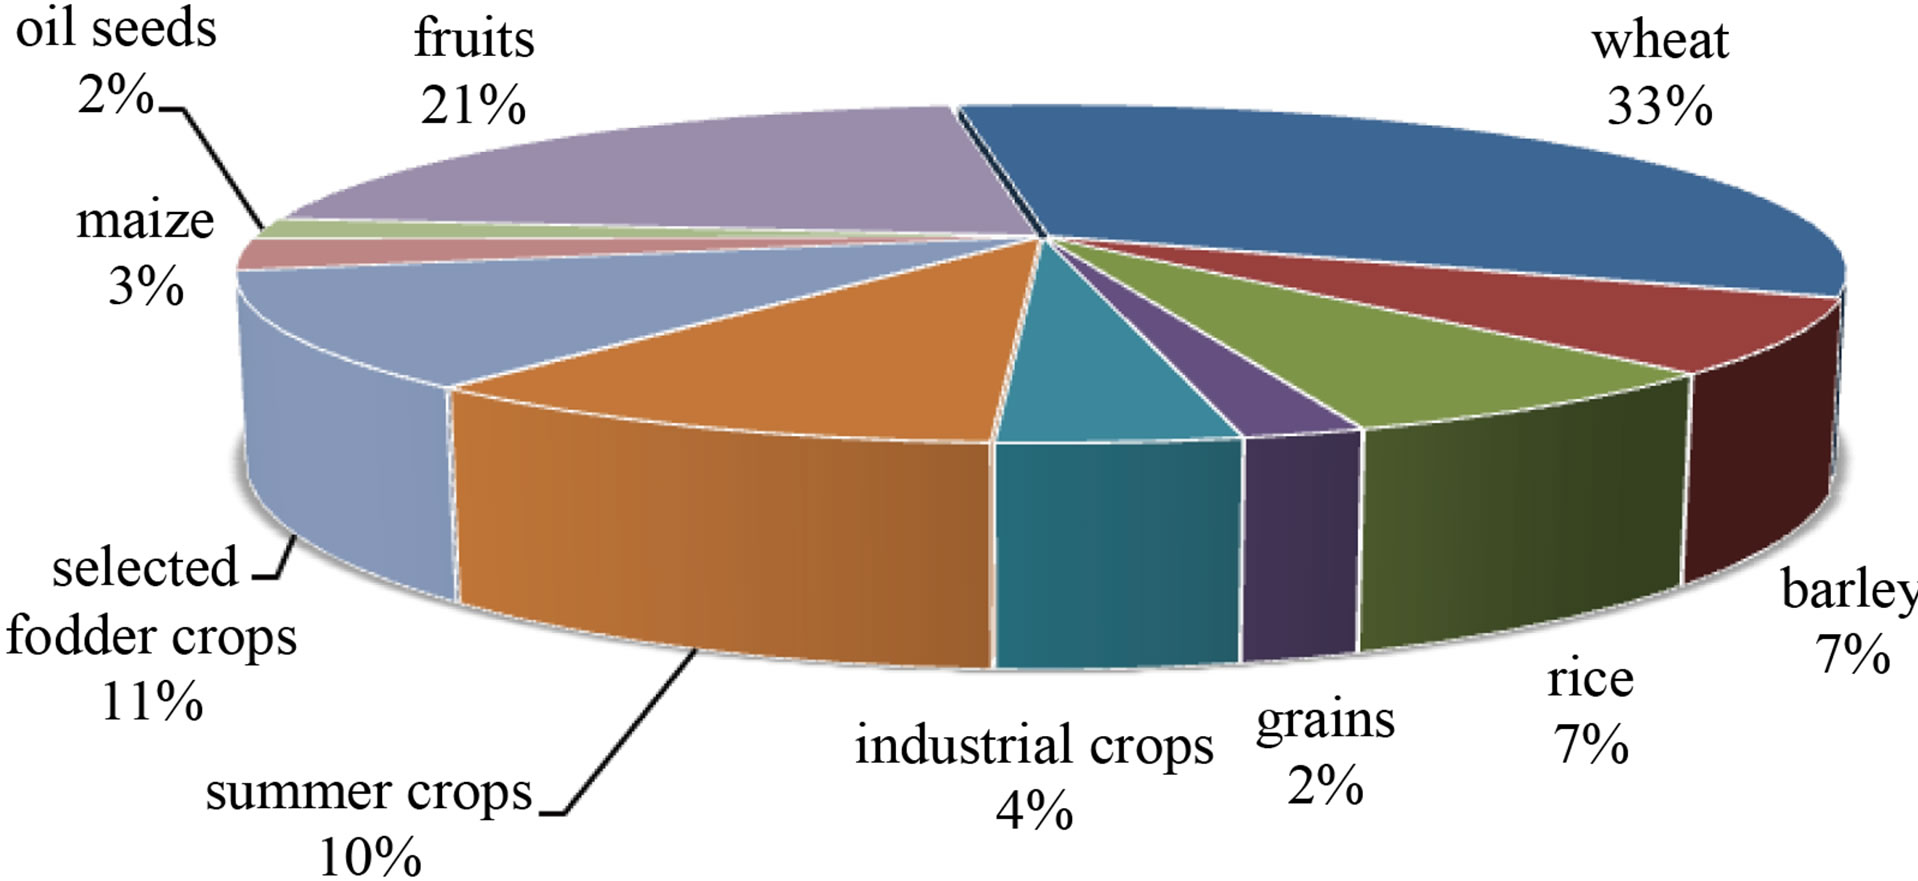
Figure 2. The share of major agricultural crops from irrigated land area in 2005-2006.
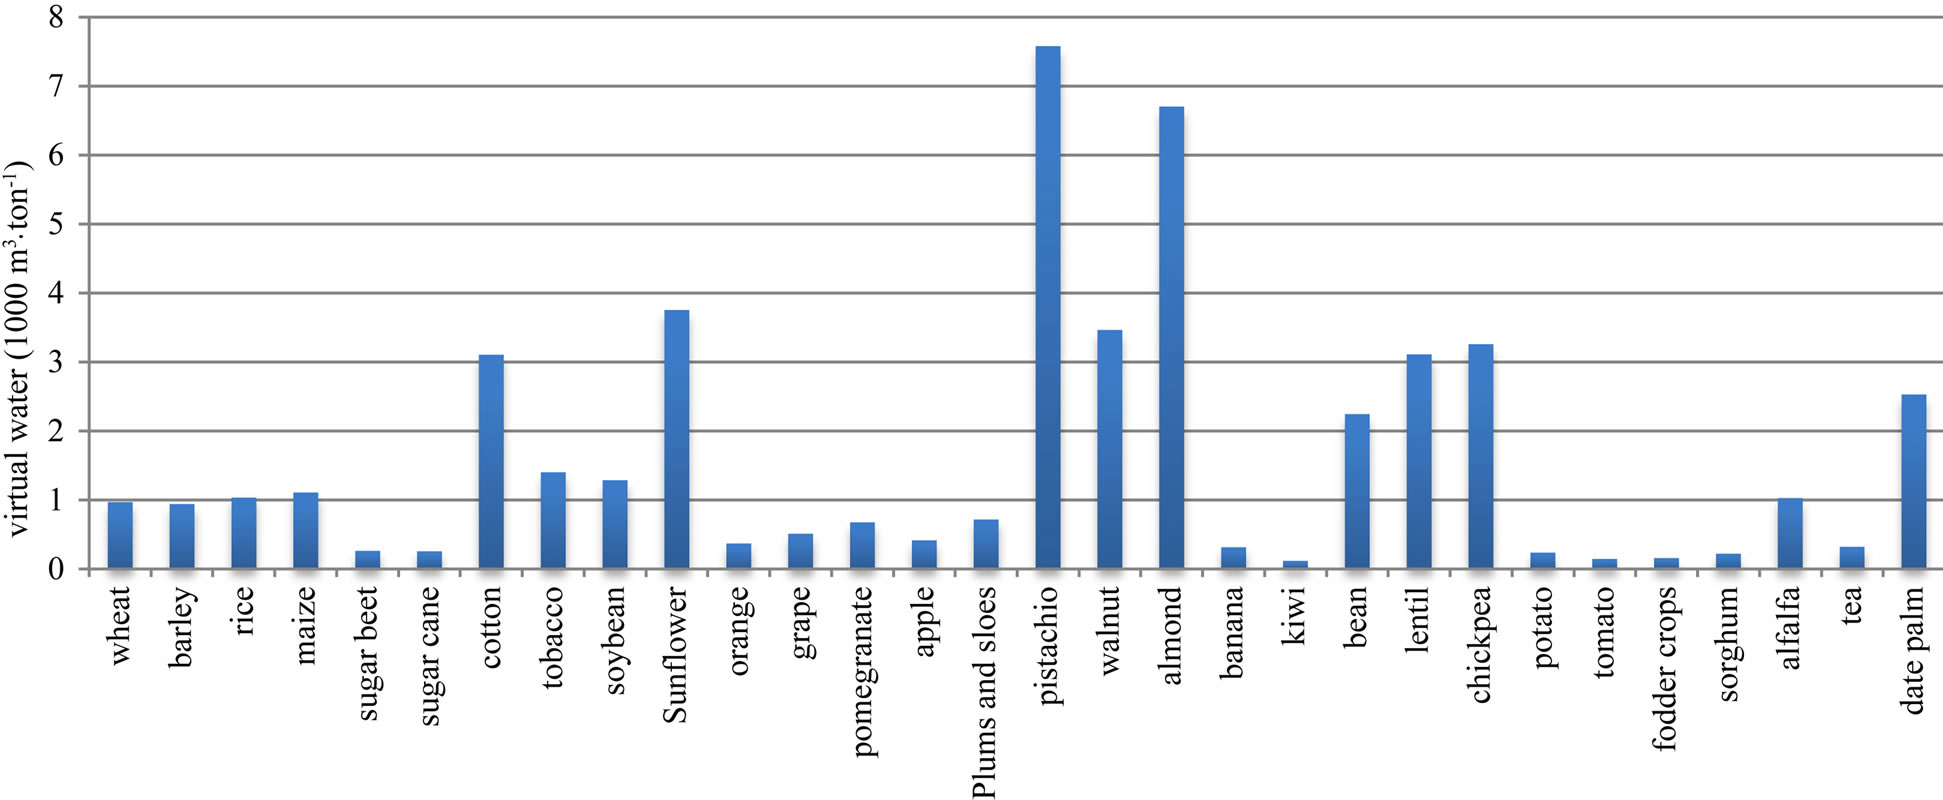
Figure 3. The average of virtual water content of agricultural crops in Iran (2006).
(m3·ton–1) in separated categories of agricultural products in 2005-2006. Date palm, grains, cotton and oil seeds have virtual water content more than the virtual water standard limit as 1000 (m3·ton–1). So, they are included water-intensive products. Virtual water content of each type of crop depends on crop water requirements, climate conditions, crop productivity and irrigation efficiency. For instant, Wheat has variable virtual water content in some provinces. Figure 5 illustrates virtual water content of wheat in different provinces of Iran in 2005-2006. Due to arid and semi-arid climate, it is found that northeastern and eastern provinces need more water to produce agricultural crops. It is noticeable that in Northern provinces like Gilan over than 94 percent of wheat production consumes green water resources, Consequently, blue water resources has consumed for crop production. In addition, in western provinces virtual water content of wheat is as weight average of virtual water in Iran (638 m3·ton–1). Since difference between virtual water content is related to climate condition, in this region, effective rainfall reduce irrigation water requirement. Rainfall amount in western provinces is variable between 300 to 900 mm per year, while it is about 225 mm per year in eastern provinces. So we can say virtual water content is affected on effective rainfall. Table 2 presents the blue water footprint proportion of wheat production in each province in 2005-2006. The greatest share of blue water footprint is related to Fars, Great Khorasan and Khuzestan which is about 21.8, 17.6 and 11.4 percent. The total blue water footprint of wheat production is 9135 m3/year that is about 10 percent of total blue water footprint per year.
Agricultural product import and export content are presented in Figure 6. The greater import product volumes are related in oil seeds (soybean), industrial crops (sugar)
and cereals [21]. Iran has imported about 7.80 × 10⁸ tons soybeans and 7.5 × 10⁸ raw soybean oil, so we transferred secondary products to primary products to calculate the volume of import and export products. The largest share of production export is related to fruits, especially pistachio and apple. On the other hand, Figures 7 and 8 show the virtual water trade related to agricultural crop trade in import and export groups respectively. The production trade causes virtual water flow which import/export water in virtual form to/from nation. It is found the largest volume of products which are shared in import and export in 2006-2007.
Figure 9 presents net virtual water content in relation
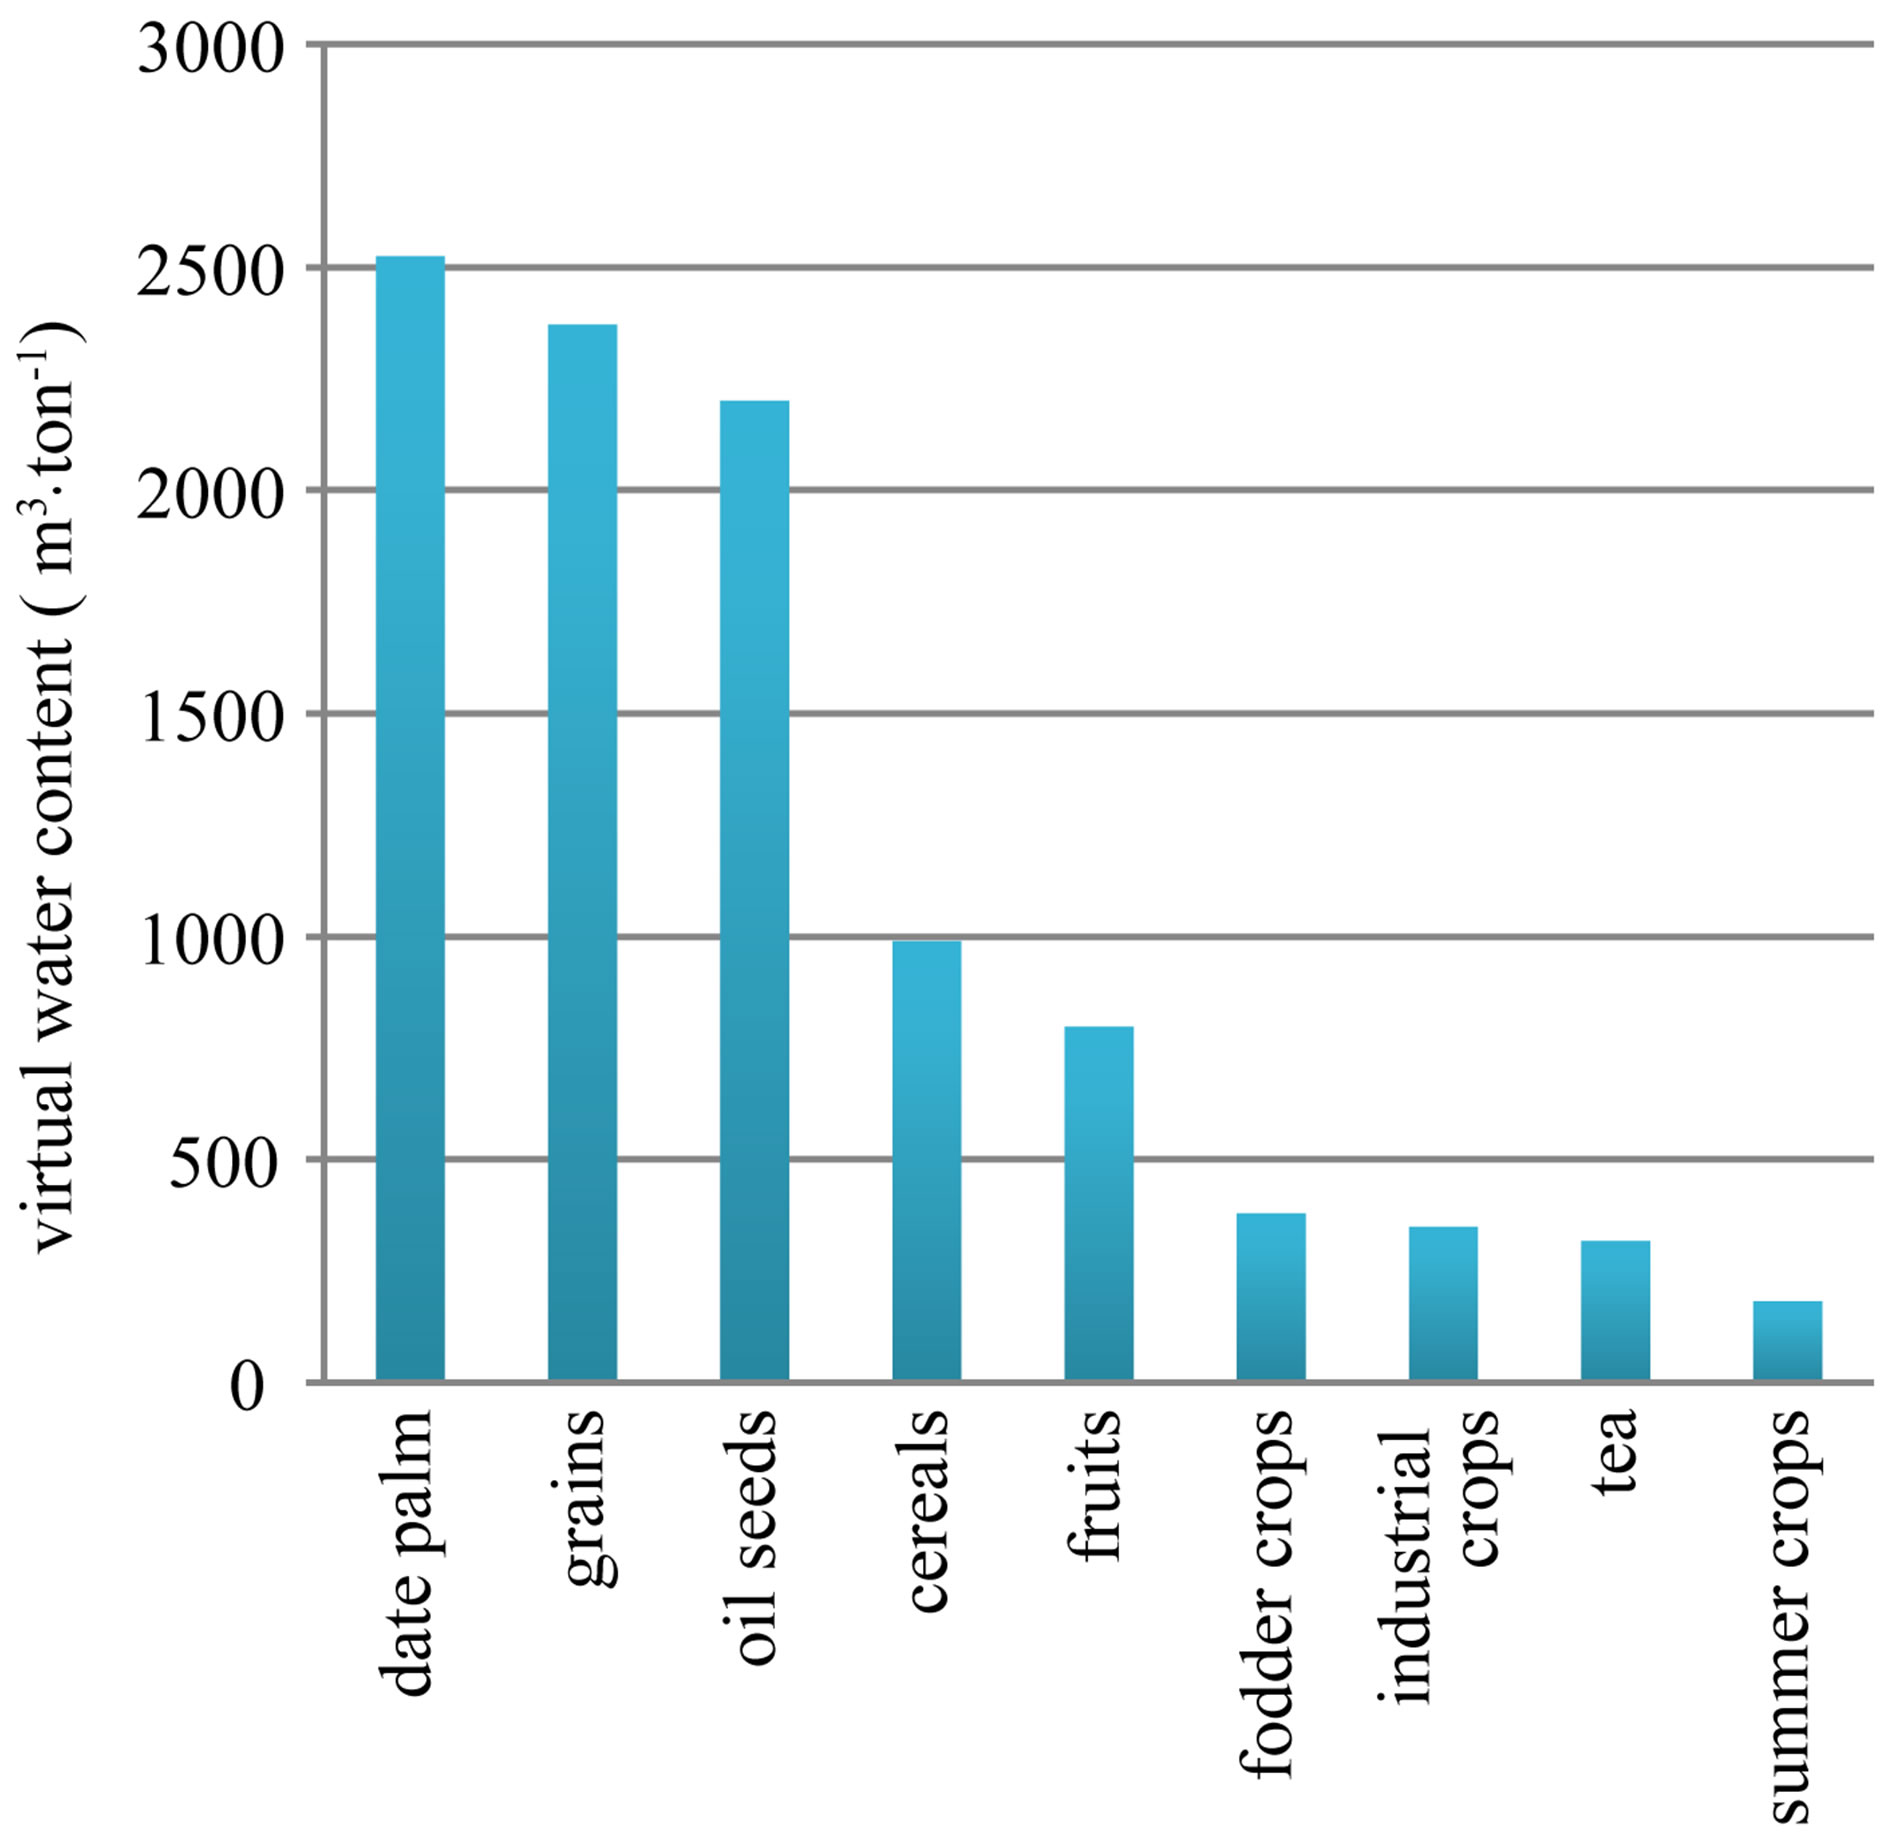
Figure 4. The average of virtual water content (m3·ton–1) in different groups of agricultural products in 2005-2006.
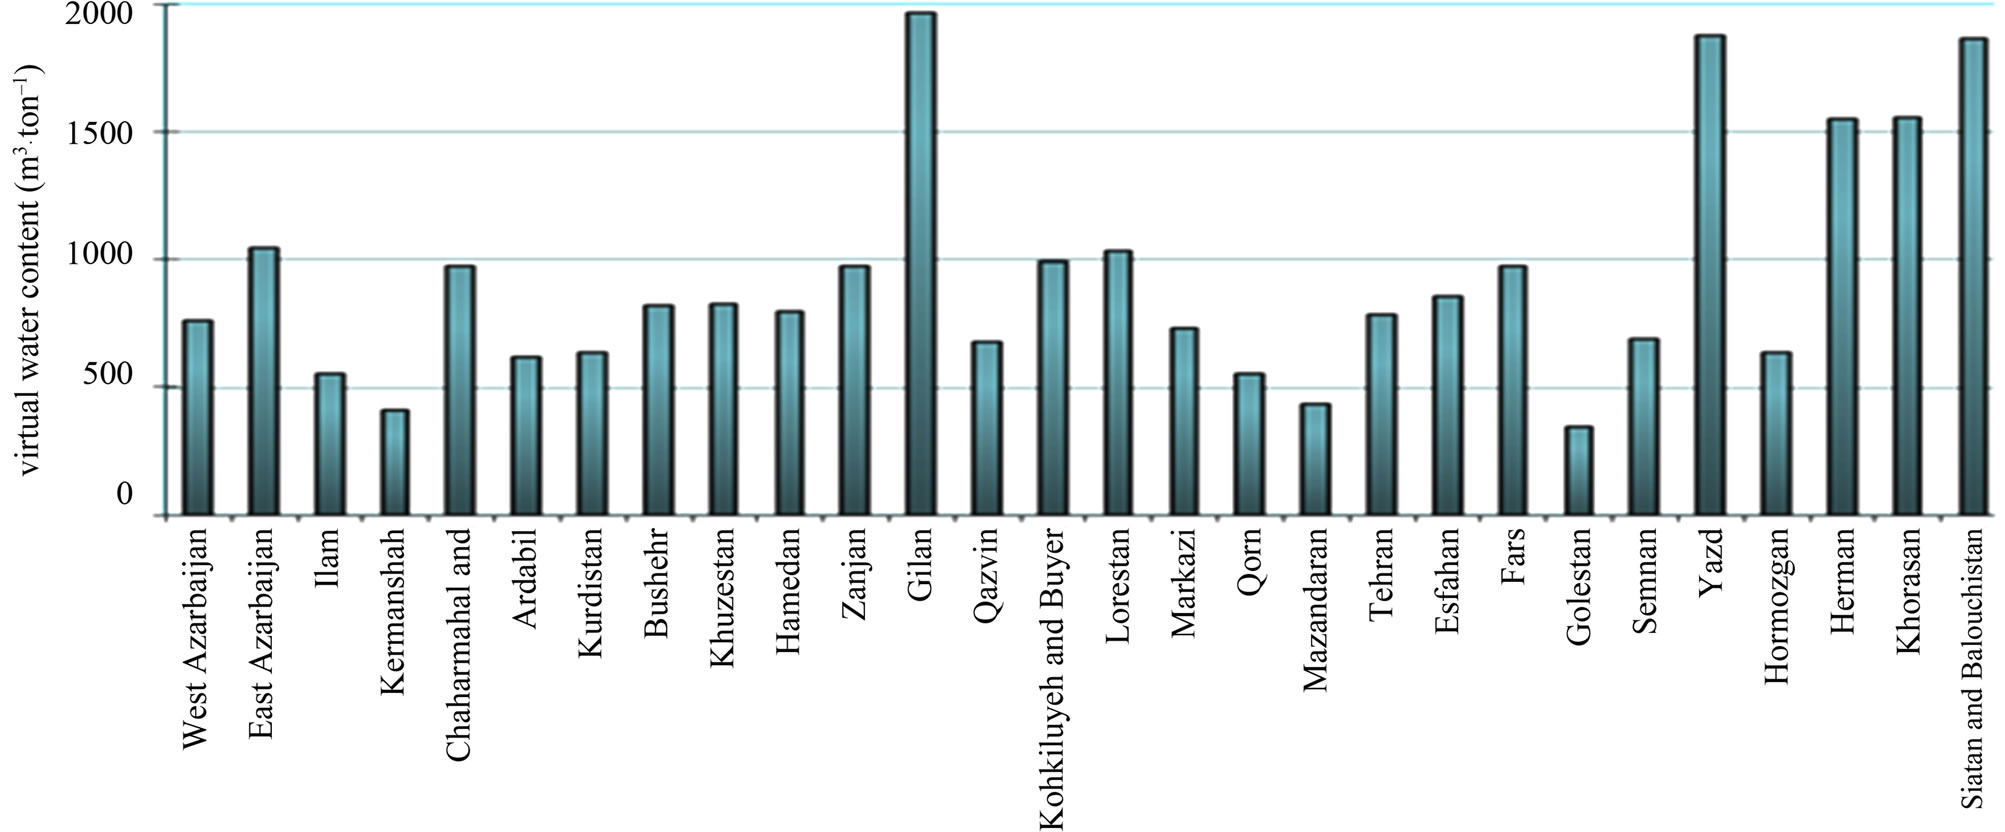
Figure 5. Virtual water content of wheat in different provinces of Iran in 2006.
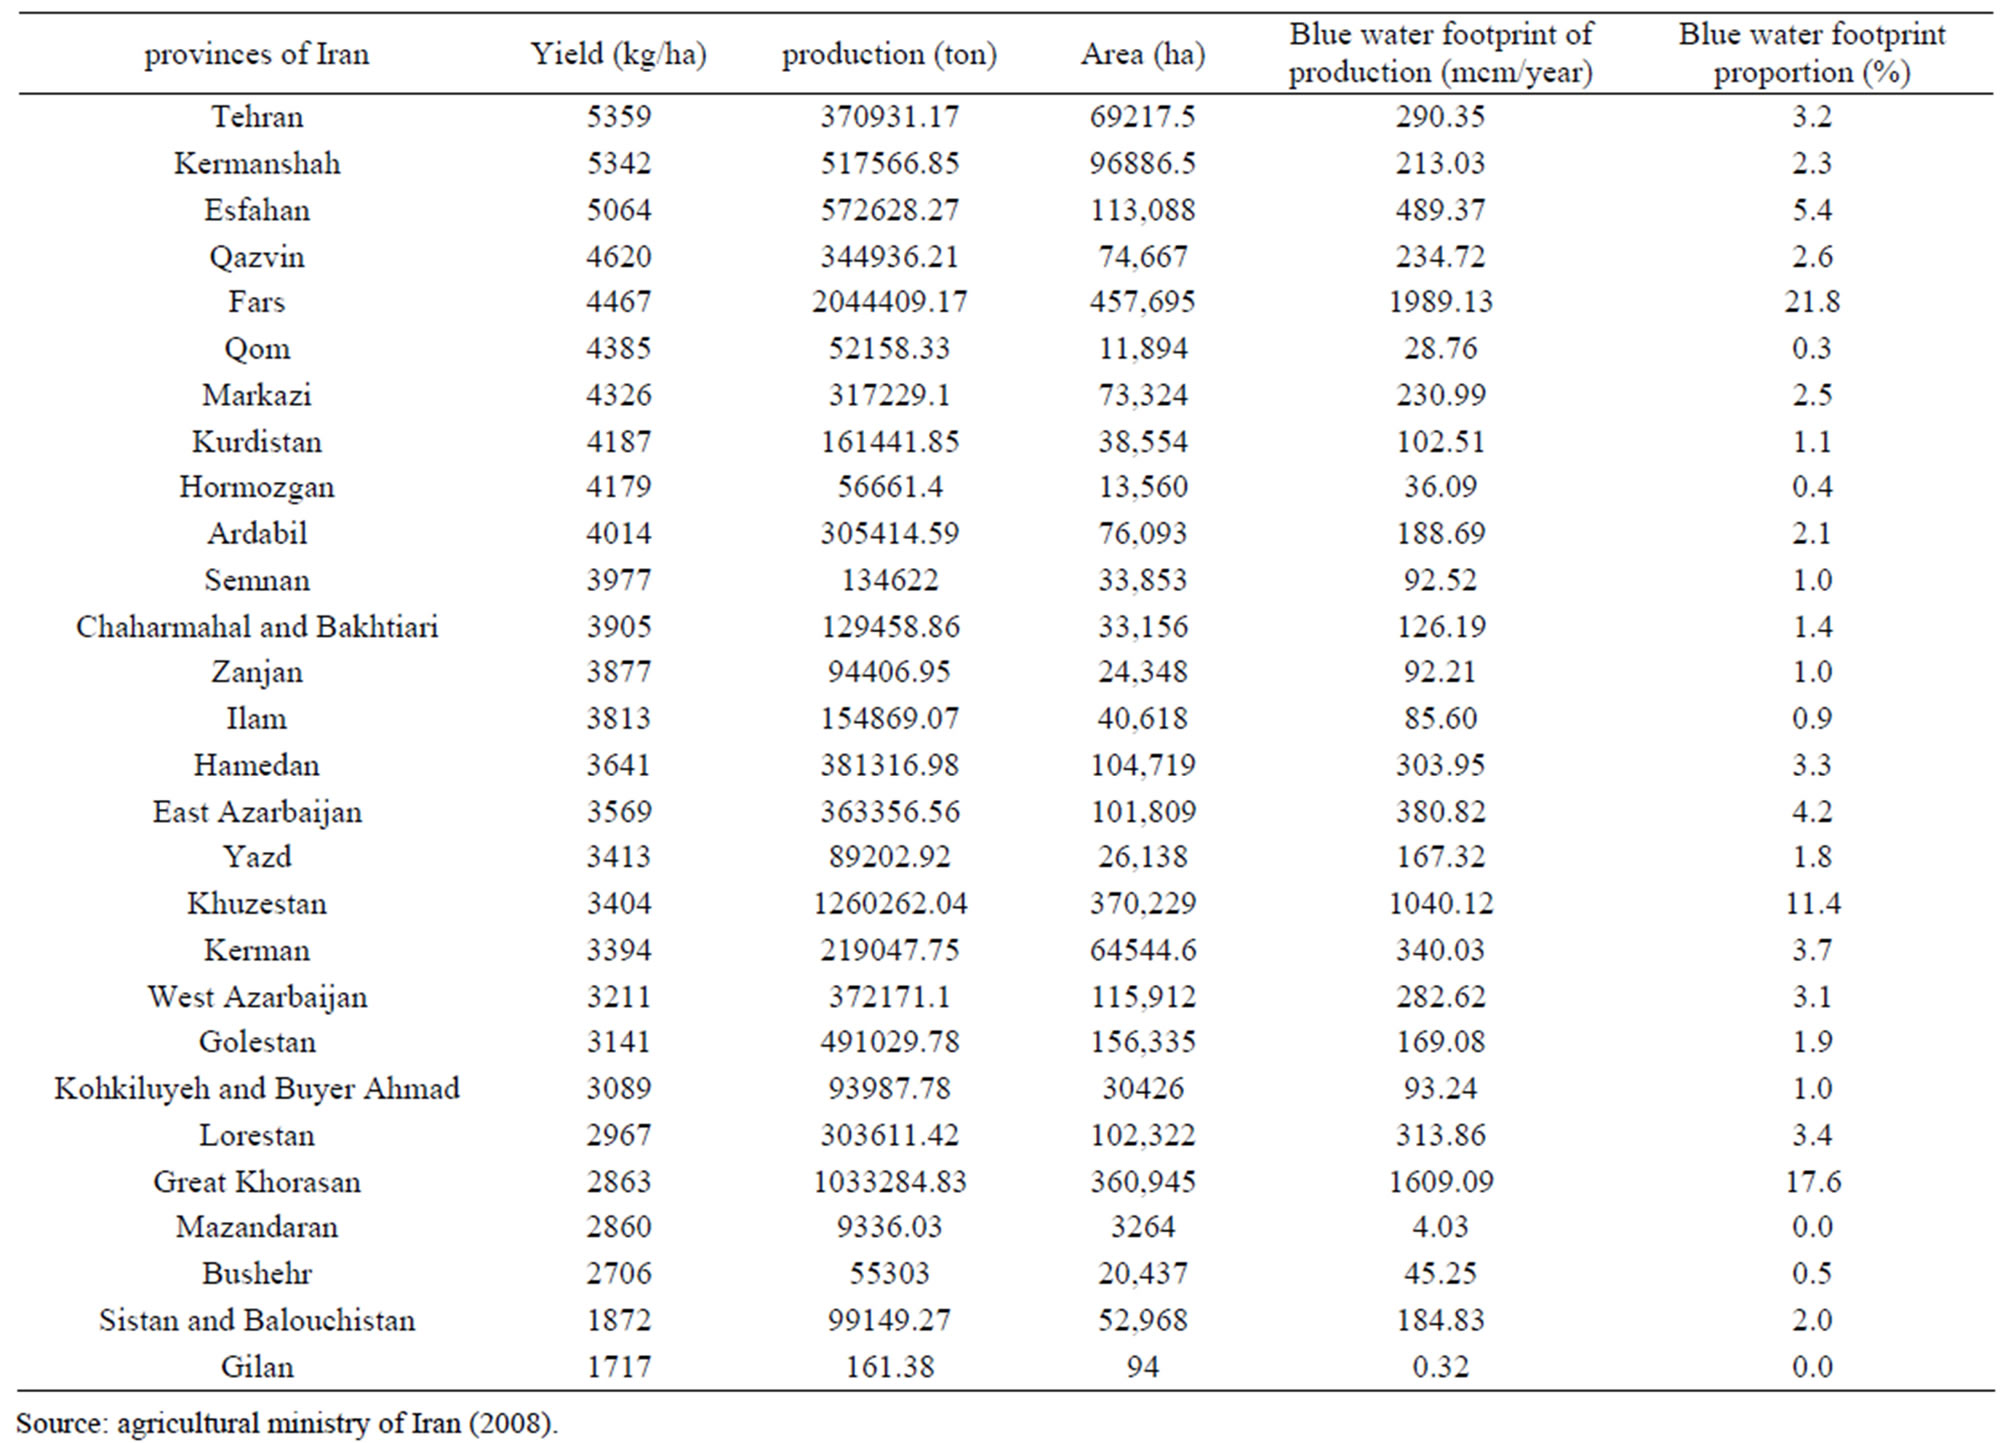
Table 2. Proportion of provinces in blue water footprint of wheat production in Iran (2006-2007).
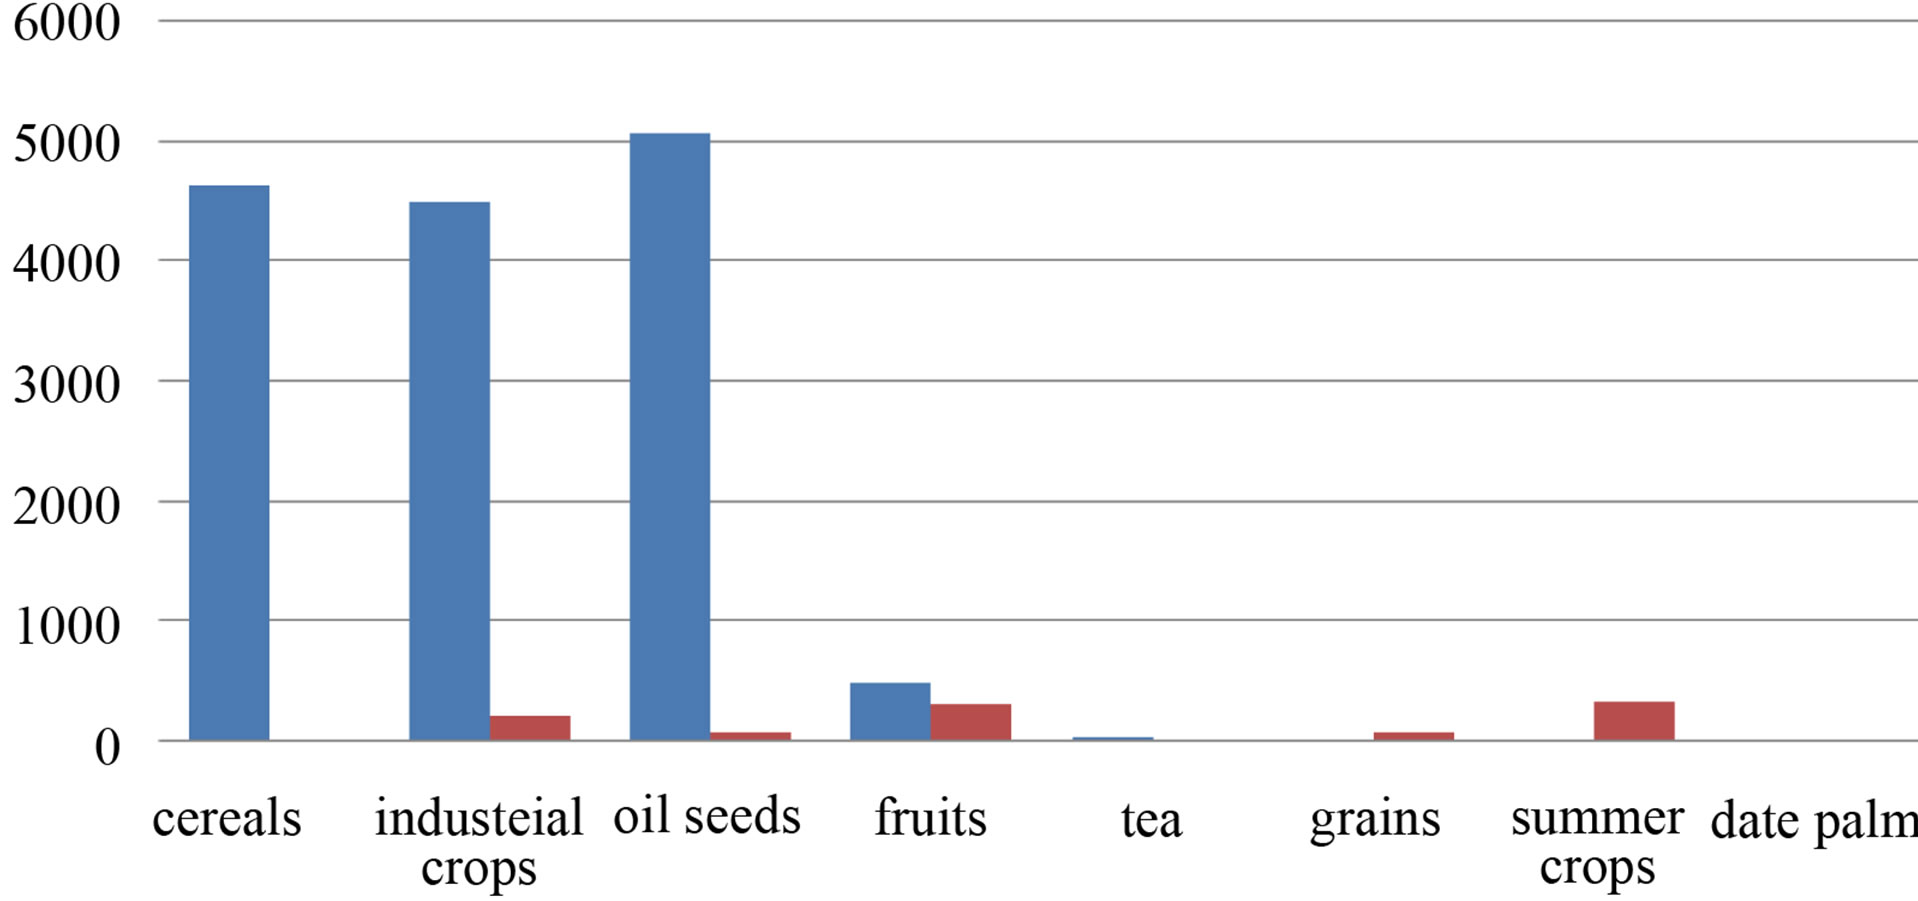
Figure 6. The import and export of agricultural products of Iran in 2006 [21].
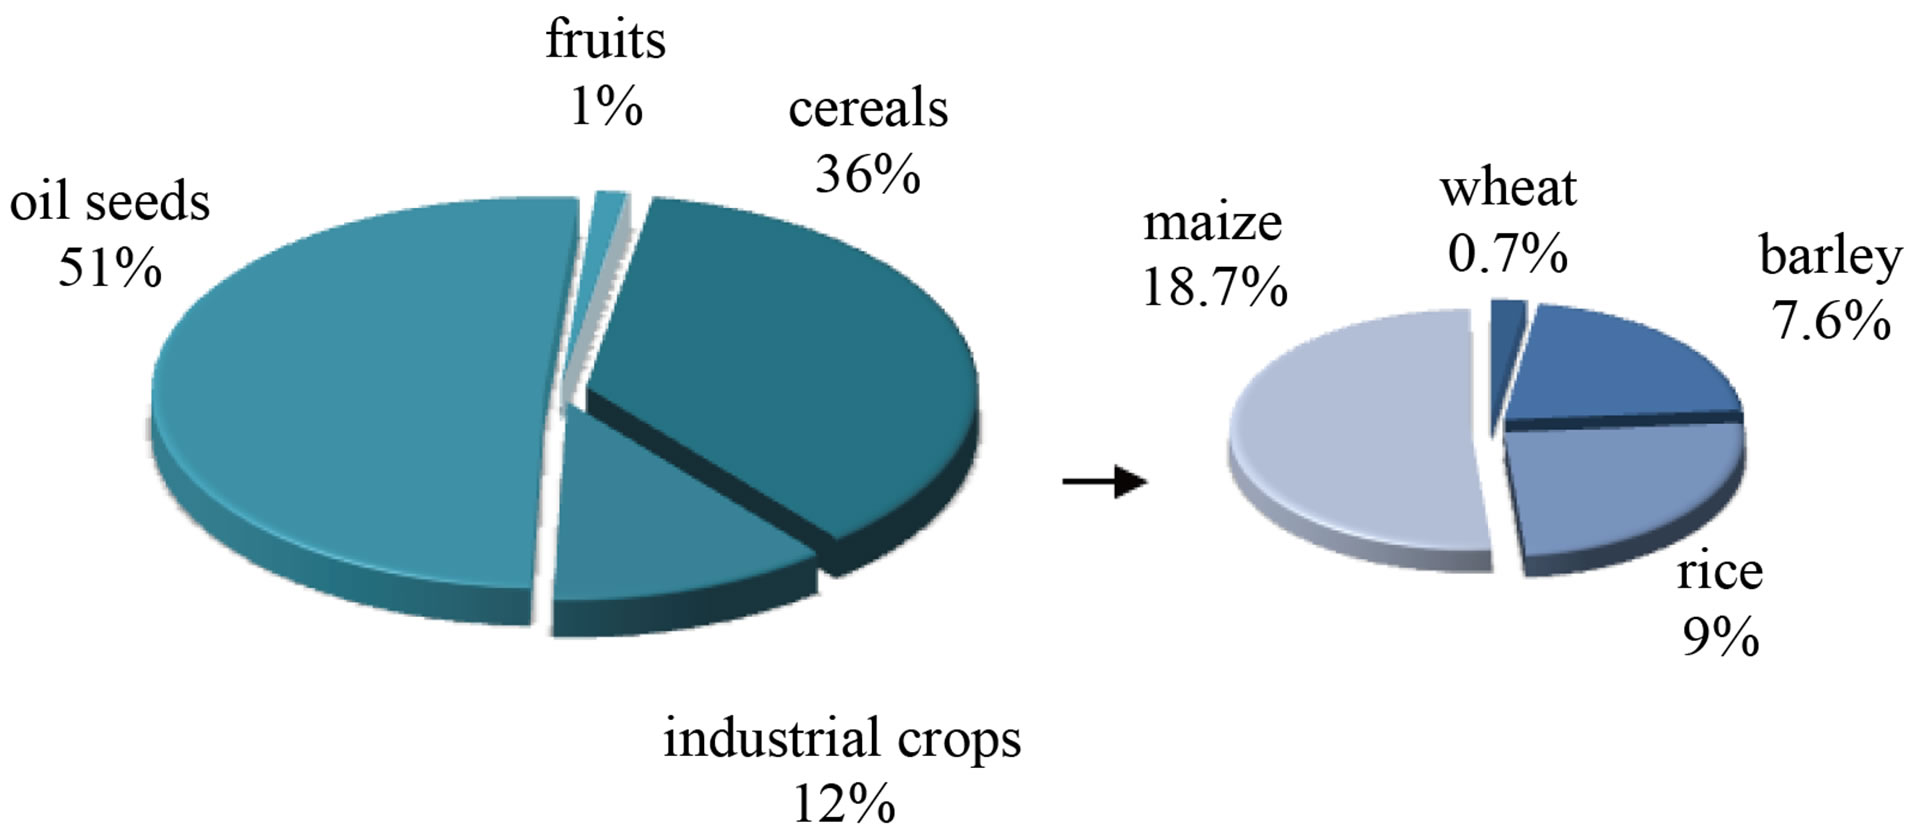
Figure 7. The largest categories proportion included in virtual water import in 2006-2007.
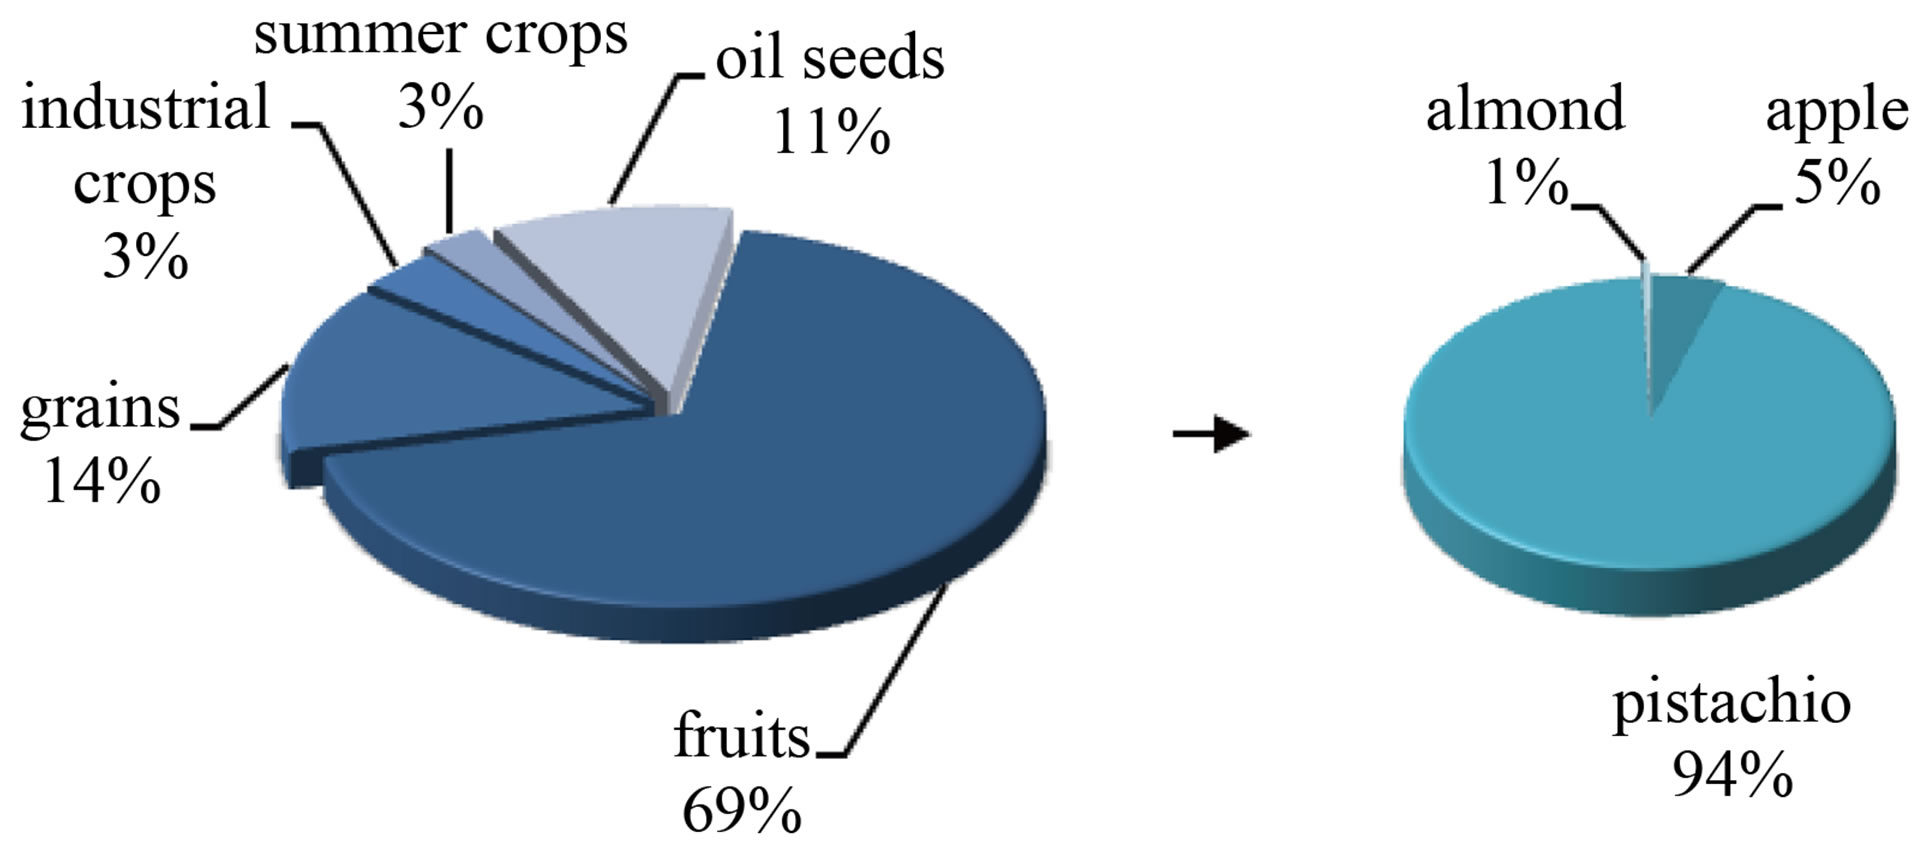
Figure 8. The share of the largest categories included in virtual water export in 2006-2007.
to import and export products. The positive amounts mean that these groups are more import than export virtual water and the negative amounts mean that these groups are more export than import virtual water. This graph shows Iran imported net virtual water about 13.3 bcm due to importing agricultural products and exported 1.6 bcm water in virtual form. The net virtual water of Iran in 2006 was about 11.64 billion cubic meters (bcm). Soybean and pistachio trade were the most important factor to import and export virtual water respectively.
Figure 10 shows the share of different categories of
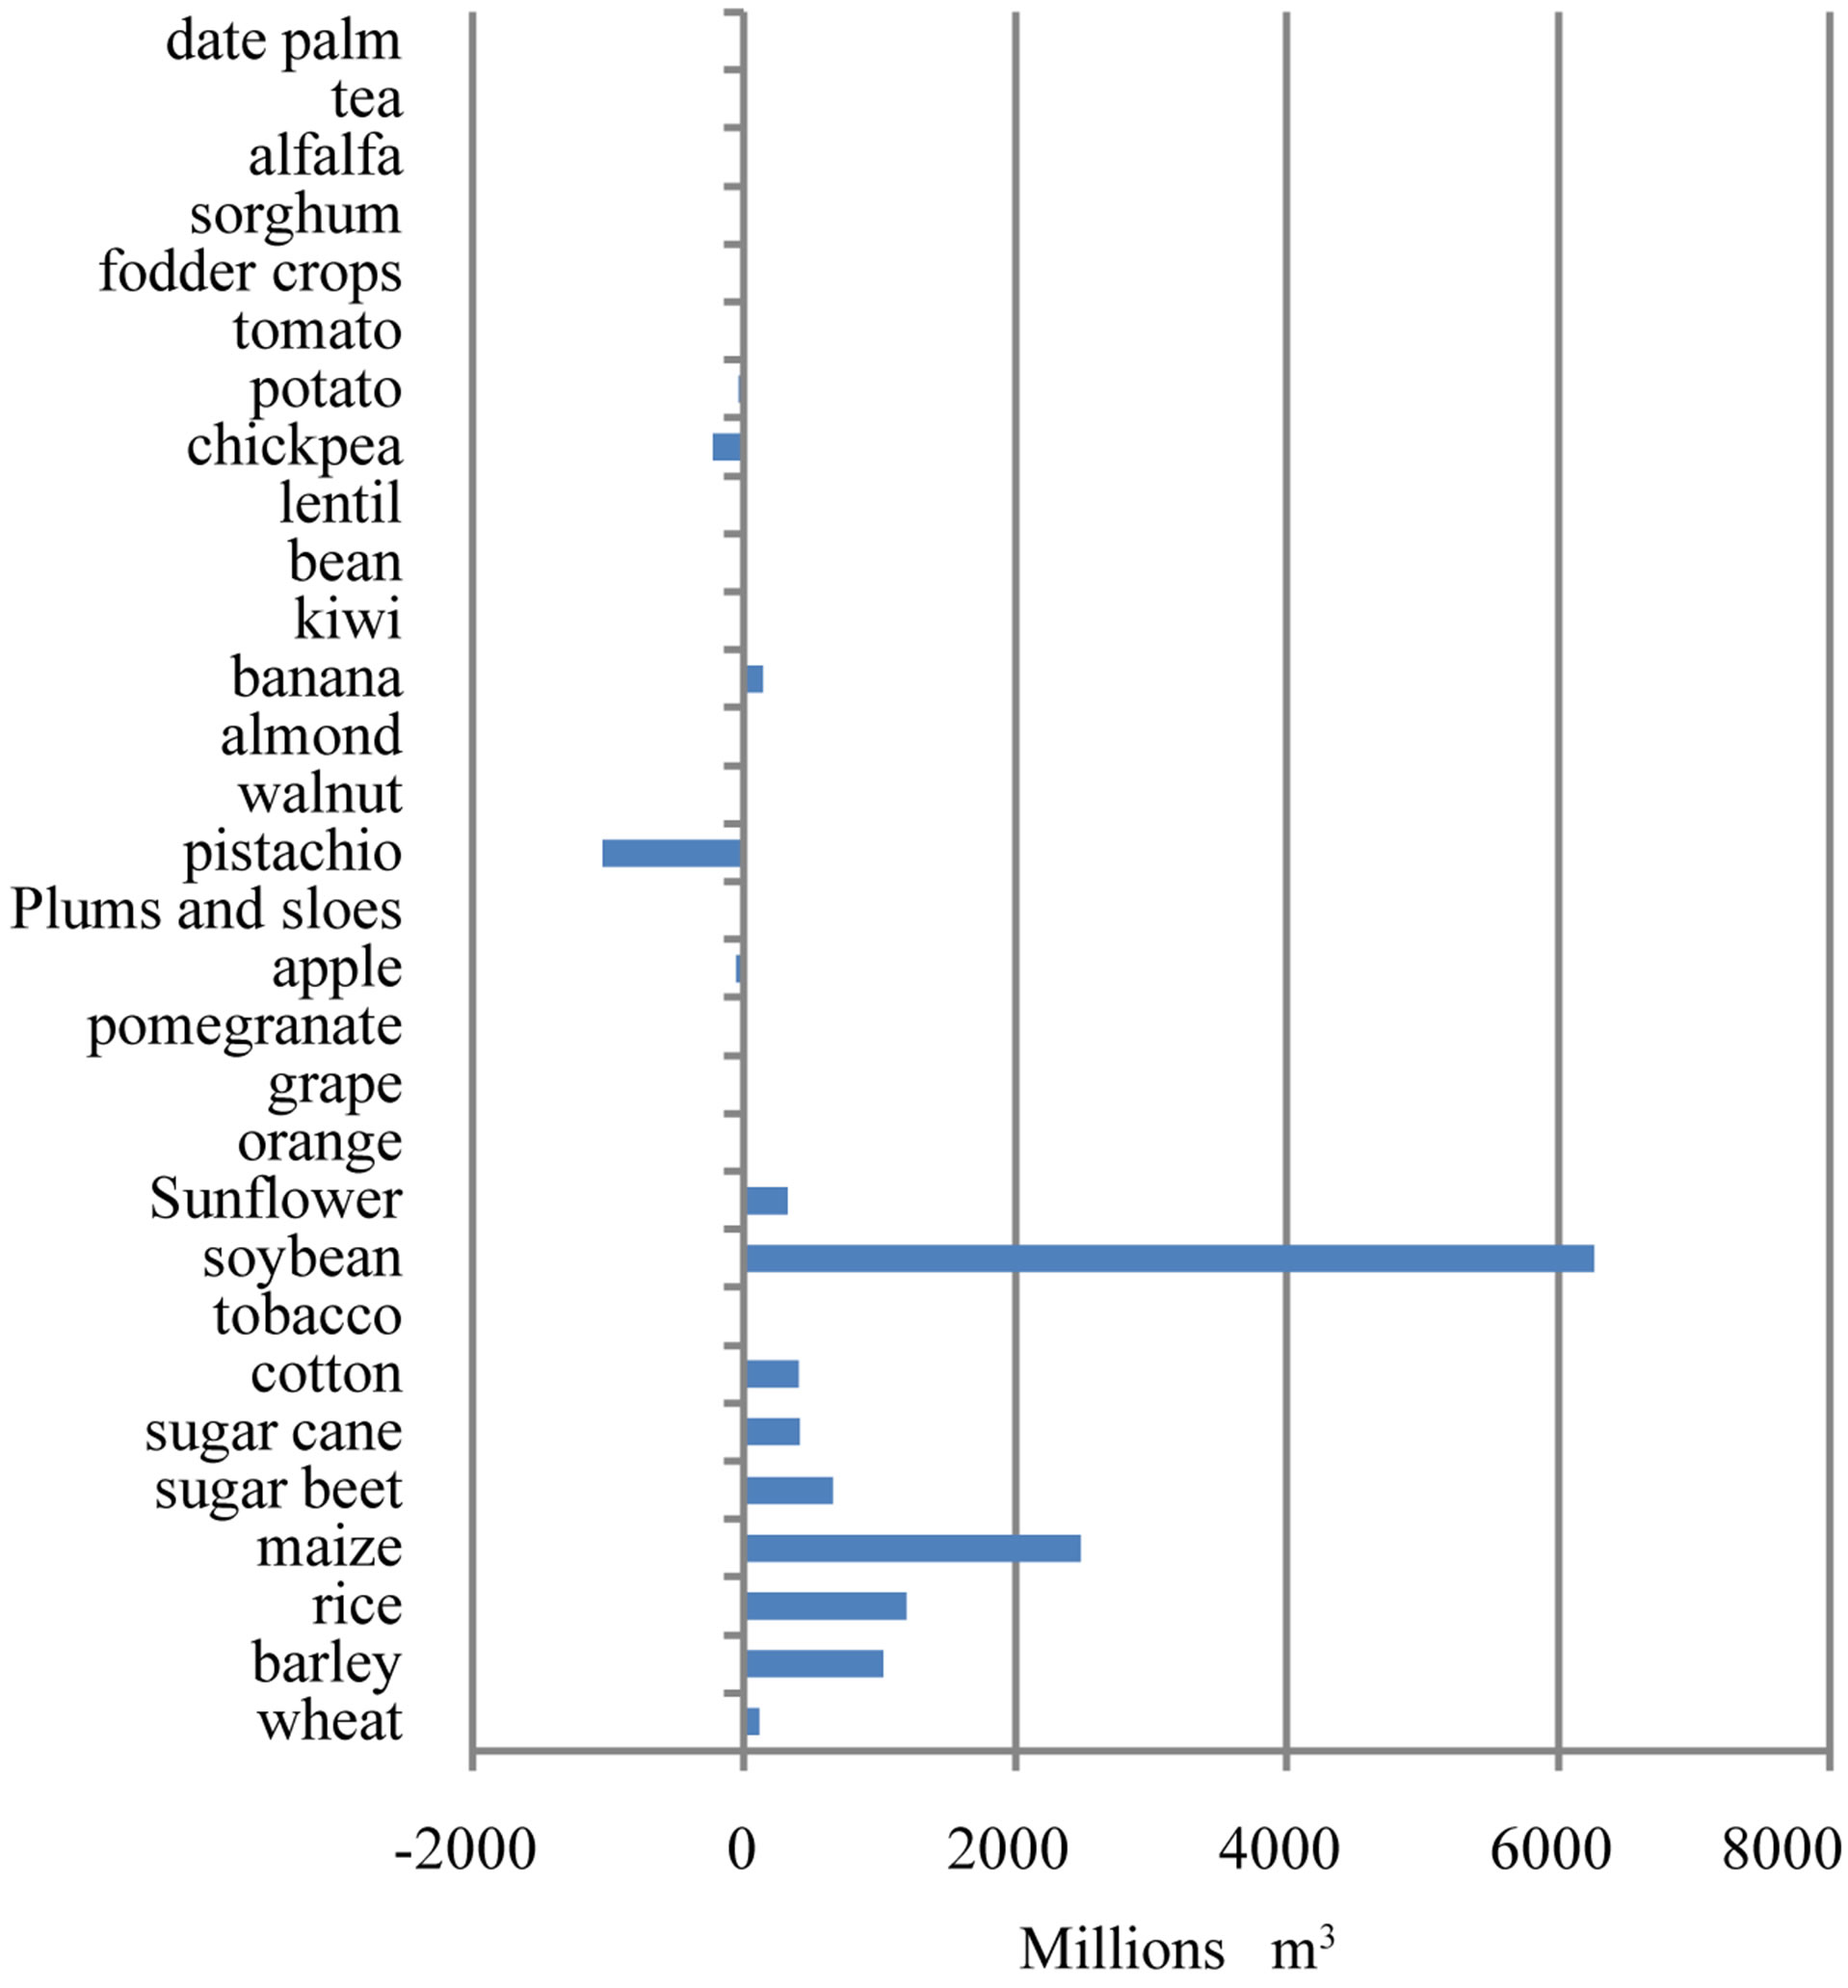
Figure 9. The net virtual water import (mcm) of different agricultural products in 2006.
agricultural products in agricultural water footprint based on virtual water and production of crops in 2005-2006. Cereals has the largest proportion on agricultural water footprint about 42%, then relates 14% to oil seeds such as soybeans and sunflower seeds, 13% to fodder crops, 11% to industrial crops such as sugar cane, sugar beet, cotton and tobacco and 11% to fruits.
The total volume of water used for crop production is 110.2 Gm3/yr or 1563.2 m3/yr/cap. By considering Figure 11, adding net virtual water import to internal water use results virtual water budget [14,24]. If we produced production import from internal water resources, because internal water uses consist of gross water need for crops, we should conserve irrigation efficiency in production process. So the real virtual water import and total agricultural water footprint are about 20.78 and 110.2 bcm respectively.
This means that agricultural virtual water budget is about 112.78 Gm3/yr. Hoekstra and Hung [3] estimated water foot print of Iran in period 1995 to 1999. Results are comparable in two researches. In that research, country population had predicted about 62,762,116 capita, gross virtual water export (import) were 803.41 × 10⁶ (6623.1 × 106) m3/yr respectively. So, net virtual water import had estimated about 5819.7 × 106 m3/yr and agricultural water footprint was near 1457 m3/yr/capita.
It is noted that water needs are affected not only on production volume but also their virtual water content. For instance, cereals include more than 50 percent of irrigated land in 2006, but due to their virtual water con-
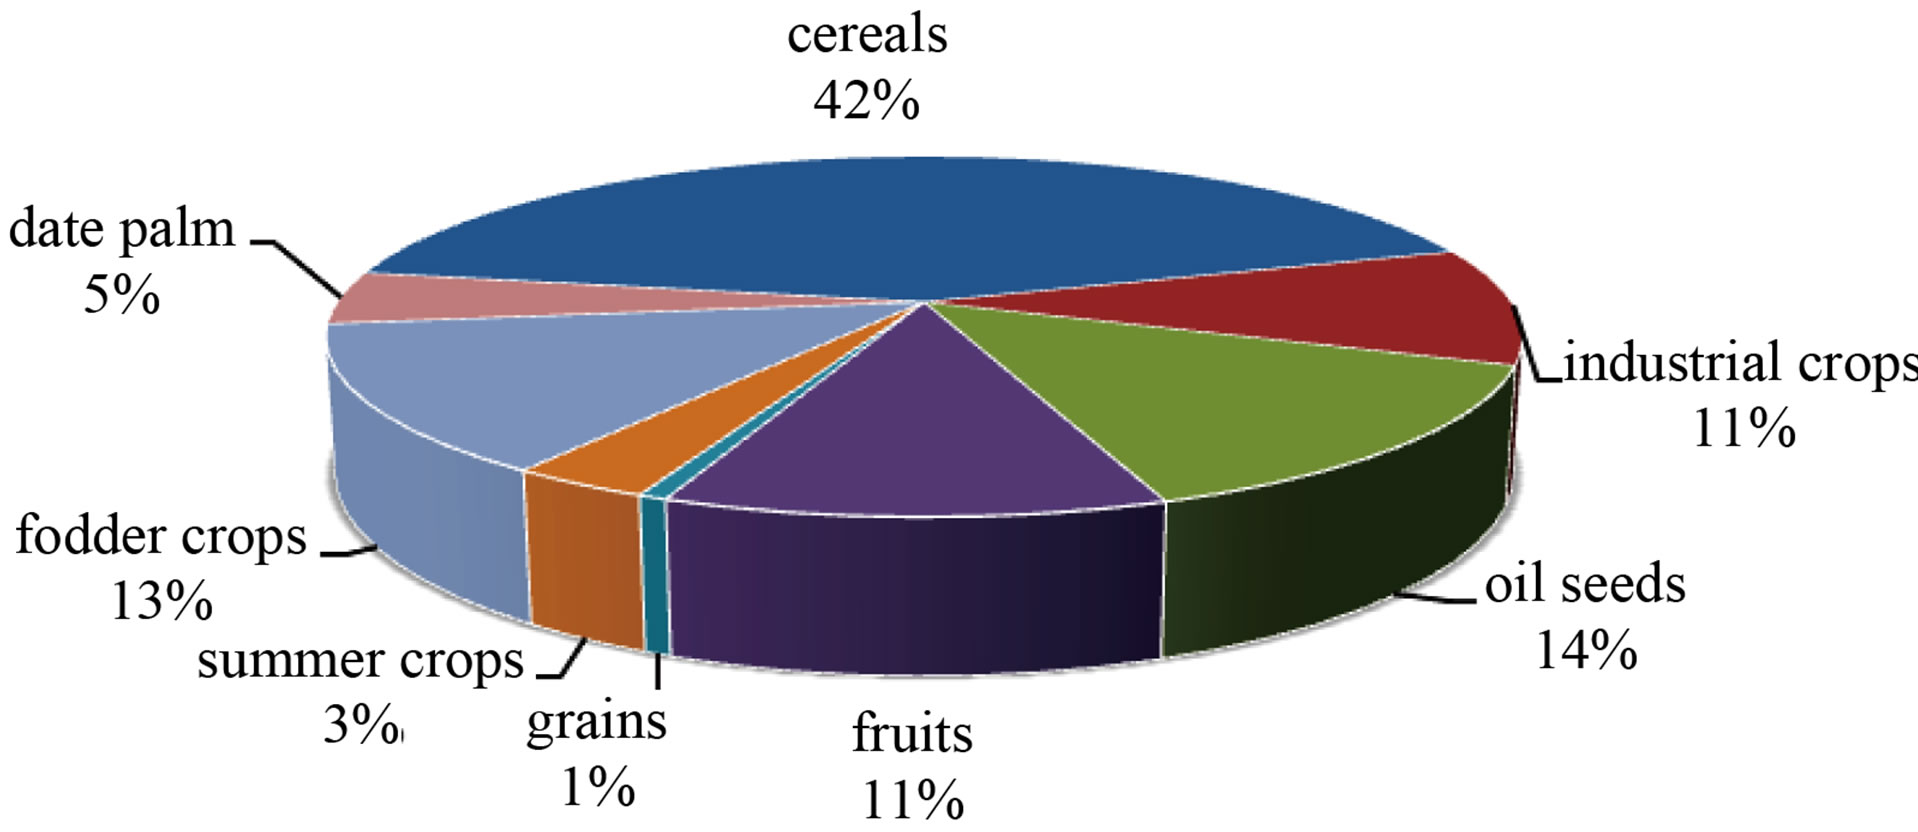
Figure 10. The proportion of agricultural crops groups in WF of Iran in 2005-2006.
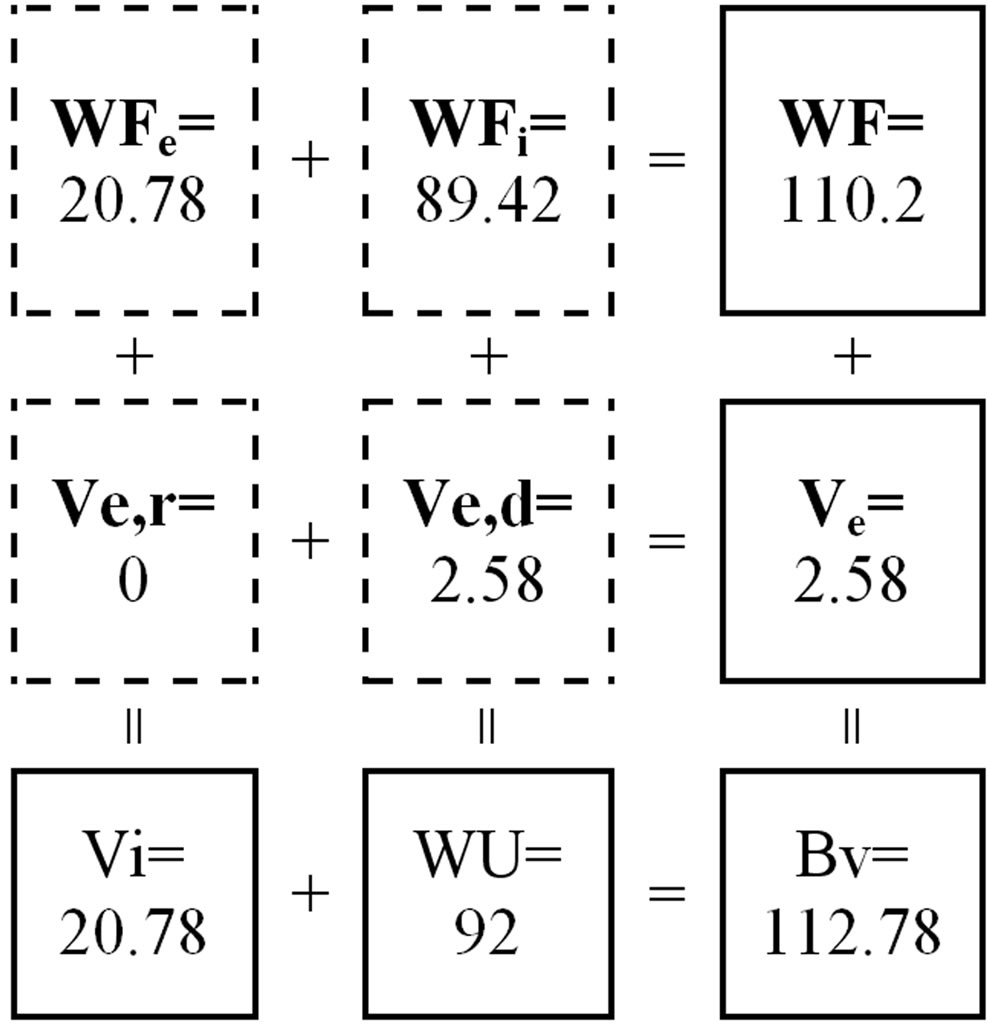
Figure 11. The budget of virtual water in Iran (2005-2006).
tent, they consume about 42% of water resource appropriation in agricultural sector. Therefore, fruits, summer crops and grains have fewer shares in WF in comparison to appropriated land; however industrial crops and oil seeds due to high virtual water content consume more water as intensive water crops.
4. Conclusions
Virtual water is total water used to produce goods or services. Virtual water content of each crop varies in regions due to differences in climate condition and water productivity. For instant, in arid and semi arid regions of the country, high evaporative demand causes low water productivity to crop production. Sustainable cropping pattern can increase water use productivity, thus decrease virtual water content. Improving irrigation practices promote water use productivity. So, we can increase more irrigated land by significant appropriated water or decline pressure on water resources by saving water. Agricultural water footprint of Iran in 2005-2006 has estimated to be about 103.641 bcm or 1470 m3/yr/cap. By conserving irrigation efficiency, this rose up to 110.2 Gm3/yr or 1563.2 m3/yr/cap. Iran has supplied about 87% of agricultural water footprint from national water resources and reminded water requirement by virtual water import as international agricultural production trade. Therefore Iran has saved about 20.78 bcm of internal water resources in 2005-2006. Although net agricultural water import was about 11.64 bcm, this is not consisting irrigation efficiency. In this research water footprint estimation has based only on agricultural crops consumption and total water footprint index includes comprehensive consumption pattern. Obviously water footprint of the whole goods and services is greater than agricultural water footprint. Since production process of each commodity requires water. Although industrial and withdrawal sectors consume less water than agricultural sector, their appropriation would be considered.
REFERENCES
- L. R. Brown, “Plan B2.0: Rescuing a Planet under Stress and a Civilization in Trouble,” W. W. Norton, New York, 2006.
- A. Alizadeh and A. Keshavarz, “Status of Agricultural Water Use in Iran. Water Conservation, Reuse and Recycling,” Proceedings of an Iranian-American Workshop. http//:www.nap.Edu/catalog/1124.html
- A. Y. Hoekstra and P. Q. Hung, “Virtual Water Trade: A Quantification of Virtual Water Flows between Nations in Relation to International Crop Trade,” Value of the Water Research Report Series, No. 11, UNESCO-IHE, Delft, 2002. www.waterfootprint.org/Reports/Report11.pdf
- A. Y. Hoekstra and P. Q. Hung, “Globalization of Water Resources: International Virtual Water Flows in Relation to Crop Trade,” Global Environmental Change, Vol. 15, No. 1, 2005, pp. 45-56. doi:10.1016/j.gloenvcha.2004.06.004
- J. A. Allan, “Fortunately There Are Substitutes for Water Otherwise Our Hydro-Political Futures Would Be Impossible,” In: ODA, Priorities for Water Resources Allocation and Management, ODA, London, 1993, pp. 13-26.
- J. A. Allan, “Overall Perspectives on Countries and Regions,” In: P. Rogers and P. Lyndon, Eds., Water in the Arab World: Perspectives and Prognoses, Harvard University Press, Cambridge, Massachusetts, 1994, pp. 65- 100.
- J. A. Allan, “Virtual Water: A Long Term Solution for Water Short Middle Eastern Economies,” Occasional Paper 3, School of Oriental and African Studies (SOAS), University of London, 1997.
- M. Falkenmark, “Coping with Water Scarcity under Rapid Population Growth,” Conference of SADC Ministers, Pretoria, 1995, pp. 23-24.
- H. H. G. Savenije, “The Role of Green Water in Food Production in Sub-Saharan Africa,” Article Prepared for FAO, IHE, Delft, The Netherlands, 2000.
- J. Ringersma, “Optimizing Green Water Use and Improved Crop Water Productivity under Rain Fed Agriculture in Sub-Sahara Africa,” ISRIC Abstract of a Data Search and Literature Study, 2003. http://www.isric.nl/Greenwater/Green water ABSTRACT. doc
- E. Obuobie, P. M. Gachanja and A. C. Dorr, “The Role of Green Water in Food Trade,” International Doctoral Studies, Center of Development Research University of Bonn, 2005.
- H. Yang, L. Wang, K. Abbaspour and A. J. B. Zehnder, “Virtual Water Highway Water Use Efficiency in Global Food Trade,” Hydrology and Earth System Sciences Discuss, Vol. 3, 2006, pp. 1-26. doi:10.5194/hessd-3-1-2006 www.copernicus.org/EGU/hess/hessd/3/1
- A. Y. Hoekstra, W. Gerbens-Leenes and T. H. Van der Meer, “Water Footprint Accounting, Impact Assessment and Life-Cycle Assessment,” Proceedings of the National Academy of Sciences, Vol. 106, No. 40, 2009, pp. 82-92. doi:10.1073/pnas.0909948106
- A. Y. Hoekstra and A. K. Chapagain. “Water Footprint of Nations, Water Use by People as a Function of Their Consumption Pattern,” Water Resource Management, Vol. 21, No. 1, 2007, pp. 35-48. doi:10.1007/s11269-006-9039-x
- P. R. Van Oel, M. M. Mekonnen and A. A. Hoekstra, “The External Water Footprint of the Netherlands: Quantification and Impact Assessment,” Value of Water Research Report Series No. 33, UNESCO-IHE, Delft, The Netherlands, 2008.
- A. Y. Hoekstra, A. K. Chapagain, M. M. Aldaya and M. M. Mekonnen, “Water Footprint Manual,” State of the Art, 2009.
- M. M. Mekonnen and A. Y. Hoekstra, “A Global and High-Resolution Assessment of the Green, Blue and Grey Water Footprint of Wheat,” Hydrology and Earth System Sciences, Vol. 14, 2010, pp. 1259-1276. doi:10.5194/hess-14-1259-2010
- F. Bulsink, A. Y. Hoekstra and M. J. Booij, “The Water Footprint of Indonesian Provinces Related to the Consumption of Crop Products,” Hydrology and Earth System Sciences, Vol. 14, 2010, pp. 119-128. doi:10.5194/hess-14-119-2010
- Agricultural Scientific Information and Documentation Center (ASIDC), 2006. http://agrisis.areo.ir/
- Iran Meteorological Organization, 2006. http://www.irimo.ir/farsi/agro/index.asp
- Food and Agriculture Organization of United Nations, 2006. http://faostat.fao.org/site/342/default.aspx
- A. Arabi Yazdi, “Estimation of Agricultural Water Footprint in Iran and Assessment of Using Virtual Water Trade for Food Security Purposes,” M.Sc. Dissertation, Water Department, Ferdowsi University of Mashhad, Iran, 2008.
- A. Arabi Yazdi, A. Alizadeh and F. Mohammadian, “Study on Ecological Water Footprint in Agricultural Section of Iran,” Journal of Water and Soil, Vol. 23, No. 4, 2009, pp. 1-15.
NOTES
*Corresponding author.
