Journal of Water Resource and Protection
Vol. 2 No. 10 (2010) , Article ID: 2970 , 9 pages DOI:10.4236/jwarp.2010.210108
Water Quality Assessment, Trophic Classification and Water Resources Management
1Israel Oceanographic and Limnological Research, Kinneret Limnological Laboratory, Migdal, Israel
2Centre for Biodiversity and Ecology Research, University of Waikato, Waikato, New Zealand
3Leibniz-Institute of Freshwater Ecology & Inland Fisheries, Department of Stratified Lakes, Neuglobsow, Germany
4Belarus State University, Laboratory of Hydroecology, Minsk, Belarus
E-mail: parpar@ocean.org.il
Received July 19, 2010; revised August 9, 2010; accepted August 18, 2010
Keywords: Water Quality, Trophic Level Index, Delphi Method, Sustainable Management, Lakes
ABSTRACT
Quantification of water quality (WQ) is an integral part of scientifically based water resources management. The main objective of this study was comparative analysis of two approaches applied for quantitative assessment of WQ: the trophic level index (TLI) and the Delphi method (DM). We analyzed the following features of these conceptually different approaches: A. similarity of estimates of lake WQ; B. sensitivity to indicating disturbances in the aquatic ecosystem structure and functioning; C. capacity to reflect the impact of major management measures on the quality of water resources. We compared the DM and TLI based on results from a series of lakes covering varying productivity levels, mixing regimes and climatic zones. We assumed that the conservation of aquatic ecosystem in some predefined, “reference”, state is a major objective of sustainable water resources management in the study lakes. The comparison between the two approaches was quantified as a relationship between the DM ranks and respective TLI values. We show that being a classification system, the TLI does not account for specific characteristics of aquatic ecosystems and the array of different potential uses of the water resource. It indirectly assumes that oligotrophication is identical to WQ improvement, and reduction of economic activity within the lake catchment area is the most effective way to improve WQ. WQ assessed with the TLI is more suitable for needs of natural water resources management if eutrophication is a major threat. The DM allows accounting for several water resource uses and therefore it may serve as a more robust and comprehensive tool for WQ quantification and thus for sustainable water resources management.
1. Introduction
The most challenging problem of modern theoretical and applied hydroecology is to understand the fundamental principles of ecology for its application in effective management of water resources for both hydrological availability and water quality [1]. Quality is not absolute; the terms “good” or “poor” water quality have meaning only in relation to the use of water and the assessment of the user. Quantification of water quality (WQ) aims at describing the condition of a water body with reference to human needs. Investigations of the eutrophication phenomenon in the 1960s and 1970s, resulted in quantification of a trophic classification system [2,3]. WQ has been considered synonymous with ‘trophic status’ in many cases [4-6]. Further progress in WQ assessment is associated with implementation of optimization approaches to establishment of the natural resource sustainable management policies contributing to conservation of aquatic ecosystems within some desired reference condition [1,7]. We analyze and compare two key approaches to WQ quantification in relation to the increasing need for natural water resources management. The approaches include:
1) Quantitative modification of the expert panel method developed by Horton [8] and Ott [9] and integrated into the Delphi method (DM [10]). In the DM, the WQ ranking is completely defined by the needs of the water resources uses and management [11]. DM has been implemented to WQ assessment for several natural waterbodies in the USA [12,13], New Zealand [14], Belarus [15] and Israel [16];
2) The trophic classification method [2] and its modification, the Trophic Level Index [4] (hereafter termed ‘TLI’). This approach involves ranking lakes according to their productivity and nutrient regimes and thereby evaluating WQ changes based solely on trophic state responses to various forcing factors (e.g., nutrient loading), the TLI in many cases serves as a monitoring tool [17-19].
Comparative studies of the Delphi and TLI approaches to WQ assessment for water resources management are not available in the literature. In this study, we compare the DM and TLI using a quantitative WQ assessment based on results from a series of lakes covering varying productivity levels, mixing regimes and climatic zones. The lakes include Kinneret (Israel), Stechlin (Germany), Naroch Lakes (Belarus) and Rotorua Lakes (New Zealand), all of which have extensive databases, are major focal points for regional lake management. We will search for a reply to the following questions: Do these conceptually different approaches provide similar estimates of lake WQ? Do these approaches successfully indicate disturbances in the aquatic ecosystem structure and functioning? How well do these approaches reflect the impact of major management measures on the quality of water resources?
2. Material and Methods
2.1. Water Quality Assessment for Water Resources Management Purposes
Quantitative assessment of WQ should be based on the following principles [11]:
1) WQ system consists of water quality indices (WQI), and their permissible ranges corresponding to acceptable WQ.
2) The following functional correspondences should be established: between the ecological values of the WQI (e.g. nutrient concentration or Secchi depth) and some numeric rating value (R): R = f(WQI); between WQI and the intensity of the management measures (MM. e.g., economic activity in the watershed and water supply): WQI = Φ(MM). These two relationships allow establishment of a direct relationship between WQ and the management measures: R = F(MM)
3) Any system of WQ is subjective, reflecting a compromise between different stake holders and partners in water resources use and management.
4) An established WQI system should serve as a common language for all partners using a water resource, and in this sense, it is a tool for water resources management. Quantified WQ should also serve as a management target.
2.2. Brief Description of Study Lakes
Lake Kinneret (Israel) is a subtropical meso-eutrophic lake located at about an altitude of −210 m (i.e., below mean sea level). The lake water level depends on climatic inputs and withdrawal for water supply. Limnology of the lake is well documented [20]. The WQ system for conservation of L. Kinneret was assessed with the Delphi method [16]. The major environmental threat to the conservation of the lake ecosystem is the progressive lowering of its water level. The most critical issue for lake ecosystem stability and WQ is the progressively increasing proportion of cyanobacteria amongst the algal assemblage [21] and increase of water salinity above an assigned acceptable level of 240 mg Cl l-1.
The Naroch Lakes (Belarus) consist of three connected lakes: Batorino (eutrophic), Miastro (meso-eutrophic) and Naroch (oligo-mesotrophic). The Naroch Lakes has been intensely studied [22]. The WQ system for the Naroch Lakes was also established based on the Delphi method [15].
Lakes Rotorua and Rotoiti are two lakes that form part of a complex of volcanic lakes known collectively as the Rotorua Lakes, in the North Island of New Zealand. A Trophic Level Index is assigned from routine monitoring conducted in the Rotorua Lakes [19] and is used as a basis for the implementation and assessment of management actions for the lakes [4]. An attempt to assess WQ has also been made using the Delphi method for Lakes Rotorua and Rotoiti (Hamilton and Parparov, unpublished data).
Lake Stechlin (Germany) is one of the few remaining oligotrophic clear-water lakes in Germany’s South-Baltic Lake District. Long-term monitoring indicates significant changes in the structure and function of the lake ecosystem especially throughout the past two decades. The changes relate to a decrease in oxygen concentration in the deeper hypolimnion accompanied with substantial increase of hypolimnetic phosphorus concentration, and a trend of increasing of chlorophyll a concentration [23,24]. An attempt to assess WQ based on the Delphi method for Lake Stechlin has recently been completed (Kasprzak, unpublished data).
Relevant limnological properties of the study lakes are summarized in Table 1. In this study we use the following data sets: for Lake Kinneret - 1991 to 2008, Naroch

Table 1. Limnological variables for the study lakes. For the Naroch Lakes, the first value relates to the period from 1979 to 1982 and the second to the period from 1988 to 2000.
Lakes - 1979 to 2008, Rotorua Lakes - 1990 to 2005, and Lake Stechlin - 1992 to 2006.
2.3. Methodology of Trophic Level Index and Delphi Methods of Water Quality
Assessment
In the DM, WQ has five grades: from “very bad” (Rating 0 to 20) to “excellent” (Rating 80 to 100) [10,14]. The correspondence between the ecological values of WQI (e.g., nutrient concentration or Secchi depth) and some numeric Rating value (0 < R < 100) was established in a form of a rating curve. Long-term monitoring data, including frequency distributions, means and standard deviations of limnological parameters in the studied lakes were provided to separate expert panels for each lake. The experts assessed the “reference state” for each lake as a set of variables corresponding to time periods when lake water resource was suitable for all purposes (e.g., domestic water supply, recreation, fisheries). The panels were asked to choose about 10 parameters most indicative of WQ in the studied lakes, and to construct rating curves for each parameter, spanning the entire range of values observed in the lake. “Acceptable ranges” for the separate water quality indices were restricted to the range 60-100. Rating curves from individual panel members were averaged for each index. Piece-wise approximations of ratings and parameter values were used to construct graphic presentations of the temporal dynamics of the WQIs [16].
In the TLI, lake trophic state is classified by seven types: from “ultramicrotrophic” (rank 1) to “hypertrophic” (rank 7) [2,4]. Traditionally, the users of the TLI establish a correspondence between trophic status and water quality, i.e., by default oligotrophic lakes are considered to be of “good” water quality, and eutrophic lakes of “bad” water quality. Initially, the TLI system included three indices: Secchi depth (SD), concentrations of total phosphorus (TP) and chlorophyll a (Chl) [2]. This system has subsequently been supplemented with total nitrogen (TN) concentration [4]. The correspondence between ecological and Trophic Level values for individual indices (TLi) was established in the form of a logarithmic function connecting the TL to four “trophic” parameters [2,4]:
TLi = ai + biLOG(Pari) (1)
where ‘i’ varies from 1 to 4, Pari means SD, TN, TP and Chl, and ‘a’ and ‘b’ are coefficients.
For the objectives of this study, the TL varies from a value of 2 (oligotrophic = “excellent”) to 7 (hypertrophic = “very bad”) (we omitted the grade of 1, ‘ultramicrotrophic’, as irrelevant for this study). A similar correspondence in the DM is described by the rating curve R = f(WQI), in which the values of the WQ rating vary from 100 (“excellent”) to 0 (“very bad”). The comparison between two systems was quantified as a relationship between the DM ranks and respective TL values:
R[TL] = 140 – 20*TL(2)
The permissible range of the WQI can then be defined from the following expression: 60 ≤ R[WQI] ≤ 100 We assumed that the conservation of aquatic ecosystem in some predefined, “reference”, state is a major objective of sustainable water resources management in the study lakes. For the objectives of this study we used an operational definition of “sustainable management” suggested earlier [15], where water resources management should allow use of water resources while maintaining the quality of the resource in question within defined permissible ranges, i.e.{WQIL < WQI < WQIH}Û{MML < MM < MMH}(3)
where ‘L’ and ‘H’ correspond to the lower and upper permissible values of the WQ index and Management Measure, and Û means correspondence. The set of management measures corresponding to (3) forms the basis for a “sustainable management policy”.
In the TLI, an aggregated WQ (TLI) is calculated as an arithmetic mean of four “trophic” indices [4]:
TLI = (TLChl+ TLSD +TLTP+TLTN)/4(4)
Accounting for (2) and (4), the TLI was transformed into rating values as follows:
R[TLI] = 140 – 20*TLI(5)
We also compared R[TLI] with a similar arithmetic mean value obtained for the same trophic indices assessed with the DM:
R[DM] = (R[Chl] + R[S] + R[TP] + R[TN])/4 (6)
where R[Chl], R[S], R[TP] and R[TN] are the rating values of Chl, SD, TP and TN, respectively, assessed with the DM. For some of the studied lakes with suitable databases (Kinneret, Stechlin and Naroch Lakes), R[TLI] was also compared with the values of the composite water quality index (CWQI) calculated for entire set of WQIs established with the DM according to the formula [11]:
CWQI = Σ(Ri*(R0−Ri)/Σ(R0−Rk))(7)
where R0 = 100, and Ri,k are the rating values for WQI i or k (i, k = 1, 2,…n) from the WQ system established with the DM.
3. Results
3.1. Effects of Water Resource Uses and Environmental Threats on Water Quality Assessment
The multiple-use nature of water resources and the wide range of environmental threats require significant expansion of the variables included in the conventional TLI system, even for the objective of diagnosing a change in the lake trophic state. Therefore, at the initial stage of WQ assessment, the expert panel, using the DM, supplemented the WQI systems in all of the study lakes with additional WQIs beyond the four “trophic” indices in the TLI system. These expanded systems allowed for indications of WQ changes due to specific major water resource uses and associated environmental threats. The additional variables could be categorized generally as
- eutrophication: given by the percentage of cyanobacteria in algal biomass (Lakes Kinneret and Rotorua and Naroch Lakes); percent of oxygen saturation in the near bottom water layer (Naroch Lakes and Lake Stechlin); total phosphorus at the end of stratification period in the deepest water layer (Lake Stechlin); percent of oxygen saturation in surface water (Naroch Lakes); volumetric hypolimnetic oxygen demand (L. Rotorua);
- pollutants indicative of organic pollution or relevant to human health: number of coliform bacteria (Lake Kinneret and Rotorua Lakes) and BOD5 test (Naroch Lakes);
- food supply for fishes: zooplankton biomass (Naroch Lakes, Lake Kinneret, Lake Stechlin and Lake Rotorua);
- increase in salinity above accepted drinking water supply standards (240 mg l-1): chloride concentration (Lake Kinneret);
- recreation: pH and area occupied by emergent vegetation (Naroch Lakes).
3.2. Rating Curves and Permissible Ranges of WQI in DM and TLI Methods
We illustrate the differences between DM and TLI by comparing the rating curves for Chl established for oligotrophic Lake Stechlin and meso-eutrophic Lake Kinneret (Figure 1). In the TLI, lowering of a lake trophic status (i.e., decrease in Chl) is equivalent to gradual improvement of WQ. In contrast to this, the DM shows that both an increase and a decrease of chlorophyll outside of some ‘permissible’ range (which varies between lakes) should be interpreted as WQ deterioration. Similar distinctions could be revealed for other WQIs under consideration (TN, TP and Secchi depth). This basic difference may lead to contrasting values for the permissible ranges for individual WQIs and management measures.
In the DM, permissible ranges for ecological values of individual WQIs can be described by the following equation:
{WQIL ≤ WQIc ≤ WQIH}Û60 ≤ R[WQI] ≤ 100(8)
where WQIC is the current value of the index; WQIL and WQIH are the lower and upper permissible value of the index, and Û means “correspondence”.
The TLI provides a threshold value, which can be described for TN, TP and Chl as follows:
{WQIc ≤ WQIH}Û60 ≤ R[WQI] ≤ 100(9)

Figure 1. Rating curves of chlorophyll a assessed with the DM for Lakes Kinneret (round symbols) and Stechlin (dashed line), and calculated for the TLI (R[TLchl], solid line) from ((4) and (8)). The horizontal line (R = 60) represents a boundary between acceptable and unacceptable WQ. Note logarithmic scale on X-axis.
For Secchi depth, this ‘threshold’ value is:
{WQIc > WQIL}Û60 ≤ R[WQI] ≤ 100(10)
The main features of the two approaches can be illustrated using permissible ranges for chlorophyll (Chl) established for the study lakes (Figure 2). In the TLI, minimization of concentrations of TN, TP and Chl is indirectly considered as the desirable objective. An increase in Chl would therefore be taken as a sign of eutrophication, and therefore, of WQ ‘deterioration’. According to this approach, the concentration limit of Chl for acceptable WQ (R[Chl] ≥ 60) is one-sided (dashed line in Figure 2), represented by the oligotrophic category of Chl ≤ 5.2 µg l-1 and is identical for all lakes. In the DM, one-sided rating curves are established only for pollution variables (e.g., densities of fecal coliform bacteria), or other components where increases will always be undesirable (e.g., percentage of cyanobacteria in Lake Kinneret). For most WQIs, the DM gives a two-sided, lake-specific permissible range. For example, the desirable Chl ranges are 0.8 to 2.1 µg Chl l-1 for oligotrophic Lake Stechlin, 13.0 to 34.0 µg Chl l-1 for Lake Miastro, and 7.0 to 27.0 µg Chl l-1 for eutrophic Lake Batorino.
Similar distinctions between the TLI and DM exist in the case of use of total phosphorus (TP) as a WQI (not shown). The TLI gives a single-sided permissible limit of TP ≤ 20 mg l-1 (identical for any lake), with concentrations higher than 20 mg l-1 considered to represent deterioration in WQ. The DM defines a two-sided permissible range for TP: 7 < TP < 19 mg l-1 for oligotrophic Lake Stechlin and 30 < TP < 100 mg l-1 for eutrophic Lake Batorino.
3.3. Compatibility of Aggregated Estimates of WQ
Conceptual differences in approaches to WQ quantifica-
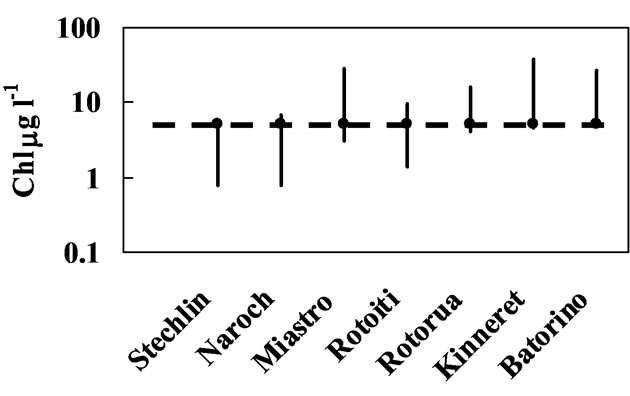
Figure 2. Comparison of permissible ranges for Chl a assessed with the DM (vertical lines) and TLI. The horizontal line represents the threshold values assessed with the TLI: 5.2 μg Chl l-1 The lakes on the X-axis are sorted according to their trophic state: from the lowest chlorophyll values in oligotrophic Lake Stechlin to the highest in eutrophic Lake Batorino.
tion cause distinctions in the aggregated WQ estimates obtained from the same sets of ecological values. The relationship between R[TLI] and R[DM] in all three Naroch lakes is non-linear (bell-shaped curve). The TLI qualifies as ‘acceptable’ WQ only for oligo-mesotrophic L.Naroch and a few values from L. Miastro, while WQ in eutrophic L. Batorino is ranked as ‘unacceptable’ (Figure 3). The DM qualifies most of the aggregated WQ values in all three Naroch lakes as ‘acceptable’.
Monitoring of temporal dynamics of WQ is one of the tasks of WQ quantification [15]. Comparison of the dynamics of the calculated aggregated estimates (R[TL], R[DM] and CWQI; ((4) to (7)) indicates different sensitivities in their representation of change over time. For oligotrophic L.Stechlin, the dynamics of both R[TLI] and R[DM], calculated for the four ‘trophic’ indices ((5) and (6), respectively), do not indicate significant changes in WQ of these lakes over the last 15 years (Figure 4). In contrast, the aggregated WQ calculated as CWQI, from an expanded set of WQ variables (7), indicates clear-cut
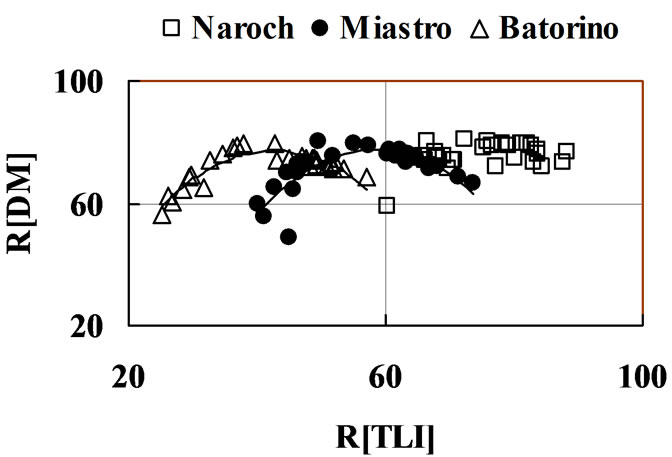
Figure 3. Scatter plots of the relationships between aggregated WQ estimates in the DMi and TLI (R[DM] and R[TLI]), respectively, for the Naroch Lakes (annual average values for 1978-2008). The lines represent best-fit regression lines. For the TLI, the acceptable WQ corresponds to areas to the right of the vertical line given by R[TLI] = 60. For the DM, acceptable WQ corresponds to areas above the horizontal line given by R[DM] = 60.
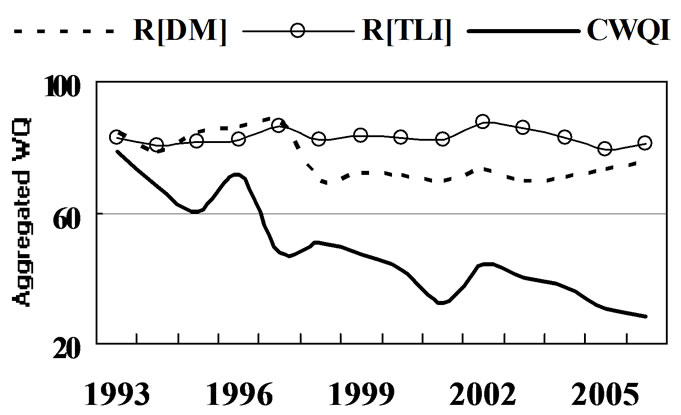
Figure 4. Time series of annual average estimates of aggregated WQ for L. Stechlin: R[TLI] (4&5), R[DM] (6) and CWQI (7).
trend in WQ deterioration. For L. Kinneret (not shown), the TLI indicates that WQ remains close to the boundary value that defines the difference between ‘good’ and ‘intermediate’ WQ. Conversely, the CWQI dynamics for L. Kinneret indicates gradual WQ deterioration from ‘good’ to ‘intermediate’. Note that WQ deterioration in these lakes (as indicated by the CWQI dynamics) is associated primarily with the in-lake processes usually considered as signs of eutrophication: disruptions of phosphorus and oxygen regimes in hypolimnetic water (Lake Stechlin) and an increase in cyanobacteria abundance (L. Kinneret).
3.4. Relationships between WQ and Management Policy
Existing models (e.g., [25,26]) relate TP loading to TP concentrations in a lake. Here we applied the model of Rekhow [27] to L. Kinneret as this model specifically includes the potential addition of an internal P load associated with an anoxic hypolimnion. Assuming stability of the average lake depth and hydraulic turnover rate, for L. Kinneret, the following relationship can be established:
Pload [g m-2 yr-1] = 15.7*TP [mg l-1](11)
Permissible ranges for total phosphorus for L. Kinneret are as follows: TP ≤ 20 g l-1 (as obtained with the TLI from (8) and (10) and 7.5 ≤ TP ≤ 36 g l-1 (from the DM, [16]).
Substituting these values into (11) allows for an estimate of the permissible ranges of the external phosphorus load (Pload). The estimated maximum allowable Pload (based on TLI allowable TP values) is Pload ≤ 0.31 g m-2 yr-1 (Figure 5), which, given the TLI underlying assumptions, is universal for any lake, independent of its use as a water resource. In contrast, the permissible range of Pload into Lake Kinneret, based on the DM and its acceptable range of TP, is 0.12 to 0.58 g m-2 yr-1 (Figure 5). Management of Lake Kinneret due to Pload regulations within this established permissible range should allow sustaining and conserving the Lake Kinneret ecosystem.
For L. Kinneret, the relationship between aggregated WQ (as R[TLI] and CWQI) was established for the lake water level under the assumption that the water level is predominantly determined by the volume of water pumped from the lake and thus is a management decision. In a water level range of −210 to −214 m of, there was no significant relationship between R[TLI] and lake water level (Figure 6). Consideration of the aggregated WQ based on the expanded WQ system (CWQI) indicated a statistically significant (at P < 0.05) tendency for deterioration of the lake WQ with water level lowering (Figure 6). This dependence allowed estimation of a

Figure 5. Relationship between management measure (phosphorus loading, Pload) and rating values of WQI (total phosphorus, TP): R[TLTP] – obtained from (11) for L. Kinneret with the TLI (solid curve); R[TP] – obtained with the DM (dotted curve). The arrows indicate permissible ranges for Pload as regards to TP concentration (corresponding to R ≥ 60). Horizontal line corresponds to R = 60.

Figure 6. Scatter plots of the relationships between L. Kinneret water level lowering (WLL) as a management measure, and aggregated WQ: R[TLI] and CWQI (solid triangles and open circles, respectively). The best fit regression of R[TLI] vs. WLL (dashed line) is not statistically significant (R2 = 0.12, P > 0.05), while the regression of CWQI vs. WLL (solid line) is statistically significant (R2 = 0.28, P < 0.05). The block arrow indicates the permissible range of the lake water level lowering estimated with the DM.
threshold water level value of approximately −213 m.
4. Discussion
The problem of WQ quantification is equivalent to the quantitative solution of the task of “qualification”, i.e., the terms like “good/bad”, “improvement/deterioration” should be expressed in measurable units. This task is principally different from the task of “classification” (e. g., lake classification according to their mixing or trophic status). The developer of the quantitative trophic classification [28] warned: “An unfortunate misconception concerning trophic state is that the term is synonymous with the concept of water quality. Although the concepts are related, they should not be used interchangeably.” Despite this warning, the trophic system of classification,
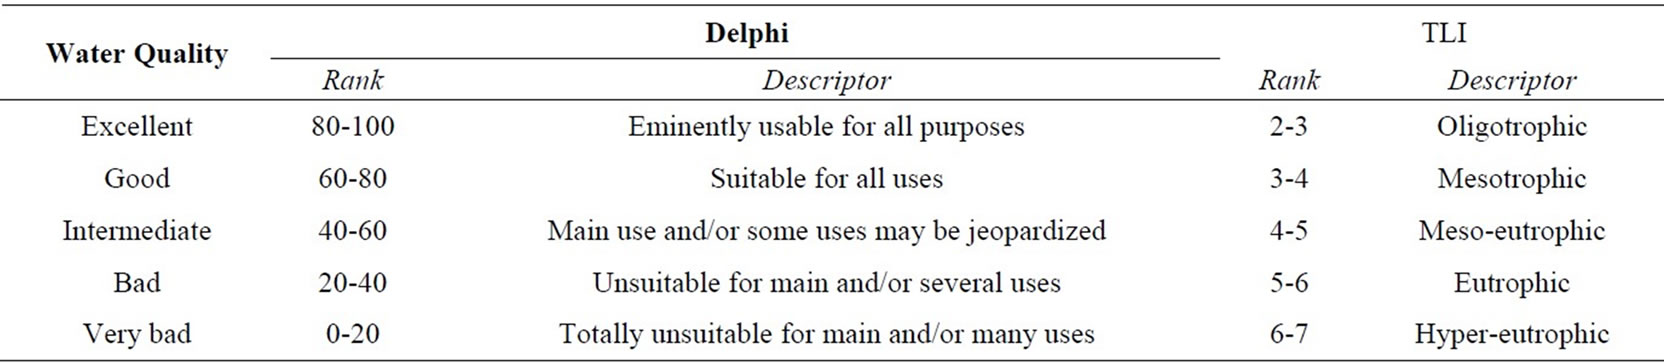
Table 2. WQ ranks in Delphi and TLI-system (modified from (4) and (14)).
under various forms, is widely used as a system of water quality [4-6,17,18].
Freshwater ecosystems are the objects of intense multipurpose use [29]. The use of the water resource in question is key to the DM (Table 2). In this study, we assumed that the objective of sustainable water resources management is conservation of the lake ecosystem in some predefined, “reference”, state (3). The TLI approach does not consider the intended use (Table 2), and, therefore, the system of WQ indices assessed with this approach tends to be absolute, independent of the uses of the water resource in question, and associated hydroecological problems, Presumably, implementations of the TLI are based on an indirect assumption that eutrophication (caused by excessive entry of nitrogen and phosphorus) is the main hydroecological threat to waterbodies under WQ assessment. This is the underlying distinction between the DM and TLI as regards to WQ quantification, clearly illustrated in Figures 1 and 2. The respective rating curves of almost all WQIs in the DM are bell-shaped curves (Figure 1). As a consequence, the ecological values of parameters such as S, Chl, TN and TP should be sustained within limits, (permissible ranges, (8)); excessive increase and decrease of the respective variables should be ranked as WQ deterioration. Therefore, the WQ sets assessed with the Delphi method are more suitable for the needs of sustainable water resources management. Note that differences between permissible ranges assessed with the TLI and Delphi tend to increase with the lake trophic status, especially for Chl (Figure 2). In the TLI, the rating value is a monotone function of the concentration of Chl, TN and TP and S (1). It should be noted however, that monotone rating curves are possible also in the DM, usually assessed for pollutants (e.g., E. coli in the Rototua Lakes) or cyanobacteria (%Cyano) in L. Kinneret. However, in some cases, assessment of the monotone rating curves for basic ecosystem parameters may lead to paradoxical results resembling those based on the TLI. According to the monotone rating curves for TN and TP assessed with the TLI for transitional Mediterranean waters [6], the best WQ should correspond to TN, TP and Chl concentrations close to zero (Figure 1 in [6]). This means that complete distrophication of transient water ecosystems is considered, at least formally, as WQ improvement. This, basic, distinction, is a direct reason for the discrepancies among the relationships between aggregated WQ and management measures. The differences in estimates of the permissible Pload values for L. Kinneret (Figure 5) have obvious consequences when translating them to management objectives and measures: the DM allows more intense economic activity in the lake watershed (expressed in terms of Pload), than possible according to the TLI, without unacceptable damage to the lake WQ. The discrepancies between the water level lowering effects on aggregated WQ have a significant impact on the entire process of decision-making in practical water resources management: acceptance of the TLI approach would mean that water level lowering of Lake Kinneret below −214.0 m does not affect lake WQ. In contrast to this, the DM indicates that the lake water level lowering below −213.0 m leads to unacceptable WQ deterioration (Figure 6). Similarly to WQ sets, we may conclude that the permissible ranges for management measures assessed with the DM better correspond to contributions of the sustainable water resources management. Respective “threshold” values of the management measures assessed with the TLI (or similar) approach are more suitable for the needs of a management which main objective is preventing of undesirable hydroecological consequences of the anthropogenic effects (e.g., eutrophication) without accounting for the needs of water resource management.
Comparison of the aggregated WQ dynamics obtained with the TLI and DM shows that the simplest average estimates (as R[DM] and R[TLI]) may lead to contrasting values of lake WQ (Figure 3). In some cases, a WQ system based on the TLI is not suitable for diagnostics of the eutrophication processes. The TLI approach does not indicate WQ deterioration (as shown by the CWQI dynamics, Figure 4) associated with the in-lake processes usually considered as signs of eutrophication: disruptions of the phosphorus and oxygen regimes in hypolimnetic water (L. Stechlin) and an increase in cyanobacteria abundance (L. Kinneret).
Decades of struggle against eutrophication have been expressed in the form of a paradigm linking between lake trophic status and water quality. This misconception can result in a direct threat to the ecosystems of naturally eutrophic waterbodies, while producing a misleading understanding of the possibility of managing water quality based only on regulating activities according to the lake’s trophic state. Accounting for the eutrophication problem only, and neglecting of requirements for water resources management prevents the trophic classification system from serving as a “common language” for communication between partners in management
5. Conclusions
In this study, we evaluated the suitability of the different water quality systems for the needs of sustainable water resources management. We compared two approaches used for quantitative assessment of water quality in natural waterbodies: the trophic level index and the Delphi method.
Comparative analysis of the assessed water quality systems allows us to draw the following conclusions:
1) The basic distinction between the Delphi and Trophic Level based approaches to quantification of water quality lies in the form of correspondence between the ecological and rating/trophic index values of the water quality index. In the trophic based system, the rating value is a strictly decreasing function of the concentration of Chl, TN and TP (increasing function of S). The respective rating curves of almost all water quality indices in the Delphi method account for the needs of sustainable management. Therefore they are bell-shaped curves, i.e., the ecological values of such parameters as S, Chl, TN and TP should be sustained within limits (permissible ranges) that otherwise could result in WQ deterioration. In the trophic state based system, the acceptable limits for all water quality indices are one-sided and are taken by default to be applicable to all lakes. The Delphi method gives a two-sided, lake-specific limit within which sustainable water resources management will be possible.
2) The aggregated estimates of WQ with the Delphi and TLI approaches give comparable estimates for oligoto mesotrophic lakes only. The differences between the two approaches increase with lake trophic state: the trophic status based system always valuate WQ in eutrophic lakes as “bad”, independently on water resource uses.
3) The trophic state based system is a classification system, and therefore its implementation does not account for specific characteristics of aquatic ecosystems and the array of different potential uses as a water resource. The trophic state based system assumes reduction of economic activities in catchment areas as the most expedient mean to improve water quality. Therefore, water quality systems assessed with the trophic state based system are more suitable for needs of natural water resources management if eutrophication is a major threat. The Delphi method allows accounting for several water resource uses and therefore it may serve as a more robust and comprehensive tool for WQ quantification.
6. Acknowledgements
The authors thank the anonymous Reviewer whose comments improved the manuscript. We also thank Prof. P. Nöges for a valuable discussion which significantly improved this manuscript and Mrs M. Fridman for valuable help in editing of the manuscript. This research was supported by grants from the Ministry of Science and Technology Israel, and the Federal Ministry of Education and Research, Germany (BMBF), and the New Zealand Foundation of Research, Science and Technology (Contract UOWX0505) and Environment Bay of Plenty.
REFERENCES
- R. G. Wetzel, “Limnology Lake and River Ecosystems,” 3rd Edition, Academic Press, San Diego, 2001.
- R. E. Carlson, “A Trophic State Index for Lakes,” Limnology and Oceanography, Vol. 22, No. 2, 1977, pp. 361- 369.
- OECD, “Eutrophication of Waters,” Monitoring, Assessment and Control, Paris, 1982.
- N. Burns, J. McIntosh and P. Scholes, “Strategies for Managing the Lakes of the Rotorua District, New Zealand,” Lake and Reservoir Management, Vol. 21, No. 11, 2005, pp. 61-72.
- C. Kaiblinger, O. Anneville, R. Tadonleke, et al., “Central European Water Quality Indices Applied to LongTerm Data from Pre-Alpine Lakes: Test and Possible Improvements,” Hydrobiologia, Vol. 633, No. 1, 2009, pp. 67-74.
- G. Giordani, J. M. Zaldivar and P. Viaroli, “Simple Tools for Assessing Water Quality and Trophic Status in Transitional Water Ecosystems,” Ecological Indicators, Vol. 9, No. 5, 2009, pp. 982-991.
- S. E. Jorgensen and R. A. Vollenweider, “General introduction,” In: S. E. Jorgensen and R. A. Vollenweider, Eds., Guidelines of Lake Management, International Lake Environment Committee, Shiga, Vol. 1, 1989, pp. 13-18.
- R. K. Horton, “An Index-Number System for Rating Water Quality,” Journal of Water Pollution Control Federation, Vol. 37, No. 3, 1965, pp. 300-306.
- W. Ott, “Water Quality Indices: A Survey of Indices Used in the United States,” Environmental Monitoring Series, EPA-600/4-78-005, 1978, p. 128.
- P. M. Brown, N. I. McClelland, R. A. Deninger and R. G. Tozer, “A Water Quality Index - Do We Dare?” Water Sewage World, 1970, pp. 339-343.
- A. Parparov and K. D. Hambright, “Composite Water Quality: Evaluation and Management Feedbacks,” Water Quality Research Journal of Canada, Vol. 42, No. 1, 2007, pp. 20-25.
- C. G. Cude, “Oregon Water Quality Index: A Tool for Evaluating Water Quality Management Effectiveness,” Journal of American Water Research Association, Vol. 37, No. 1, 2001, pp. 125-137.
- M. A. House, “Water Quality Indices as Indicators of Ecosystem Change,” Environmental Monitoring and Assessment, Vol. 15, 1990, pp. 255-263.
- D. G. Smith, “A Better Water Quality Indexing System for Rivers and Streams,” Water Research, Vol. 24, No. 10, 1990, pp. 1237-1244.
- A. Parparov, K. D. Hambright, L. Hakanson and A. P. Ostapenia, “Water Quality Quantification: Basics and Implementation,” Hydrobiologia, Vol. 560, No. 1, 2006, pp. 227-237.
- K. D. Hambright, A. Parparov and T. Berman, “Indices of Water Quality for Sustainable Management and Conservation of an Arid Region Lake, L. Kinneret (Sea of Galilee), Kinneret,” Aquatic Conservation: Marine and Freshwater Ecosystems, Vol. 10, No. 6, 2000, pp. 393- 406.
- USGS, “Water-Quality and Lake-Stage Data for Wisconsin Lakes, Water Year 2000,” U.S. Geological Survey, Open-File Report 01-86, Middleton, Wisconsin, 2001, p. 128.
- U. S. Environmental Protection Agency, “An Approach to a Relative Trophic Index System for Classifying Lakes and Reservoirs,” National Eutrophication Survey, Working Paper No. 24, 1974.
- P. Scholes and M. Bloxham, “Rotorua Lakes Water Quality 2006 Report. Environmental Bay of Plenty,” Environmental Publication 2007/12, Whakatane, New Zealand, 2006, p. 86.
- C. Serruya, Ed., “Lake Kinneret,” Dr. Junk Publishers, The Hague, 1978.
- T. Zohary, “Changes to the Phytoplankton Assemblage of L. Kinneret after Decades of a Predictable, Repetitive Pattern,” Freshwater Biology, Vol. 49, No. 10, 2004, pp. 1355-1371.
- G. G. Winberg, Ed., “The Ecological System of the Naroch Lakes,” Universitetskoye Press, Minsk, 1985.
- R. Koschel and D. D. Adams, “An Approach to Understanding a Temperate Oligotrophic Lowland Lake (Lake Stechlin, Germany),” Archiv fur Hydrobiologie, Special Issues Advanced Limnology, Vol. 58, 2003, pp. 1-9.
- T. Gonsiorczyk, P. Casper and R. Koschel, “Long-Term Development of the Phosphorus Accumulation and Oxygen-Consumption in the Hypolimnion of Oligotrophic Lake Stechlin and Seasonal Variations in the Pore Water Chemistry of the Profundal Sediments,” Archiv fur Hydrobiologie, Special Issues Advanced Limnology, Vol. 58, 2003, pp. 73-86.
- R. A. Vollenweider, “Advances in Defining Critical Loading Levels for Phosphorus in Lake Eutrophication,” Memorie dell’ Istituto Italiano di Idrobiologia, Vol. 33, 1976, pp. 53-83.
- D. W. Schindler, “Evolution of Phosphorus Limitation in Lakes,” Science, Vol. 195, No. 4275, 1977, pp. 260-262.
- K. H. Rekhow, “Empirical Lake Models for Phosphorus: Development, Applications, Limitations and Uncertainty,” In: D. Scavia and A. Robertson, Eds., Perspectives on Lake Ecosystem Modeling, Ann Arbor Sciences, Ann Arbor, 1979, pp. 193-121.
- R. E. Carlson and J. Simpson, “A Coordinator’s Guide to Volunteer Lake Monitoring Methods,” North American Lake Management Society, Oklahoma, 1996.
- “Directive 2000/60/EC of the European Parliament and of the Council of 23 October 2000 Establishing a Framework for Community Action in the Field of Water Policy,” Official Journal of the European Communities.
- Y. Z. Yacobi, “Temporal and Vertical Variation of Chlorophyll a Concentration, Phytoplankton Photosynthetic Activity and Light Attenuation in Lake Kinneret: Possibilities and Limitations for Simulation by Remote Sensing,” Journal of Plankton Research, Vol. 28, No. 8, 2006, pp. 725-736.
- W. F. Vincent, M. M. Gibbs and S. J. Dryden, “Accelerated Eutrophication in a New Zealand Lake: Lake Rotoiti, New Zealand,” New Zealand Journal of Marine and Freshwater Research, Vol. 18, 1984, pp. 431-440.
- N. M. Burns, J. Deely, J. Hall and K. Safi, “Comparing Past and Present Trophic States of Seven Central Volcanic Plateau Lakes, New Zealand,” New Zealand Journal of Marine and Freshwater Research, Vol. 31, No. 1, 1997, pp. 71-87.