Journal of Water Resource and Protection
Vol. 2 No. 7 (2010) , Article ID: 2257 , 8 pages DOI:10.4236/jwarp.2010.27078
Prioritizing Riparian Corridors for Water Quality Protection in Urbanizing Watersheds
1Institute of Applied Science, University of North Texas, Denton, USA
2Halff Associates, Inc, Richardson, USA
E-mail: atkinson@unt.edu
Received February 11, 2010; revised May 18, 2010; accepted May 21, 2010
Keywords: Watershed Management Planning, GIS Modeling, Remote Sensing, Riparian Assessment, Riparian Preservation and Restoration, WQCM Model
ABSTRACT
The cumulative effects of urbanization on riparian corridors can decrease the quality of water entering local streams, and ultimately adversely impact drinking water reservoirs of local municipalities. As such, a GIS and remote sensing based analysis tool called the Water Quality Corridor Management (WQCM) model was designed to identify and prioritize highly functioning riparian ecosystems for the preservation of stream corridor conditions. Preservation priority among various riparian corridors is established in the model by analyzing five parameters associated with stream corridor conditions (vegetation type, erosion potential, surface slope, percent of the stream contained within the Federal Emergency Management Agency (FEMA) 100-year floodplain, and amount of the stream corridor contained within a subwatershed); and each parameter is weighted and scaled based on what conditions are most important to protect. Because data associated with each parameter are readily available and easily manipulated via spatial analysis techniques, the WQCM model functions as a flexible methodology for predicting stream corridor conditions and allows watershed managers to identify potential preservation opportunities to ensure long term ecological functioning that protects water quality. These corridors can then also provide urban planners with potential natural spaces for urban dwellers, meeting multiple benefits requirements imposed by many municipalities.
1. Introduction
In scientific parlance the term riparian refers to biotic communities on the shores of streams and lakes. Ecologists have long studied riparian corridors as ecosystems of forested and/or vegetative buffers that link aquatic and terrestrial environments [1]. Those studies show that healthy riparian stream corridors perform a multitude of valuable tasks for their adjacent waterways, including their overall influence on water quality [2], biological diversity [3], ecosystem maintenance [4] and protection of intermittent streams and the residual pools that they provide as refuges for multiple species during dry periods [5]. Nutrient cycling, contaminant filtration, water purification, bank stabilization, stream temperature maintenance, flow stabilization, flood attenuation, and habitat preservation are some of the numerous functions carried out by riparian zones [6].
1.1. Effects of Urbanization
Urbanization and its subsequent activities, without proper planning, often leads to the degradation of streams and their corridors. Such degradation inhibits the natural cycles of biological and physical activities normally carried out within riparian ecosystems [7], and also cause social and economic problems at regional and local levels. For example, Withers and Jarvie [2] state that the problems can influence human health (algal toxins), species abundance and diversity, amenity value and costs of water treatment for drinking. Streams and rivers on the periphery of urbanizing areas are particularly vulnerable due to population centers, sensitivity to land use change and ubiquitous exploitation [8]. Furthermore, many of those aquatic systems at the urban periphery are already experiencing agricultural practices, such as grazing and the direct access of cattle to streams. This has resulted in increased erosion of stream banks due to trampling, as well as direct deposition and indirect flow of animal waste into waterways, a principal component of nonpointsource pollution [9]. An EPA National Water Quality Inventory [10] assessing 19% of the waterways in the United States found pathogens in over 93,000 miles of streams and rivers. Ultimately, the dynamic equilibrium of stream ecosystems is altered by the cumulative effects of channelization, clear-cutting, illegal dumping, and increased chemical usage, all consequences of urbanization surrounding riparian corridors.
Many places throughout the world are experiencing the same pattern of land use change that can be seen in north central Texas, the site of this study. Former “rural” areas are becoming a part of an ever increasing urban landscape. As residential developments, commercial properties, and industrial facilities proliferate, they cover the natural landscape with roads, buildings, parking lots, and other impervious surfaces [6]. Stream health is directly linked to urbanization, the effects of which simultaneously decrease bank stability and increase pollutant presence and transfer. Healthy riparian buffer zones have been shown to filter out up to 97% of soil sediment prior to stream entrance [11]. However, removing trees in riparian zones is often one of the first activities associated with urban and suburban development, leading to increased soil erosion. Increased erosivity results in a decrease in the depth of fertile topsoil and an increase of sediment within streams. These sediments often contain contaminants such as metals, pesticides such as DDT, other organics such as polychlorinated biphenyls (PCBs) and polycyclic aromatic hydrocarbons (PAHs), and other synthetic chemicals that may be toxic to aquatic and terrestrial plant and animal species and are linked to human health via the food chain [12].
1.2. Riparian Corridor Preservation Versus Restoration
While a stream’s ecosystem functions and water quality are directly related to the condition of riparian corridors, the quality of the services provided by the corridors are not completely obvious to the untrained eye. Therefore, a number of methods have been developed which allow ecologists to measure various physical/chemical/biological parameters in the field, and convert those measurements into a score that represents riparian quality. In fact the National Research Council [6] recommend that stream corridor assessment and management strategies need to be available not only to ecologists wanting to understand stream ecosystems, but to the landowners and developers who have riparian corridors on their properties. With ever increasing development pressures, the protection of riparian corridors should be seen as a critical management goal for the sustainability of stream ecosystems and the safeguarding of water quality entering drinking water reservoirs. As a result, and the principle topic of this communication, a geographic information system (GIS) model is proposed that classifies stream segments and their adjoining riparian corridors on a scale that allows for the identification of those stream segments that are highly functioning in terms of protecting water quality so that they can be placed at the front of the “preservation” line.
We point out that the proposed model ranks stream segments in terms of the importance of preserving them for water quality purposes as opposed to ranking them for restoration purposes. Ecological restoration in this context involves re-establishing the biological and physical system among streams that have been disrupted from human activities such as urbanizing development [13]. Restoring a complicated network of biotic interactions is tedious, requires a detailed knowledge base, is a potentially-expensive endeavor for any entity, whether private, government, or academic, and is often unsuccessfully implemented [14]. A viable alternative to the restoration of degraded stream systems is the protection and preservation of waterways and their surrounding corridors. The maintenance of healthy riparian ecosystems not only provides example environments by which restoration practices can be modeled, but is also a more economical alternative when funding is limited and efforts need to be focused on less intensive approaches [15].
1.3. Objectives of Study
It is the ultimate goal of preservation strategies to curtail the loss of valuable resources. Protection strategies provide the solid foundation by which more politically and environmentally complicated restoration efforts can evolve over time. The objective of our efforts was to produce a GIS model that can establish the underpinning for the portion of a watershed management plan that protects water quality in the headwater streams of drinking water reservoirs. The goal is to be able to identify and prioritize stream corridors based on existing watershed data that are easily accessible. Fortunately, this leads to a secondary goal because protecting stream corridors under the goal of drinking water protection, also results in protecting other services that riparian corridors provide such as habitat protection, nutrient cycling and recreational opportunities are also protected.
2. Materials and Methods
GIS and remote sensing have modernized the monitoring and implementation of best management practices for the protection of stream ecosystems. Such techniques allow for the manipulation of large and complex datasets, while providing easy access to data retrieval. In addition, complex interactions can be evaluated through the GIS layering of various data montages, such as land use classifications via remote sensing and satellite images, feature files, and raster datasets. GIS technology also allows for simplified data sharing, making it logistically easier and more cost-effective to employ interdisciplinary teams working towards the goal of environmental sustainability [16].
We propose a GIS and remote sensing based model, the Water Quality Corridor Management (WQCM) model, designed to (1) utilize easily accessible data for the purpose of identifying and assessing potential water quality issues and (2) to classify stream segments in order of priority for preservation as a component of an overall watershed management plan.
2.1. GIS Materials
To establish the relative priority of stream reaches, five variables were chosen based on their availability and capacity for manipulation within spatial analysis software, as well as their ability to predict current riparian conditions (Table 1). These variables include vegetation type, erosion potential, surface slope, percent of the stream contained within the Federal Emergency Management Agency (FEMA) 100-year floodplain, and amount of the stream corridor contained within the subwatershed. Each of the five variables consists of an importance weight and a scaling function. Importance weights and scaling functions assigned to each model variable range from 0 to 5, with 5 indicating a greater need for protection. For example, vegetation class is considered the most important variable in the model, receiving 5 importance points, and the scaling function for vegetation indicates that forested areas within the riparian buffer receive 5 points while residential areas within the riparian buffer receive 2 points. Each variable’s scaling function is based on the same concept: what conditions are more important to protect via preservation. Table 2 through 6 provides the functional scales for each variable [16].
2.2. The WQCM Model
WQCM scores are calculated for each subwatershed based on watershed characteristics for each of the five variables considered by the model. Values are calculated for each stream segment in a study area, generating an overall WQCM score for the stream segment that defines each subwatershed. Based on the WQCM scores, we suggest that each stream segment be grouped into one of four preservation priority quartiles: low, moderate, high, and highest priority. The WQCM model produces a score that can range from 0 to 50, with the highest scores assigned to the highest preservation priority category and indicating the greater need for protection of a stream corridor under future development. The underpinning model is presented in Equation (1) :
WQCM Score = ViVf + EiEf + SiSf + FiFf + CiCf (1)
where the subscripts “i” and “f” represent “importance” (Table 1) and “functional scale” (Tables 2-6).
The Dallas-Fort Worth, Texas region currently contains a population of more than 6.6 million people, and has experienced an average growth of about 150,000 people per year over the past decade, resulting in more than 500,000 new housing units built over that time [18]. The North Central Texas Council of Goverments currently predicts that the regional population in 2030 will exceed 9 million people. This rapid rate of urbanization has raised concerns about water supply, and the need to protect the quality of water entering the region’s drinking water reservoirs. WQCM was developed specifically for this type of planning need. WQCM was applied to two different study areas in north central Texas of different sizes: 60,300 hectares (149,000 acres) with 133 subwatersheds; and 240,000 hectares (593,000 acres) with 90 subwatersheds that drain to one of the region’s large drinking water reservoirs [16]. The smaller area was examined first, and was considered a pilot project to test the applicability and verify the relationship between the newly developed GIS/remote sensing models to a more traditional field-based assessment tool.
3. Results
3.1. Validating WQCM
The field-based tool developed by the U.S. Department of Agriculture [17] to quantitatively score the physical conditions of aquatic ecosystems was chosen to validate the WQCM model. The technique, known as the Stream
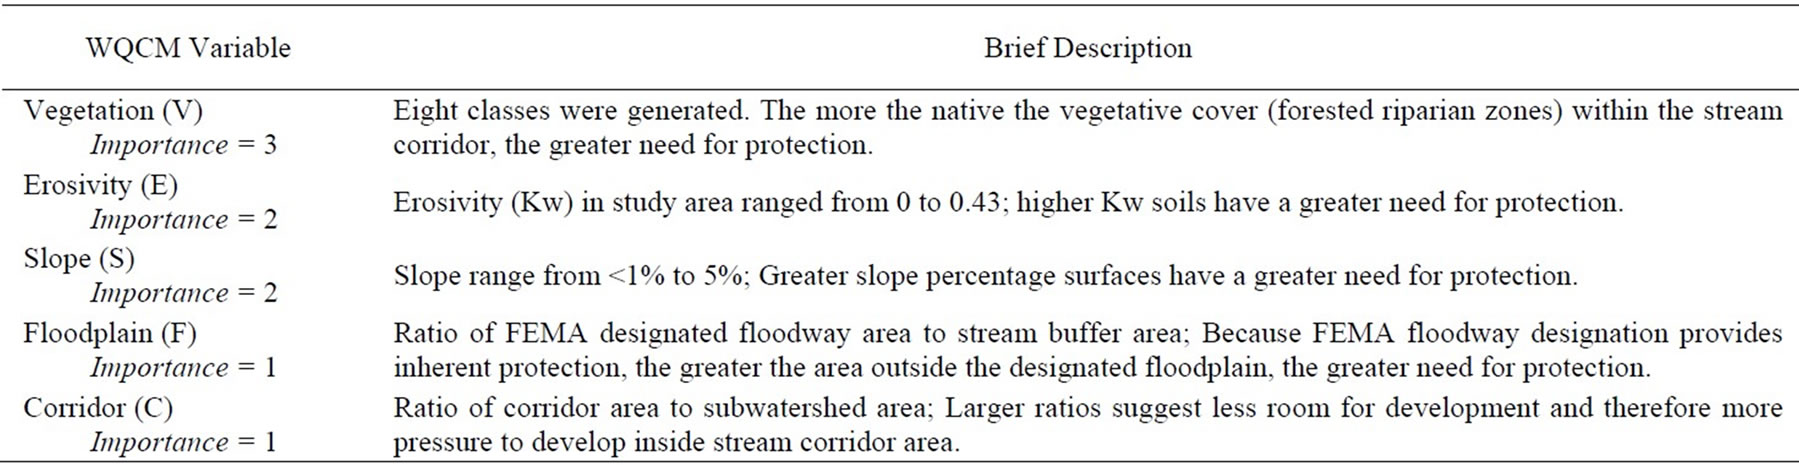
Table 1. Variables included in the WQCM model.
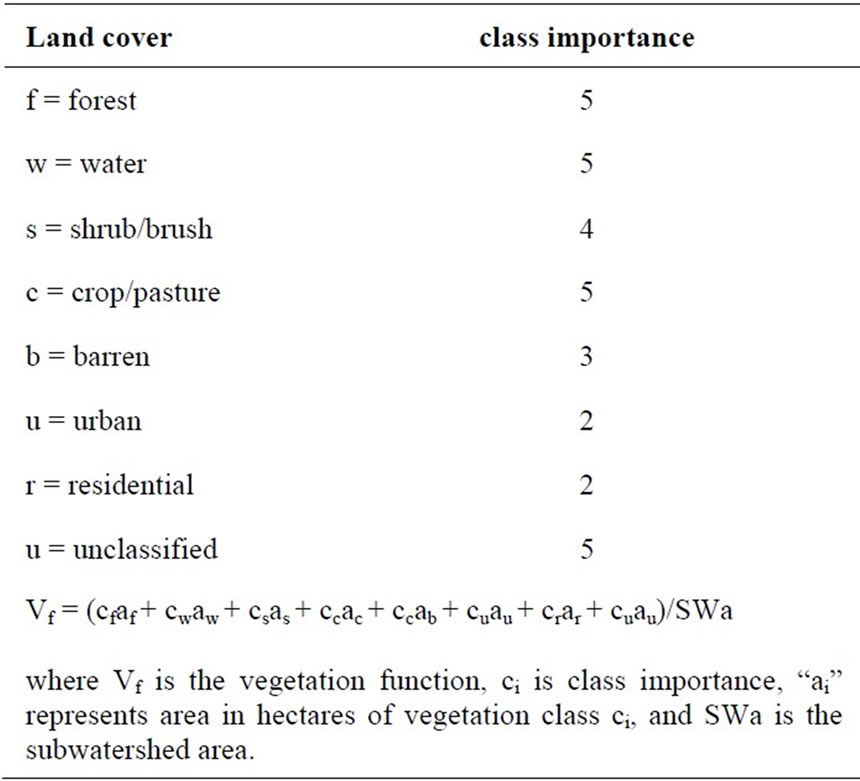
Table 2. Vegetation classes, class importance and functional scores.
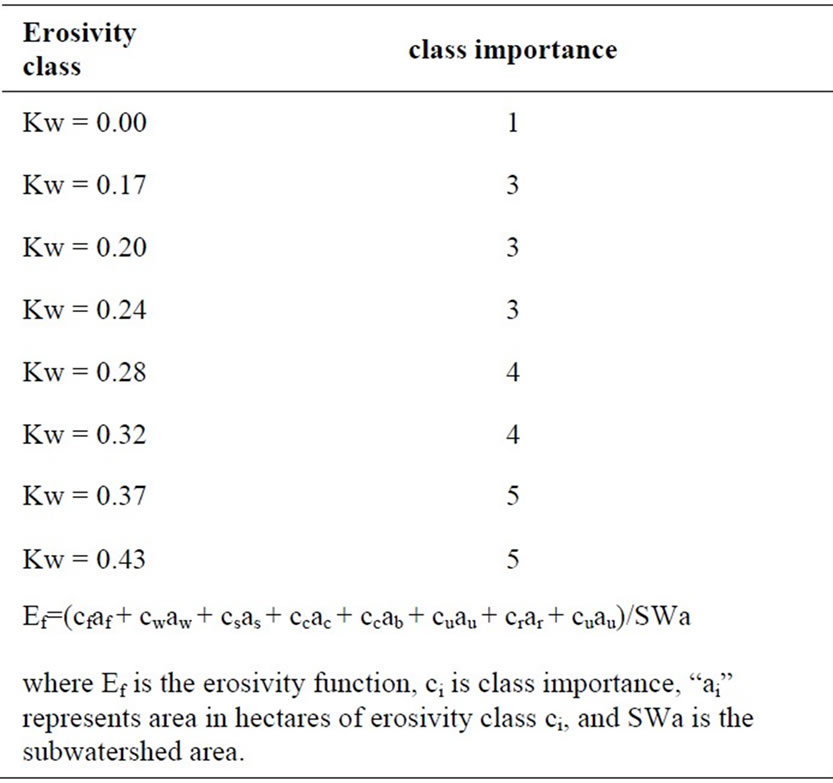
Table 3. Erosivity classes, class importance and functional scores.
Visual Assessment Protocol (SVAP), is similar to the WQCM in that multiple variables are measured for each stream segment, and each measurement is scored by a functional scaling relationship. Like WQCM, higher SVAP scores indicate higher quality (and by extension a higher priority for preservation). This similarity allows the two very different approaches for evaluating aquatic ecosystems (field measurements versus GIS/remote sensing modeling) to be compared. Of the 133 subwatersheds developed for the WQCM pilot project, 10 subwatersheds from each of the 4 priority quartiles were randomly selected for SVAP assessment. For these 40 subwatersheds, a Spearman-rank correlation coefficient
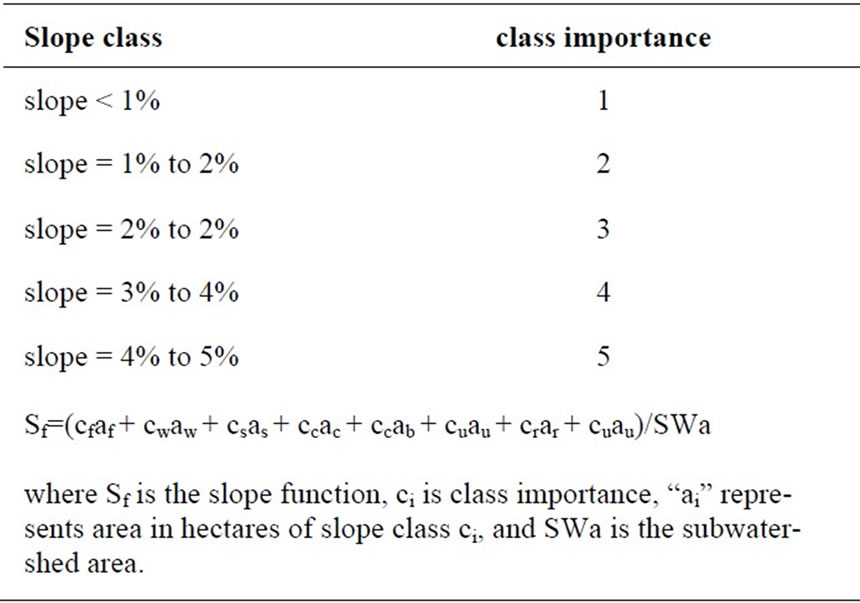
Table 4. Slope classes, class importance and functional scores.
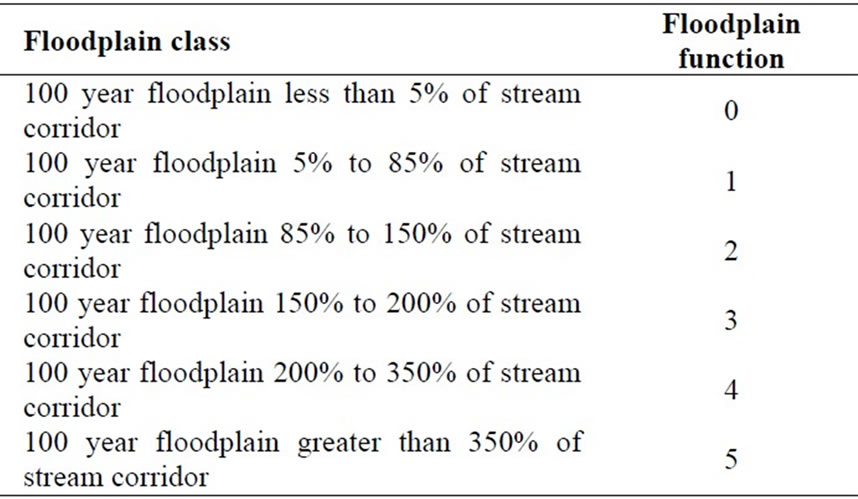
Table 5. Floodplain classes, class importance and functional scores.
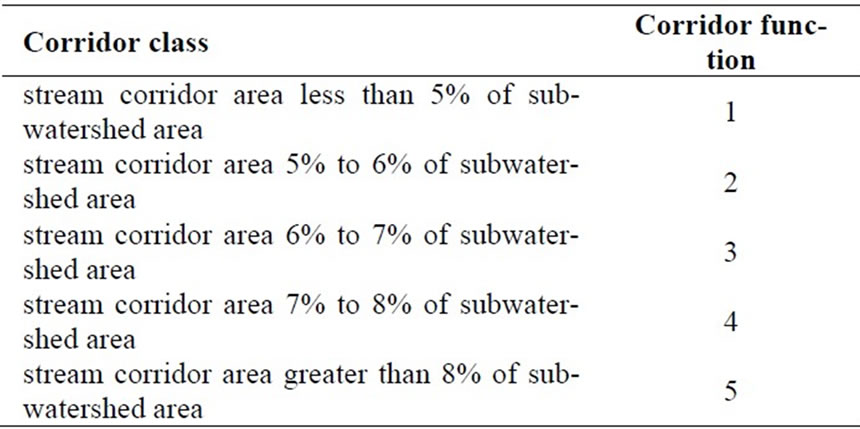
Table 6. Corridor classes, class importance and functional scores.
indicates a highly significant positive relationship between the two approaches (p < 0.0001), albeit a relatively low correlation coefficient (rs = 0.58). We suggest that the relatively low correlation coefficient may in part be due to the different purposes for which SVAP and WQCM were prepared: SVAP was designed to rate a “stream’s health” [19], while WQCM was designed to rate a stream corridor’s potential for continuing to deliver high quality water to a drinking water reservoir. None-the less, both provide a measure of a stream’s ecological quality, but the ease of applying WQCM over SVAP, and the relationship shown in Figure 1, offers an adequate level of justification for proposing the use of WQCM.
3.2. Applying WQCM in North Central Texas
In an early paper that addressed how riparian corridors were linked to water quality [1] it was pointed out that that in undisturbed watersheds, biological communities and water quality are in dynamic equilibrium. Under normal rainfall events, there is relatively little surface runoff because the rain is adsorbed by the land and vegetation, and few nutrients are lost to drainage waters. When the vegetation is removed, instabilities in the terrestrial environment are inevitable, which in turn alter the water quality equilibrium of natural states. Urbanization often includes attempts to improve drainage of the land’s surface by modifying stream channels (straightening and bank stabilization), the combined effects of which result in disequilibrium in both biological and water quality systems. We suggest that preservation of well functioning riparian corridors will result in the most economic way to protect water quality. Further, a prioritized list of riparian corridors will allow urban planners and developers alike to become part of a water quality protection strategy for their community.
The WQCM model was applied to each subwatershed in our two study areas, and a final WQCM score was calculated and a corresponding WQCM priority quartile (low, moderate, high, or highest) was designated for each stream corridor within each of the 133 subwatersheds of the pilot study area and 90 subwatersheds of the Lewisville Lake watershed. Figure 2 represents the summary type of output that WQCM generates that can allow watershed managers to visualize where stream corridor preservation activities will be most beneficial across a moderately large watershed. Figure 3 illustrates the detail that can be provided for stream corridors in specific subwatersheds. Figure 3 highlights two subwatersheds, one with a low WQCM score and one with a high score, draped over a satellite image. The upper of the two subwatersheds contains a “high priority” corridor (WQCM rating = 35.1), and it can be clearly seen that this subwatershed has very little urbanization and the lower reaches of the stream corridor offers ample tree canopy resulting in high preservation priority. The adjacent lower subwatershed, however, is highly urbanized and much of the tree canopy cover along the stream corridor has been removed. This corridor is beyond preservation, and would need restoration, resulting in a “low priority” rating (WQCM rating = 26.4). A valuable aspect of the WQCM model is that landuse, soil erosivity, surface slope and floodplain data are also available for each corridor, allowing a watershed manager to glean insight as to why a particular corridor should be preserved.
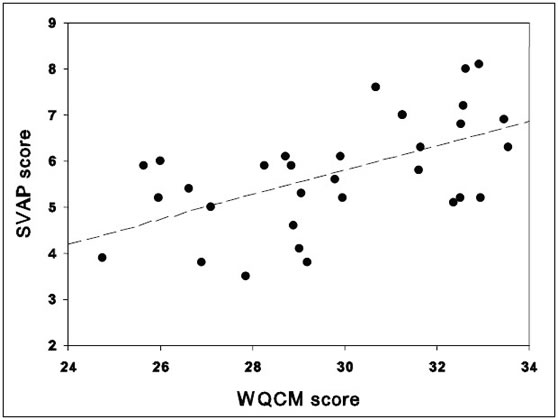
Figure 1. Relationship between proposed Water Quality Corridor Management (WQCM) model and the U.S. Department of Agriculture’s Stream Visual Assessment Protocol (SVAP) for 40 subwatersheds (r = 0.58, p < 0.0001).
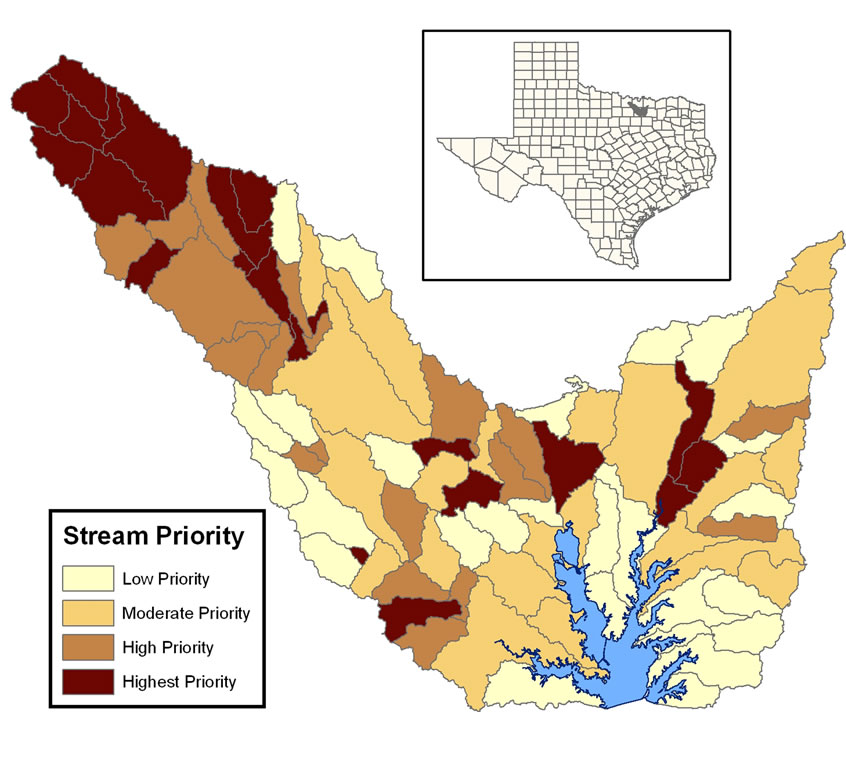
Figure 2. Stream corridor preservation priority based upon WQCM scores. Red is highest priority, light yellow is lowest priority (Study area is approximately 80 kilometers (50 miles) by 70 kilometers (43 miles) in dimensions). Lewisville Lake, at the bottom of the watershed, is one of several major sources of drinking water for the Dallas-Fort Worth region.
4. Concluding Remarks
The results of WQCM showed that subwatersheds that had little urbanizing development tended to have vegetated riparian corridors (the most important factor in the model), with varying degrees of slope, erosivity and FEMA floodplain protection. These combinations typically lead to preservation priority scores in the upper half of the subwatershed scores. The highest rated stream corridors were found to have high habitat quality along the stream banks, and had a general appearance of providing many ecosystem services (see Figure 4 for an example). On the other hand, the subwatershed with the highest levels of urbanizing development tended to have little vegetation in the riparian corridors, and no matter what levels of the other parameters were contained within those subwatersheds, they rarely scored in the upper half of the preservation priority (see Figure 5 for an example). These findings quickly lead us to realize that the same data set, with different importance weights and scaling functions, can lead to a second model that prioritizes watersheds based on restoration goals. A restoration prioritization model is now under development.
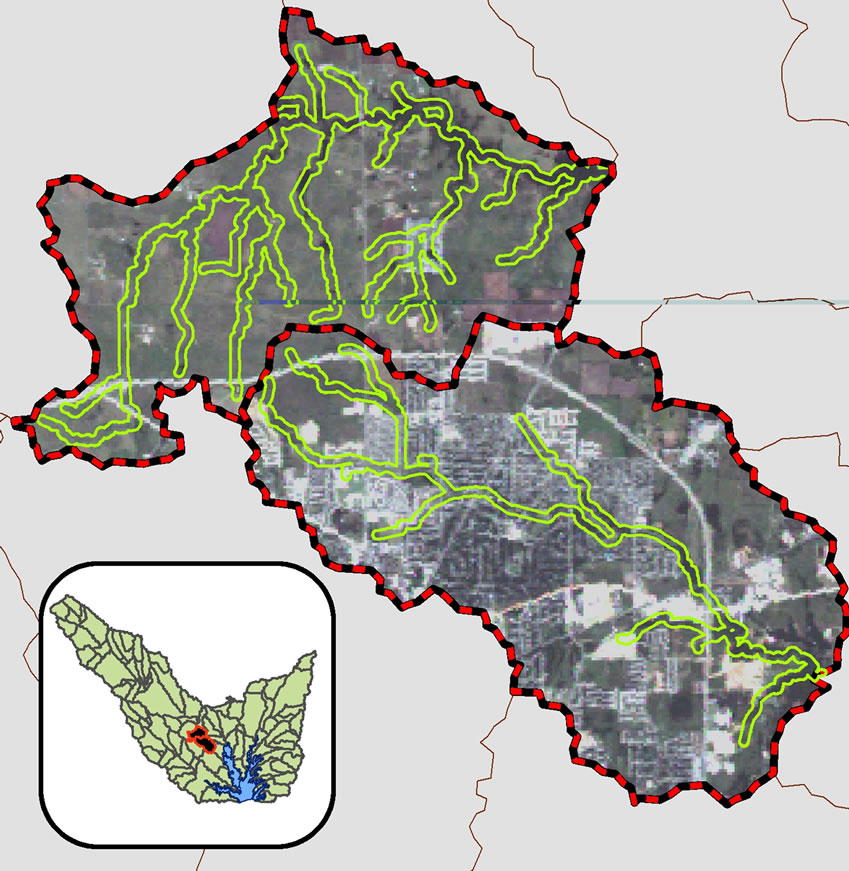
Figure 3. WQCM results for a “high priority” stream corridor (upper subwatershed: WQCM = 35.6), and an adjacent “low priority” stream corridor (lower subwatershed: WQCM = 26.4).
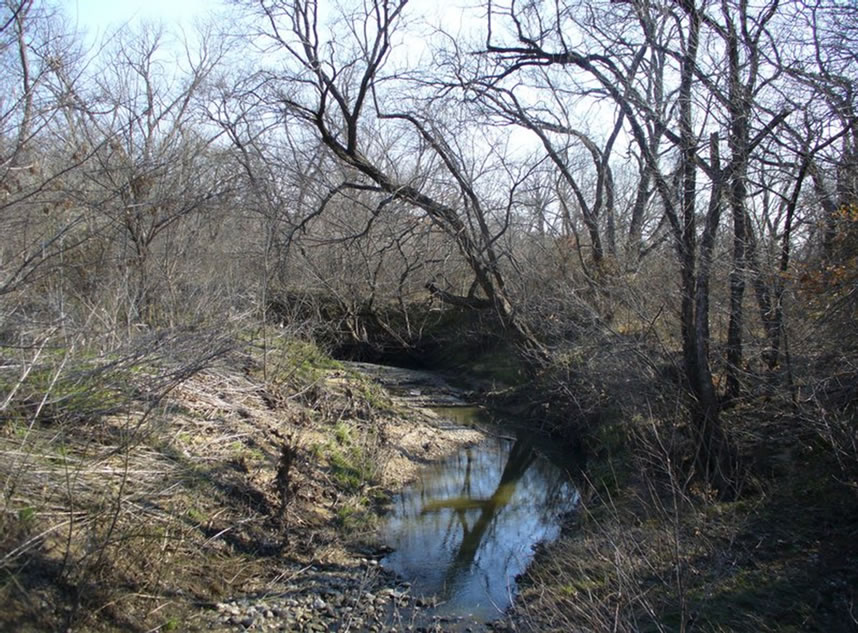
Figure 4. Field site #28, example of site designated as WQCM highest priority quartile.
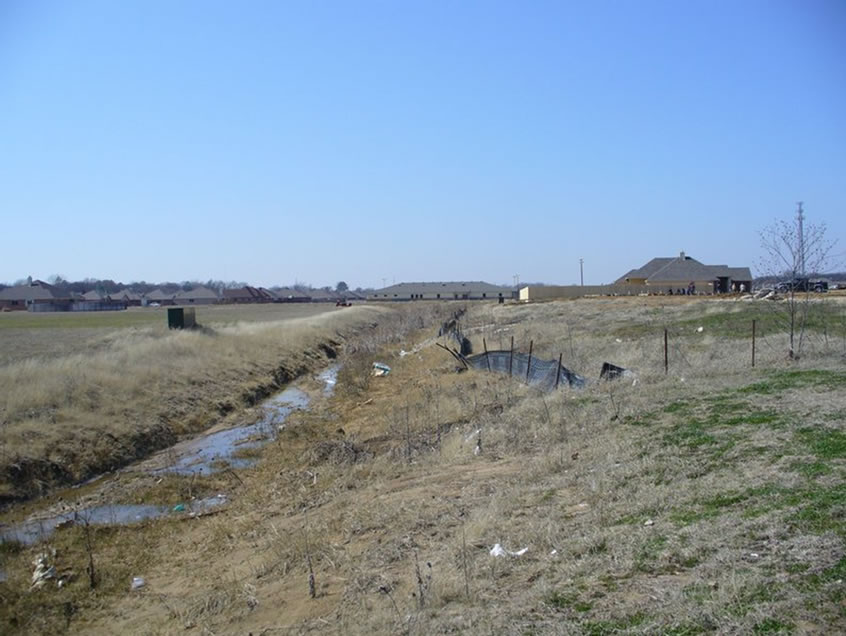
Figure 5. Field site #34, example of site designated as WQCM lowest priority quartile.
A comparison analysis of the five WQCM model components, applied to both the pilot study region and the Lewisville Lake watershed, showed that the parameters most likely to influence the WQCM model’s scores were vegetation, followed by the erosivity and floodplain components. The slope and corridor parameters were not driving factors for any of the WQCM model’s scores within either of the studies. These findings were as expected, since the importance weight given to the vegetation component of the WQCM model (5) is higher than the weight assigned to any of the other four components. Furthermore, the vegetation, erosivity, and floodplain components were the predominant parameters influencing the WQCM scores even without including the corresponding importance weights. Due to these consistent comparison results, the pairing of protection strategies will be discussed for the three primary driving WQCM components of vegetation/land use type, the bank stability parameter of erosivity, and the floodplain component.
In relation to vegetation/land use type, the encroachment of suburban communities and commercial developments factors prominently into the degradation of stream ecosystems. In fact, the primary source of sediment runoff originates from the vast number of construction sites so commonly found among developing areas. Accordingly, simple protective measures need to be enforced at all construction zones. For example, the cessation of vegetation clear-cutting around construction sites leaves buffer zones intact and able to entrap harmful nonpoint source pollutants before they enter stream systems [14]. Furthermore, negligent lawn care and waste disposal habits throughout residential communities necessitates better management practices, such as using organic compost to treat lawns instead of the synthetic chemicals found in fertilizers and pesticides that are easily carried into streams during rainfall events (EPA Measure 9, 2005). Stream bank erosion, vegetation trampling, and the presence of manure are just a few of
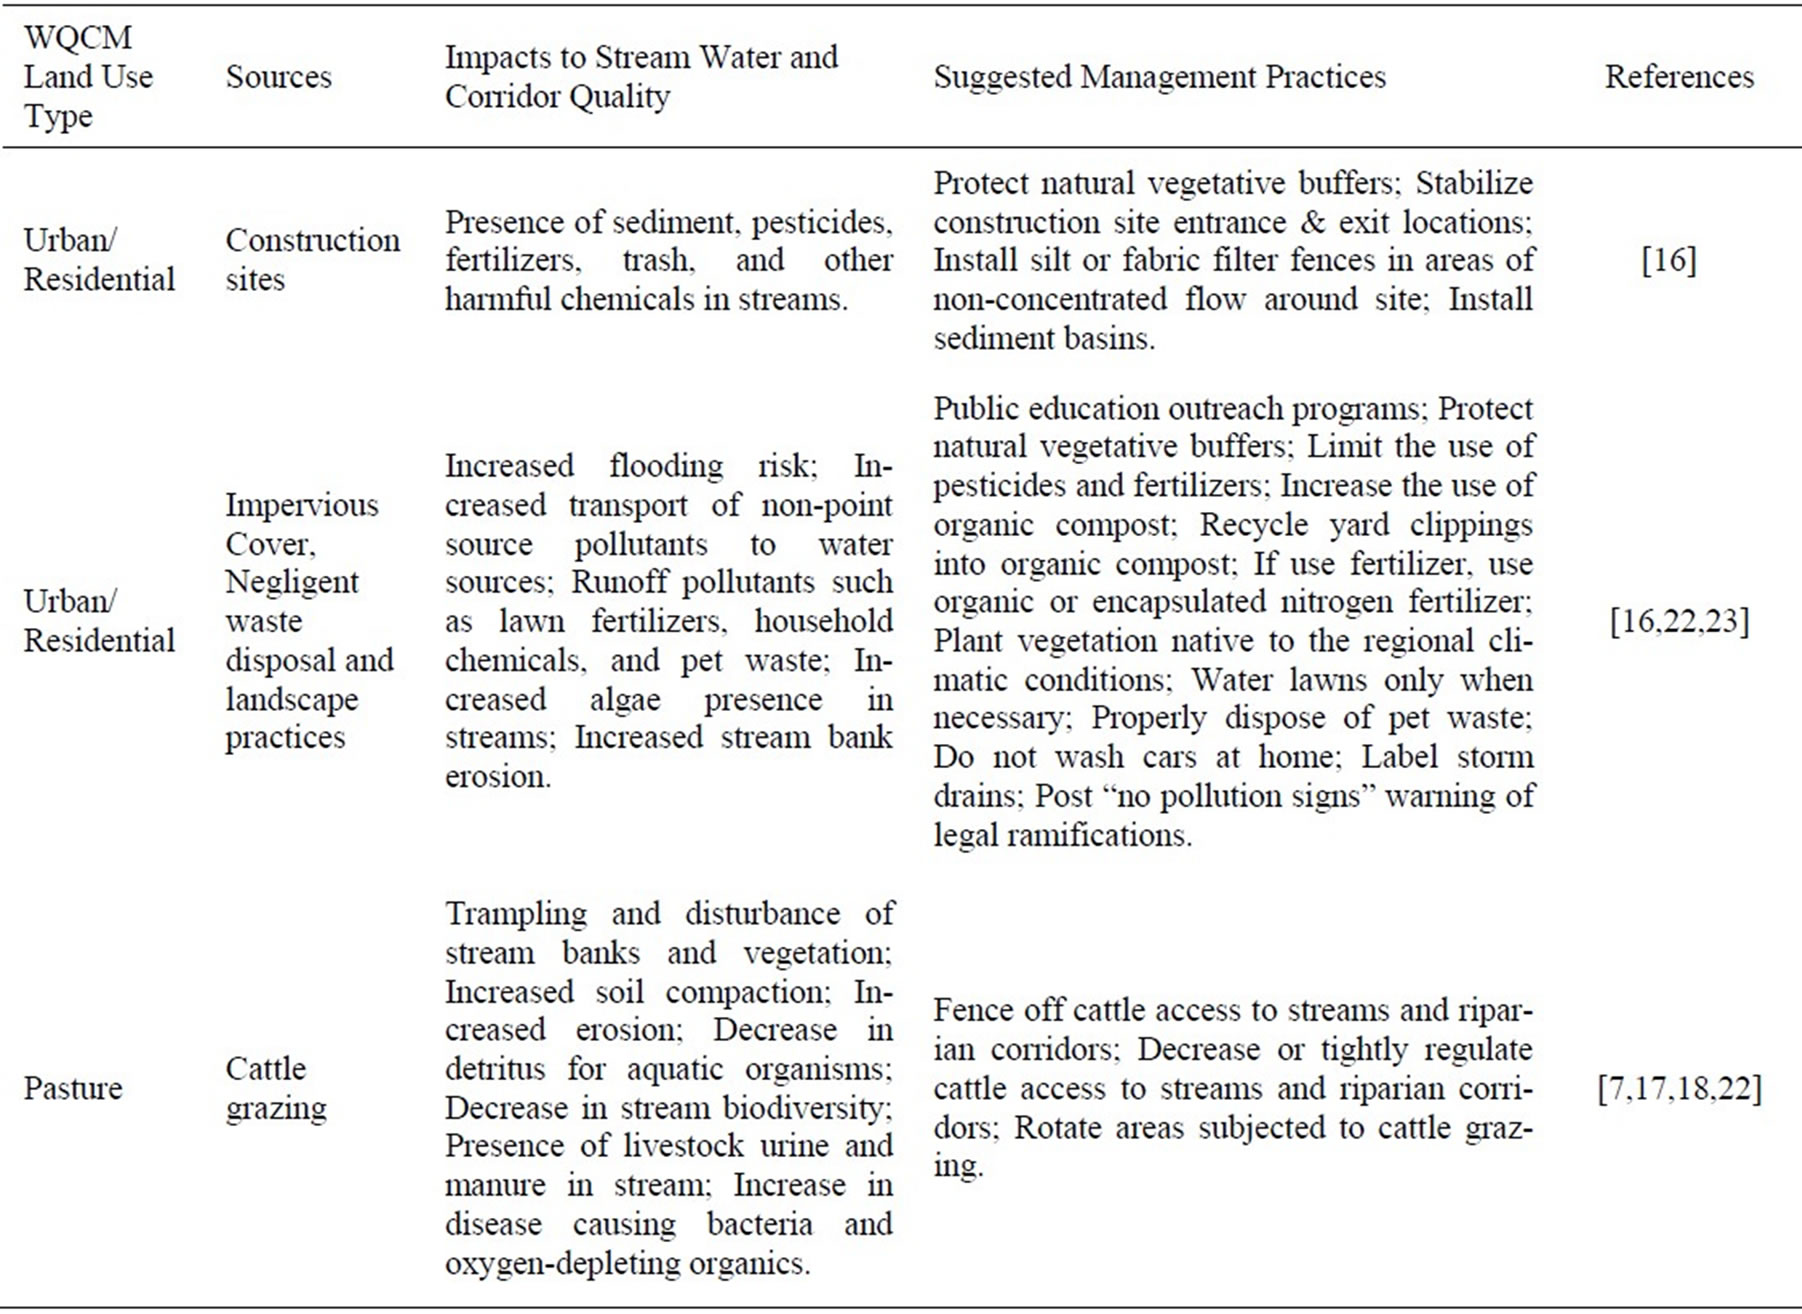
Table 7. Impact sources and management practices for stream water quality and corridor protection based on land use.
the detrimental impacts caused by the grazing of lifestock in and near streams on pastureland, the most effective remedy for which being the total exclusion of cattle from accessing streams and their surrounding corridors [20].
Just as the complex interactions of ecosystems are intertwined, so are the parameters outlined in the WQCM model. The stability of a stream bank, measured in the WQCM model by erosion potential, is both directly and indirectly affected by land use. For instance, stream channelization to improve aesthetics in residential developments disturbs the delicate balance among stream ecosystems, leading to amplified water flow and the subsequent increase in stream bank erosion, channel incision, and habitat degradation [21]. In other words, if erosivity is an implicating parameter for a particular WQCM score, the first step in establishing abatement practices is analyzing how stream bank erosion characteristics is related to the land use practices surrounding the stream and on the neighboring land parcels. Once the relationship between land usage and channel erosion has been established, the appropriate management practices, as outlined in Table 7, can be implemented. Based on the results of this study, the conclusion is that the WQCM model provides a potential system for predicting stream corridor quality within the north central Texas area, but the approach should be applicable for other rapidly urbanizing areas.
5. Acknowledgements
We are grateful to the U.S. Environmental Protection Agency and the Upper Trinity Regional Water District for providing support for this research, and Brian Boe and Matt Dameron for their assistance in this research.
REFERENCES
- J. R. C. Karr and I. J. Schlosser, “Water Resources and the Land-Water Interface,” Science, Vol. 201, No. 4352, 1978, pp. 229- 234.
- P. J. A. Withers and H. P. Jarvie, “Delivery and Cycling of Phosphorous in Rivers: A Review,” Science of the Total Environment, Vol. 400, No. 1-3, 2008, pp. 379-395.
- D. D. Tullos and M. Neumann, “A Qualitative Model for Analyzing the Effects of Anthropogenic Activities in the Watershed on Benthic Macroinvertebrate Communities,” Ecological Modeling, Vol. 196, No. 1-2, 2006, pp. 209- 220.
- D. Montgomery, “Geomorphology, River Ecology and Ecosystem Management in Geomorphic Processes and Riverine Habitat,” Water Science Applications, Vol. 4, pp. 2001, 247-253.
- P. J. Wigington Jr., J. L. Ebersole, M. E. Colvin, et al., “Coho Salmon Dependence on Intermittent Streams,” Frontiers in Ecology and the Environment, Vol. 4, No. 10, 2006, pp. 513-518.
- NRC (National Research Council), “Riparian Areas: Functions and Strategies for Management,” National Academies Press, Washington, D.C., 2002.
- D. L. Correll, “Principles of Planning and Establishment of Buffer Zones,” Ecological Engineering, Vol. 24, No. 5, pp. 2005, 433-439.
- P. A. Hamilton and T. L. Miller, “Lessons from the National Water-Quality Assessment,” Journal of Soil and Water Conservation, Vol. 57, No. 1, 2002, pp. 16A-21A.
- EPA, “National Water Quality Inventory, Chapter 2: Rivers and Streams”, U.S. Environmental Protection Agency, EPA/305b, Washington, D.C., 2000, pp. 7-15.
- R. L. France, “Potential for Soil Erosion from Decreased Litterfall due to Riparian Clear-Cutting: Implications for Boreal Forestry and Warm-and-Cool-Water Fisheries,” Journal of Soil and Water Conservation, Vol. 52, 1997, pp. 452-455.
- J. B. Kauffman, R. L. Beschta, N. Otting and D. Lytjen, “An Ecological Perspective of Riparian and Stream Restoration in the Western United States,” Fisheries, Vol. 22, No. 5, 1997, pp. 12-24.
- R. J. Naiman and H. Décamps “The Ecology of Interfaces: Riparian Zones,” Annual Review of Ecology and Systematics, Vol. 28, 1997, pp. 621-658.
- P. M. Groffman, D. J. Bain, E. Lawrence, et al., “Down by the Riverside: Urban Riparian Ecology,” Frontiers in Ecology and the Environment, Vol. 1, No. 6, 2003, pp. 315-321.
- EPA, “National Management Measures to Control Nonpoint Source Pollution from Urban Areas. Introduction and Management Measures 8, 9, 12,” U.S. Environmental Protection Agency, EPA/841/B-05/004, Washington, D.C., 2005, pp. 1-518.
- S. F. Atkinson, B. A. Hunter, A. English, B. Boe and M. Dameron, “Lewisville Lake Watershed Protection and Management Strategies,” Technical Report Prepared for the Upper Trinity Regional Water District, 2007, p. 155.
- NCTCOG (North Central Council of Governments), Arlington, 10 February 2010. http://www.nctcog.org/ris/ demographics/population.asp
- U.S. Department of Agriculture, “Stream Visual Assessment Protocol (SVAP),” National Resource Conservation Service, National Water and Climate Center Technical Note 99-1, Portland, 1998, p. 36.
- A. J. Belsky, A. Matzke and S. Uselman, “Survey of Livestock Influences on Stream and Riparian Ecosystems in the Western United States,” Journal of Soil and Water Conservation, Vol. 54, No. 1, 1999, pp. 419-431.
- T. Pirim, S. Bennett and B. Barkdoll, “Effect of Riparian Vegetation Density on Stream Flow Velocity,” Joint Conference on Water Resource Engineering and Water Resources Planning and Management, Water Resources, Vol. 104, 2000, p. 347.
- K. Kennedy, “Storm Water: Why Take it Personally?” Fourth Annual Region VI MS4 Operators’ Conference, North Central Texas Council of Governments (NCTCOG), Arlington, 2005.
- NCTCOG, “12 Lessons Student’s Can Learn from Smart Scape,” North Central Texas Council of Governments, Texas Smartscape Program, Environment and Development Department, Arlington, 2006.
- C. T. Agouridis, “Cattle Production in a Small Grazed Watershed of Central Kentucky,” Proquest Dissertations and Theses, 2004, p. 485.
- NRCS, “Animal Manure Management-Brief 7,” National Resource Conservation Service, Resources Conservation Act, Washington, D.C., 1995.