Journal of Water Resource and Protection
Vol. 2 No. 2 (2010) , Article ID: 1323 , 14 pages DOI:10.4236/jwarp.2010.22019
Temporal Study of Stress-Induced Effects Caused by Developmental Temperature Changes and Water Quality in an Isolated Northern Pike (Esox lucius L.) Population
Dipartimento di Biologia Cellulare e Ambientale, Università degli Studi di Perugia, Via Pascoli, Perugia, Italia
E-mail: Fausto Panara panaraf@unipg.it
Received November 27, 2009; revised December 30, 2009; accepted January 5, 2010
Keywords: Northern pike, Esox lucius, fluctuating asymmetry, short-term climatic variations
ABSTRACT
Development perturbations may affect the regular phenotype and are commonly measured through fluctuating asymmetry (FA) levels. Short-term climatic variations, that modify the temperature, can influence chemical and physical water characteristics. Fishes have been used as model organisms for studying stress-induced changes in body symmetry, since they are ectothermic, good bioindicators, easy to find and having economic relevance. Northern pike being a holoarctic, big, edible, top predator is one of the most economically important freshwater fish for recreational and commercial fisheries and freshwater ecosystems management. The isolated population of Lake Trasimeno (Central Italy)—in good health conditions and that can be considered one of the genetically best conserved of Italy—, was chosen as model. FA, seven microsatellite loci and early developmental stages were investigated in order to correlate the developmental stability of this population to its genetic variability and to environmental perturbations. The results obtained underlined a positive correlation (>>0.40) between FA indexes and temperature; the non-parametric KruskallWallis test showed significant differences in FA levels for some FA indexes and parameters. Overall results underlined that FA increased in individuals grown at a temperature above 8°C as compared with those grown at 5°C or at lower temperatures. Both positive and negative correlations between FA parameters and chemical and physical water characteristics were shown. The comparison of genetic and FA data underlined a low correlation between microsatellite and FA pairwise distances, nevertheless a positive and significant correlation emerged for some FA measurements and microsatellite data. In particular, only Elu87 locus showed a statistical significant correlation versus total FA. Finally, as expected, results indicated that the incubation time was temperature-dependent; the ODT was in the range 8–10°C and lower and higher temperatures caused drastic embryo mortality. These results showed robust correlations, both positive and negative, between some FA parameters and chemical and physical characters and were in agreement with the assumption that temperature variations as well as pH, conductibility and chloride variation, may increase molecular perturbations and, subsequently, the global developmental noise during development. These data suggest that FA could be considered a measure of animal welfare. The relative breeding easiness of this species may be a valid tool for the estimation of controlled environmental stress influences, not only of thermal origin, and a valid information basis for studies on wild populations. Furthermore, it has long been debated whether FA levels depend upon genetic variability, the particular molecular marker notwithstanding, and whether it is possible to use one or more molecular markers to better understand FA data. The Mantel tests performed in this study showed very interesting correlations between FA and the investigated microsatellites. For the lack of a linkage map for the investigated microsatellite loci, it is presently impossible to establish the relationships between the FA parameter and the microsatellite loci that the Mantel test defines as correlated.
1. Introduction
Global warming, a major climate change impact, affects both animal and plant biology, as well as agriculture, sea-level rise and coastal zones erosion. The effects on wild living organisms concern reproduction, development, growth and dormancy periods [1] or migration by dispersion to more suitable habitats [2]. The external phenotype of all organisms results from the combined effect of adaptation and natural selection. Perturbing factors during development may affect the regular phenotype and the deviations from normal development, such as small, randomly directed asymmetries, which are an index of the so-called developmental instability (DI) [3,4]. This phenomenon acts before adaptive changes or migration strategies, and individuals usually reset to environmental stress with sub-lethal and/or sub-pathologic responses that sometimes influence the development of a correct body symmetry. A commonly used measure of DI is the number of phenodeviants and the fluctuating asymmetry (FA) level [5], one of the most applied ecological and morphological methodologies to evaluate random non-directional deviation from perfect symmetry [6,7]. Since the same set of genes and environmental conditions control the development of the left and right sides of a bilaterally symmetrical organism, FA degree is deemed to reflect a developing system’s sensitivity level to random perturbations [4] and can be used to measure genetic or short-time exposure to environmental stress during development [8]. FA markedly differs from both directional asymmetry and antisymmetry, thus these alternative hypotheses should be excluded before applying FA to eco-toxicological approaches [4].
Perturbation during development can be caused by several stresses, such as the presence of pesticides and chemicals, water and air pollution, parasitism, population density or hatchery supplementation, maternal health state and physical parameters including pH and temperature [1,4,9–12]. It has also been proposed that asymmetric morphological characters consist of asymmetric and irregular growth increments [5]. Fishes have been used as model organisms for studying stress-induced changes in body symmetry, being ectothermic, good bioindicators, easy to find and having economic relevance [10,11,13]. Several studies have shown that measures of developmental instability, such as FA, are negatively correlated with growth rates and animal welfare [5,10]. Water temperature is considered one of the most important fish growth controlling factors and one of the limiting parameters in hatching success. At present, there is a scarce knowledge of the mechanisms regulating fine tuning of development and reproduction of wild-type phenotype in fish, of the effects of small temperature ranges, near the optimal developmental values, and of the effects of several chemical and physical parameters (pH, ammonia, conductivity, etc...). A source of stress may also be the reduced genetic diversity of wild populations, as documented in salmonids [8,10] and ayu, Plecoglossus altivelis [14]. The taxonomy of Esocidae, mainly based on morphological characters, indicates the existence of five species distributed in Eurasia and North America. Only northern pike (Esox lucius Linnaeus, 1758), is present in Europe with a broad geographical and environmental distribution, including most of the northern temperate zones, above 40 ° latitude up to the Arctic zone, and Italy, Greece and Turkey. Northern pike is a big, edible freshwater top predator fundamental for the conservation and management of most Italian freshwater ecosystems. Northern pike appears in the IUNC Red List of Threatened Species (2008 IUNC: www.redlist.org) as a “Least Concern” species; nevertheless, recent reports indicate a decline of some North American and European populations [15,16], suggesting that this species is going through a critical phase [17]. In fact, the effects of overfishing, habitat reduction and fragmentation, anthropic perturbations, competition with other predator fishes and climate change have a detrimental impact on northern pike. Furthermore, genetic studies revealed a very low polymorphism in all populations investigated [18–20], suggesting the need of a greater ecological attention for this species. This situation is particularly serious in Italy since pike populations are small and very fragmented. Even though just a few studies addressed the effects of climate change on northern pike [21–23], recorded data clarified that water warming may influence northern pike biology through both direct and indirect effects, having a complex impact on this species. Through temperature modifications, short-term climatic variations may influence other chemical and physical water characteristics, such as water levels, salinity, conductivity and transparency.
Environmental biologists and applied ecologists are interested in detecting environmental stress in order to limit damages produced in wild populations before they become irreversible. FA analysis is a powerful tool to monitor the health of natural populations because it evaluates pre-pathologic and pre-lethal levels of stress, it is low-cost and low-time-consuming, it is applicable to a large range of organisms and traits, and supplies a detailed description of the environmental influences that could affect a natural population [37]. Therefore, FA allows an improvement of environmental monitoring, increasing knowledge on evolution, adaptation and extinction, and it permits the development of eco-sustainable fish aquaculture. In fact, adaptation is essential for the survival of living organisms to environmental perturbations. In particular fishes, being poikilothermal animals, are strongly affected by water temperature and quality at both developmental and growth levels. In particular, during development they are strictly dependent on water temperature variations whose marked effects are evident at both biochemical and morphological levels [11,38–40]. According to a recent report, Lake Trasimeno pike (Central Italy, Umbria Region), a small and isolated population, shows a good health condition and can be considered one of the genetically best conserved of Central Italy [11,20,24]. Since 1990 this population is being recruited through a supportive breeding by a local authority programme, performed using about 600 breeders, culled from the lake and changed yearly [25]. Nevertheless, this population suffers from several environmental stresses due to industrialized agriculture and tourism, two highly developed anthropic activities in the area. These factors highlighted the importance to take into account chemical and physical water characteristics, particularly because the research aimed to verify whether FA levels could be used to monitor stress caused by climatic variations affecting the optimal developmental temperature. In addition, seven microsatellite loci were investigated in order to correlate the genetic variability of this northern pike population, the degree of DI, measured by FA indices, and environmental perturbations. The data were reported for thirteen developmental years from 1993 to 2007. On these bases a study on the effect of water temperature and quality on northern pike was performed. In particular, the purposes of this study were:
• FA analysis and correlation with chemical and physical water characteristics. To evaluate the use of FA to detect changes in developmental instability of northern pike related to environmental perturbations measured as both water temperature and water chemical and physical qualities. The study was carried out by means of seven FA measurements: three morphometric and four meristic traits across thirteen years.
• Correlation between FA and microsatellite data. To compare genetic variability, performed through seven microsatellite loci, and FA levels in order to correlate the genetic variability of this northern pike population, the degree of DI, measured by FA indices, and environmental perturbations. The data were reported for each developmental year from 1993 to 2007.
• Effect of temperature on pike development and growth. To evaluate the effect of water temperature on both northern pike development and growth comparing optimal values with those of DI.
2. Materials and Methods
2.1. Sampling Site
Lake Trasimeno (43° 8’ 43’’N; 12° 5’ 52’’E) has a surface of 128 Km2, it is the second largest Italian lake and is localised in Central Italy in the Tevere river basin. It has been declared a Regional Italian Park (DLR 9/95) and includes two Natura 2000 sites (SIC IT5210018 and ZPS IT5210070). It is a closed laminar lake characterized by an extremely reduced depth (the mean depth is less than 5 m, with a maximum of 6.3 m) which magnifies water temperatures oscillation and level changes of chemical and physical parameters. The high dependence of water temperature from air temperature made this lake a good model to monitor the effect of climate warming and of anthropogenic impacts on northern pike and other inhabited freshwater species.
2.2. Animals and FA Measurement
Northern pike samples were drawn in the period 2002- 2008 from Lake Trasimeno (Central Italy, Umbria Region). The research was made up analysing 562 fishes temporarily stocked at the Centro Ittiogenico del Trasimeno (CIT, Provincia of Perugia) deputed to fish management and reproduction. Samples were anesthetised with chloroform added in a small tank (60ml/100lt), measured separately by two operators, photographed with a Canon EOS 350D digital photocamera and immediately put in fresh and well oxygenate water prior to release into the lake. In order to define FA, four morphometric (postorbital distance, head length to operculum, pectoral and ventral fins length) and four meristic (pectoral and ventral fins rays, opercular and mandibular pores) characters on the left and right sides of each individual were measured (Table 1). They were selected since they could be easily and accurately measured in living specimens without damage. Data were transformed into asymmetry values using the formulas “right-left” “(1)” and “(2)” [26,27].
(d=Ri−Li)(1)
and
(Ri+Li)/2(2)
Measurements were made in duplicate by two independent operators. To evaluate any human measurement error, two two-way ANOVA tests were performed, both with side (fixed) and individual (random) as the two factors [28]. No test for photographic procedure error was carried out because fishes were directly measured and the photographs were taken just for documentation. As to morphometric traits, the linear regression between single trait and total length was estimated in order to exclude that larger fish could exhibit a greater asymmetry as a consequence of their size [26,29]. Differences in asymmetry levels between sexes were tested using the Wilcoxon’s test. In order to exclude the alternative hypotheses, i.e. directional symmetry and antisymmetry, a sign test and a kurtosis analysis, respectively, were carried out [29]. Total morphometric (MoI) and meristic (MeI) indexes were made up adding the single absolute values of all the morphometric characters and of all the meristic characters respectively. These indexes were treated separately because they have different statistical properties, and were fixed in various developmental stages [31]. Nevertheless, to evaluate the use of a single index, a total FA index (FAI) was calculated adding MoI and MeI. The three indexes were made up for each year separately, grouping together fishes developed in years having the same mean temperature values. Normality of absolute d values distribution was tested using the Shapiro-Wilk’s test. Since they were not normal, the non-parametric Kruskall-Wallis’ test was used to compare stocks developed in different years and at different temperatures, for each character and for the three calculated indexes.
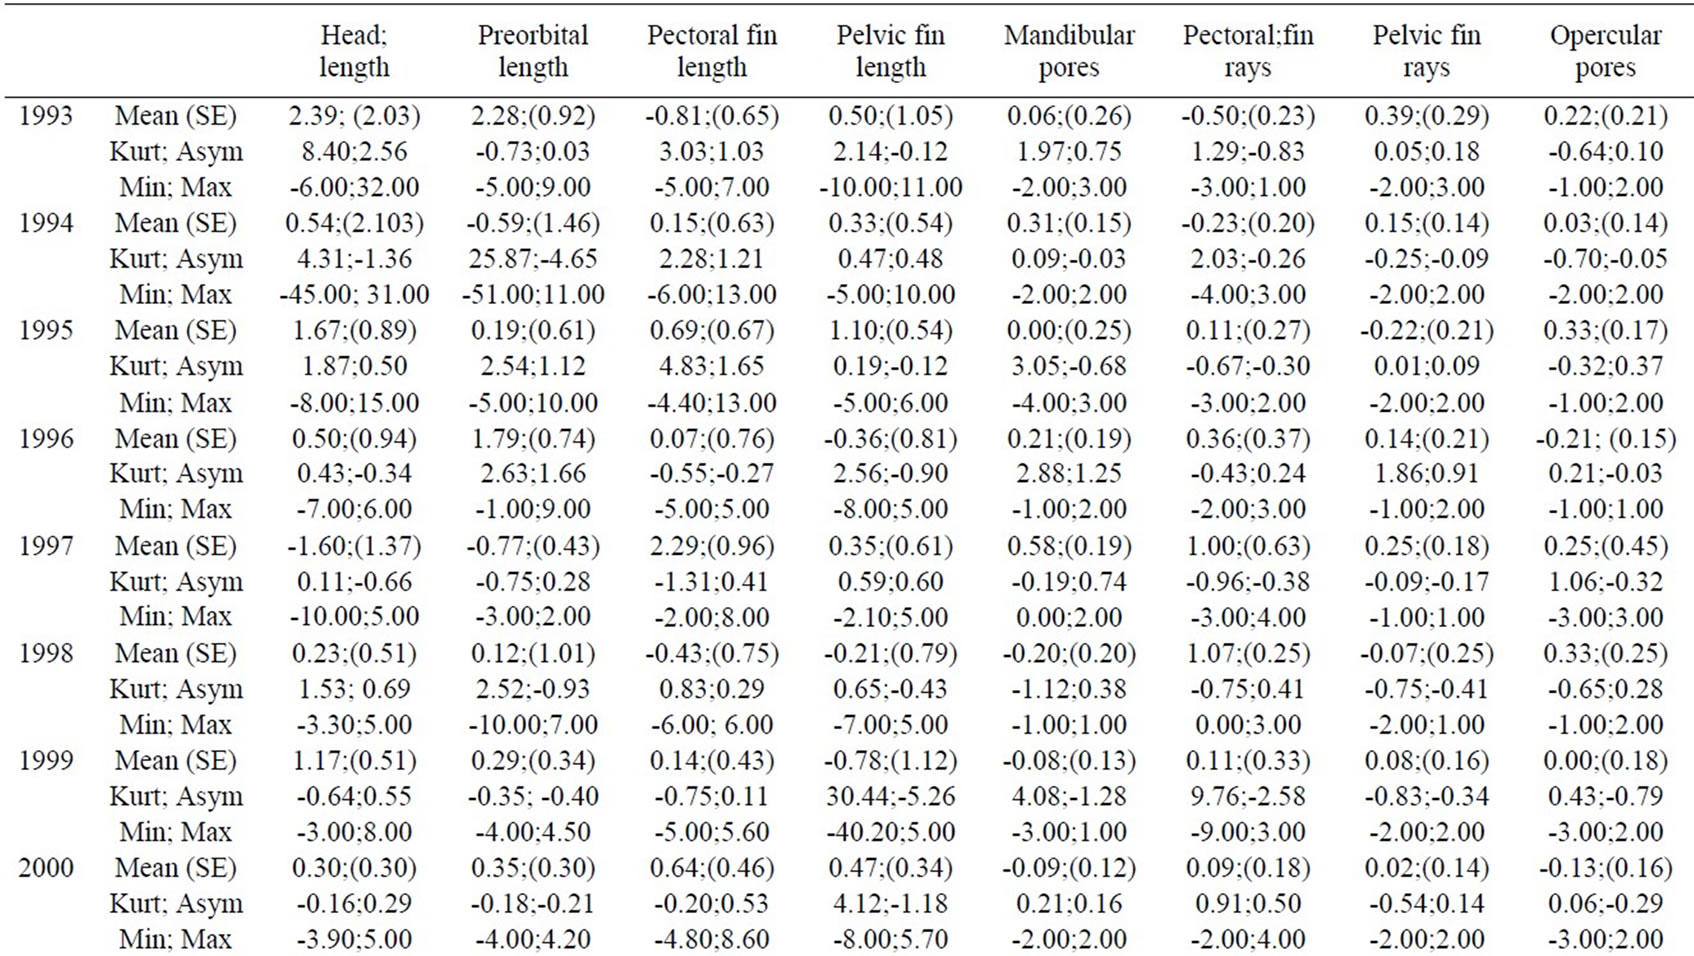
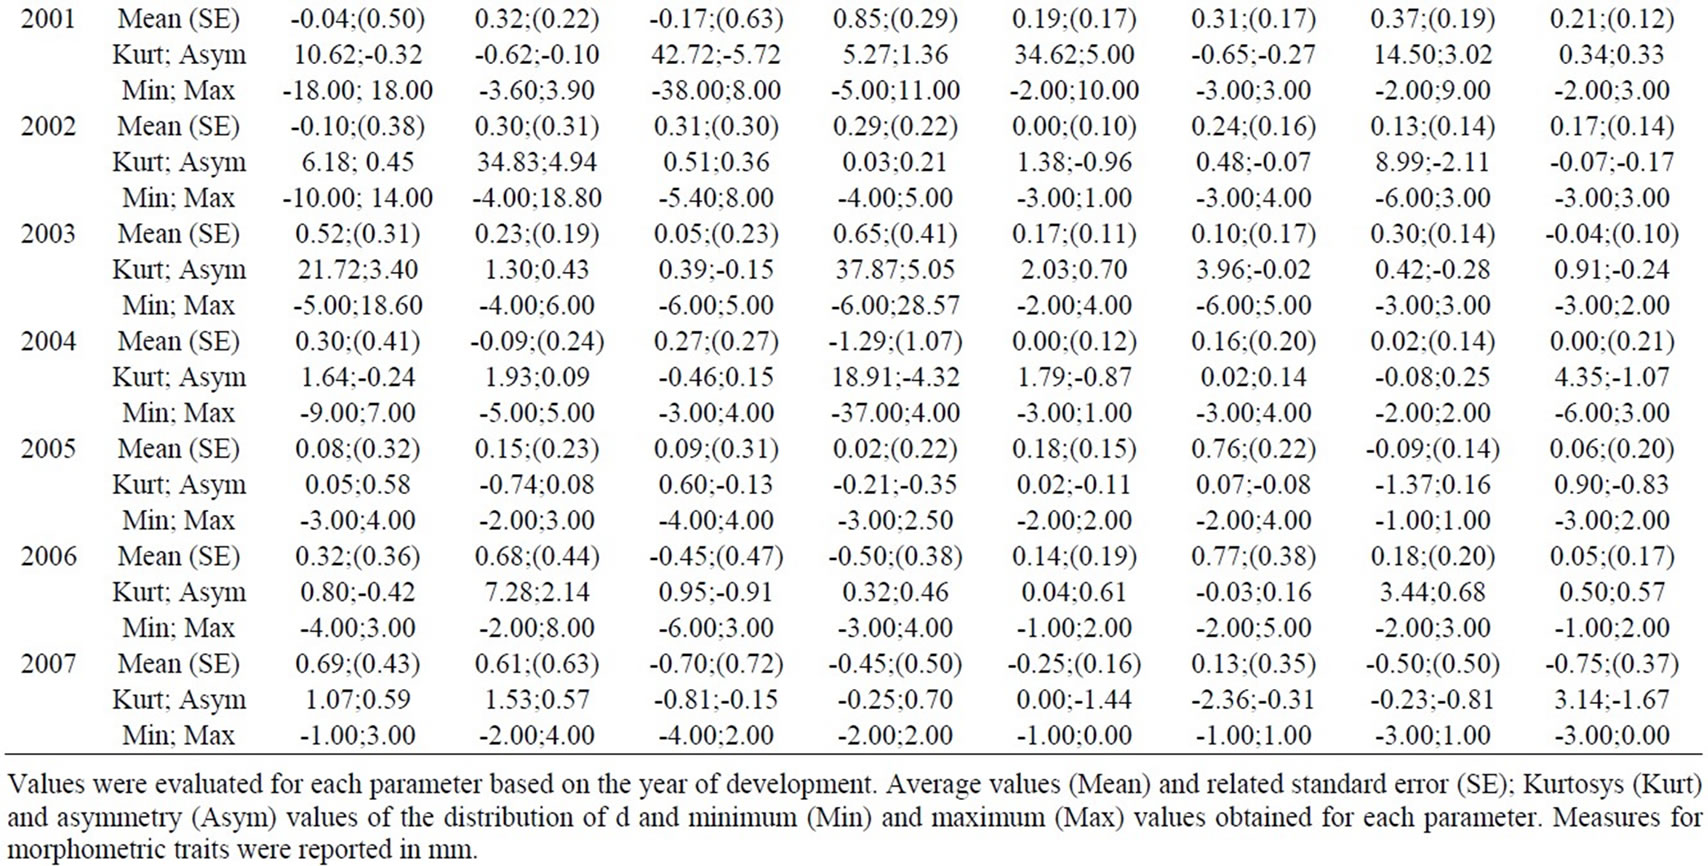
Table 1. Descriptive analysis of d=R-L.
A correlation analysis between FA values (MoI, MeI and FAI) and chemical and physical water parameters was made. Correlations values were considered positive or negative when higher than 0.50 and lower than -0.50 respectively. The non-parametric Kruskall-Wallis’ test, used to compare stocks developed at different temperatures, was carried out grouping together stocks developed in years having mean water temperature values, related to the developmental period, lower than 5°C, between 5 and 8°C and higher than 8°C. Such ranges were chosen taking into account the optimal development temperature (ODT, see below) from fertilization until hatching; lower and higher temperatures caused embryo damages. Statistical analyses and graphics were made using Excel 2007 data analysis set and Statistica 5.1 (Statsoft) package.
2.3. Chemical and Physical Parameter Evaluation
Mean values of water temperatures were calculated as mean values of hourly temperature of each day of the entire period of reproduction and development of northern pike in Lake Trasimeno. This period, drawn for each year from the CIT’s yearbook, ranged approximately from the first week of February to the first week of March. Chemical and physical characteristics were obtained from Agenzia Regionale Per l’Ambiente (ARPA), a public institution for environmental monitoring. The following data were recorded: water temperature (°C), pH, dissolved oxygen (mg/L), conductivity at 25°C (µS/cm), chlorides Cl (mg/L), nitric nitrogen (mg/L), nitrous nitrogen (mg/L), ammonial nitrogen (mg/L), total phosphorus (mg/L), orthophosphates (mg/L), silica SiO2 (mg/L), sulphates SO4 (mg/L) and alkalinity (mg/L). ARPA monitors the above parameters following Italian (D.Lgs 152/99, All. 1; D. 391/03) and EU directives.
2.4. Microsatellite Polymorphism Analysis
For a subsample of 150 individuals, DNA was extracted from a small piece of pectoral fin (10 mg ca.) for each sample, stored and quantified as previously reported [24,25]. Seven microsatellites loci already selected on the basis of their polymorphism: [24] Elu19, Elu51, Elu76, Elu78, Elu87, Elu276 [30,31] and EluB38INRA [19] were amplified as already reported [24,25]. Amplicons were run on ABI PRISM 310 automatic sequencer (Applied Biosystems, Foster City, CA, USA) in presence of 500-LIZ standard (Applied Biosystems, Foster City, CA, USA); raw data were analysed through Gene Mapper 4.0 (Applied Biosystems, Foster City, CA, USA). Alleles were designated according to their size and allelic dropout or misprinting; genotyping errors and linkage disequilibrium (LD) were evaluated as already reported [24]. Wright’s indexes (Fit, Fis, Fst) [32] were calculated using F-STAT. To provide confidence intervals (CI) of the estimated parameter, significance values for each locus were determined by bootstrapping over samples and significance values over all loci were calculated by jackknifing over loci. Levels of genetic differentiation were also assessed analysing Fst between the fourteen stocks defined on the basis of the year of development through a Pearson correlation test. Using Arlequin 3.01 the allele frequencies for each locus within the fourteen temporal samples (1967; 1993-2005) were computed and AMOVA analysis was carried out. Deviation of observed genotype frequencies were tested for the Hardy-Weinberg equilibrium (HWE), giving estimates of Fis by [32]. Mantel tests for Matrix Correspondence were carried out using the option for statistical testing by random permutation and by means of Genalex 6.1 [33]. The Mantel option tests for a statistical relationship between the elements of any two distance matrices with matching entries was carried out; a correlation of individual-by-individual distances calculated from microsatellite and FA data sets was tested. This method yields a correlation coefficient, ranging from –1 to +1 for the two data matrices, with a test for a significant relationship by random permutation. Four separated Mantel tests were performed: subdividing data on the basis of the year of development and comparing total FA and total genetic variation; comparing FA of each morphological parameter with the global genetic diversity; comparing each locus with total FA diversity and, finally, comparing FA of each morphological parameter with the genetic diversity of each locus.
2.5. Effect of Temperature on Pike Development and Growth
In the spawning period of northern pike the mean water temperature ranged from 4 to 10°C and the photoperiod ranged from 13.5 to 15 h. During this period the eggs were gently stripped from anesthetized (0.2% ethyl paminobenzoate) females and artificially fertilized with male milt. The suspension of sperms and eggs was gently mixed with a sterile goose-gill for 30 min and 500 fertilized eggs, as determined under a stereomicroscope, were incubated in 10-liters glass tanks of filled with a continuous flow of sterilized lake water at different constant temperature (6.0,8.0,10.0,12.0,15.0,20.0°C) in a thermoregulated room. The ODT was estimated on the basis of the percentage of hatching success and of swimming larvae. The first embryonic stages were constantly monitored using an Olympus Digital Photocamera/Optical microscope device. At later stages, observations and data recording were carried out every 4-6 h with the same apparatus. Specimens of all monitored stages were kept in 10% buffered formaldehyde and used for reference control. The embryonic stages of pike refer to the tables and terminology proposed by [34,35]. In order to determine the growth of northern pike in Lake Trasimeno, total length, weight, sex and scales for age detection were measured on every sample. In particular, three scales for each individual were analysed by means of an optical microscope and the year of development was calculated on the basis of the age determination/year of sampling. Age evaluation was made in duplicate by two independent operators. Growth was analysed using length-weight multiplicative regression on data disaggregated according to sex and, for the two sexes separately, grouping together stocks developed in years having mean water temperature values lower/equal than 5°C, between 5 and 8°C and higher than/equal to 8°C. Differences between regressions for sexes were estimated through t-test on the regression coefficient b. Furthermore, a length-at-age analysis for males and females separately was made.
3. Results
3.1. FA Analysis and Correlation with Chemical and Physical Water Characteristics
No human measurement error (p>0.05) and no dependence of FA of morphometric traits to individual size (p>0.05) were found. No characters were canalised, i.e. none of the eight analysed traits responded less to an input of genetic and environmental origin [11,26,36]. No trait showed directional asymmetry and no character was platikurtic, i.e. none showed antisymmetry with the graphical method of normal Probability Plot and the analysis of kurtosis. On these bases, no character was excluded in subsequent analyses.
Wilcoxon’s test did not underline differences in FA levels between sexes (p<0.05), thus further analyses were made grouping sexes together. Some characters showed modified distributions for some years, but they were not globally considered, as shown by d=R–L distributions analysis (Table 1); (R+L)/2 values for each trait are reported in Table 2.
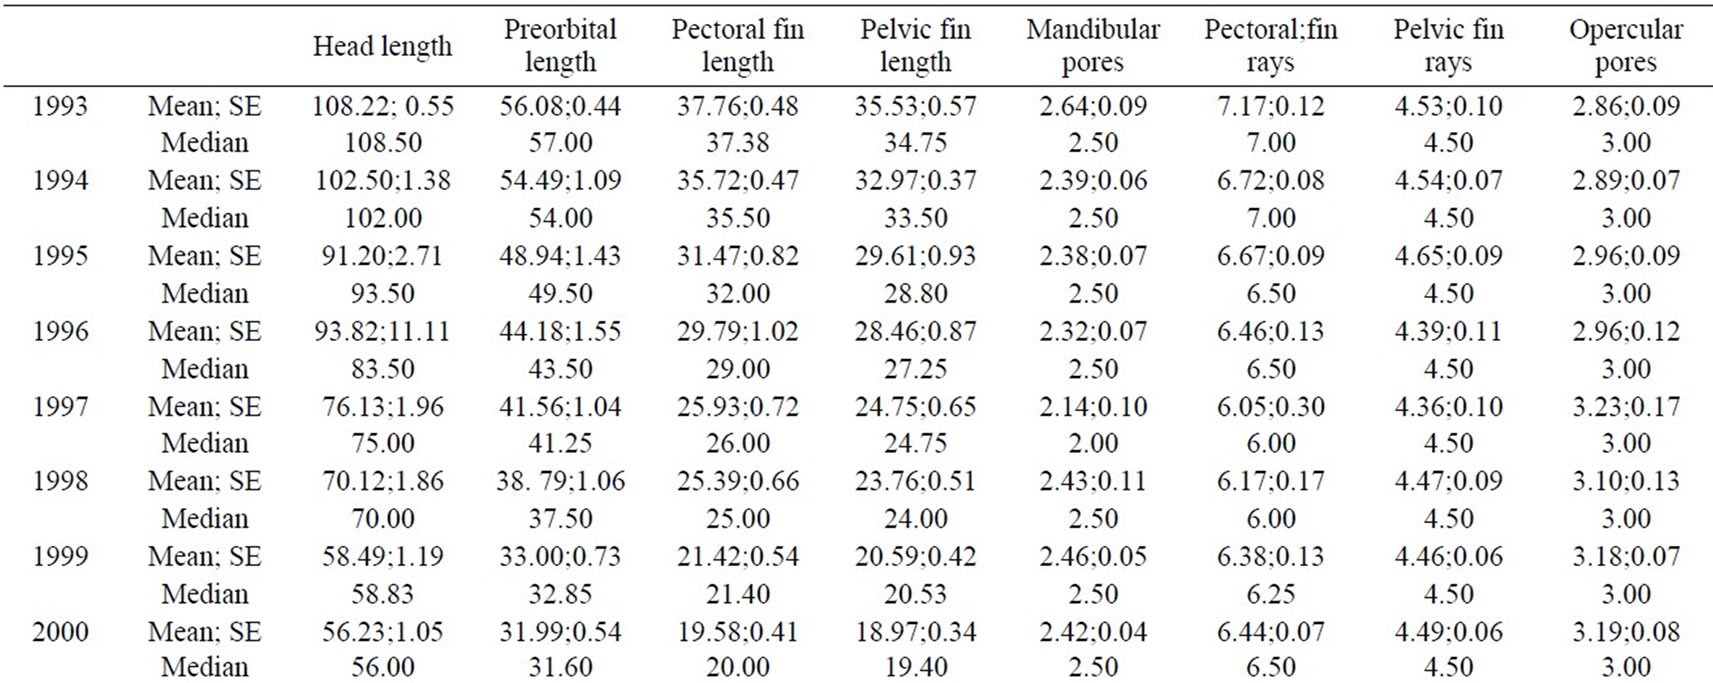
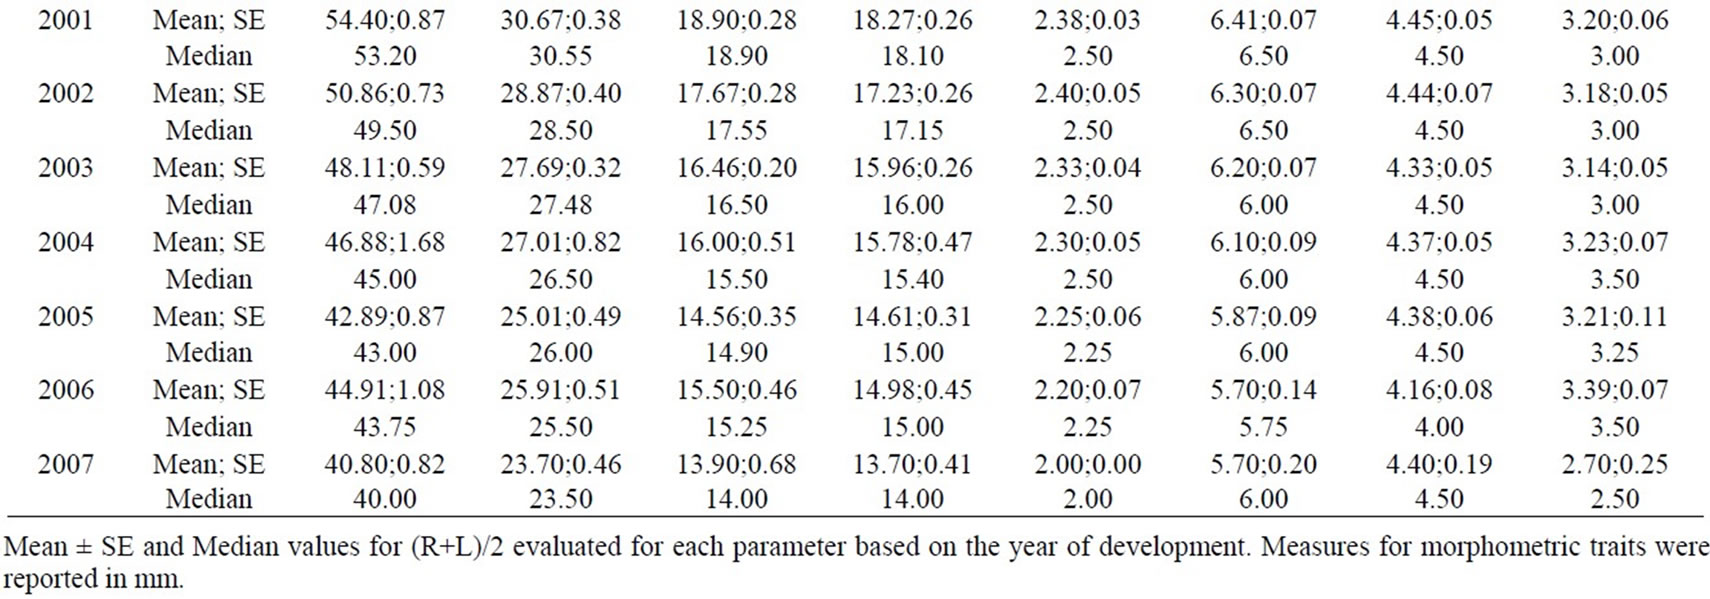
Table 2. (R+L)/2 analysis.
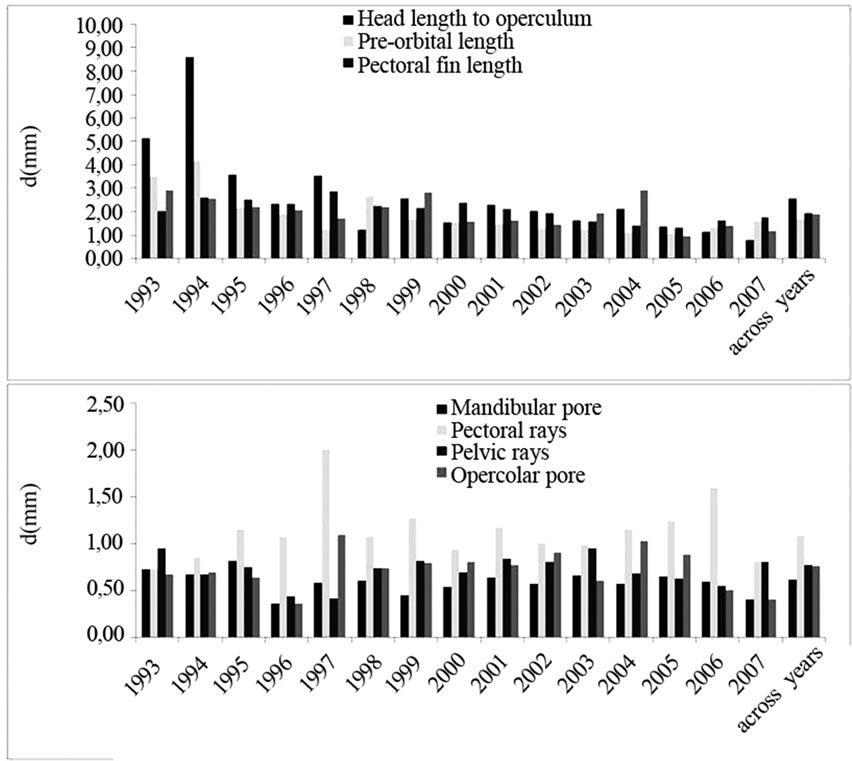
Figure 1. FA levels for each morphometric (A) and meristic (B) trait were reported by years and across years.
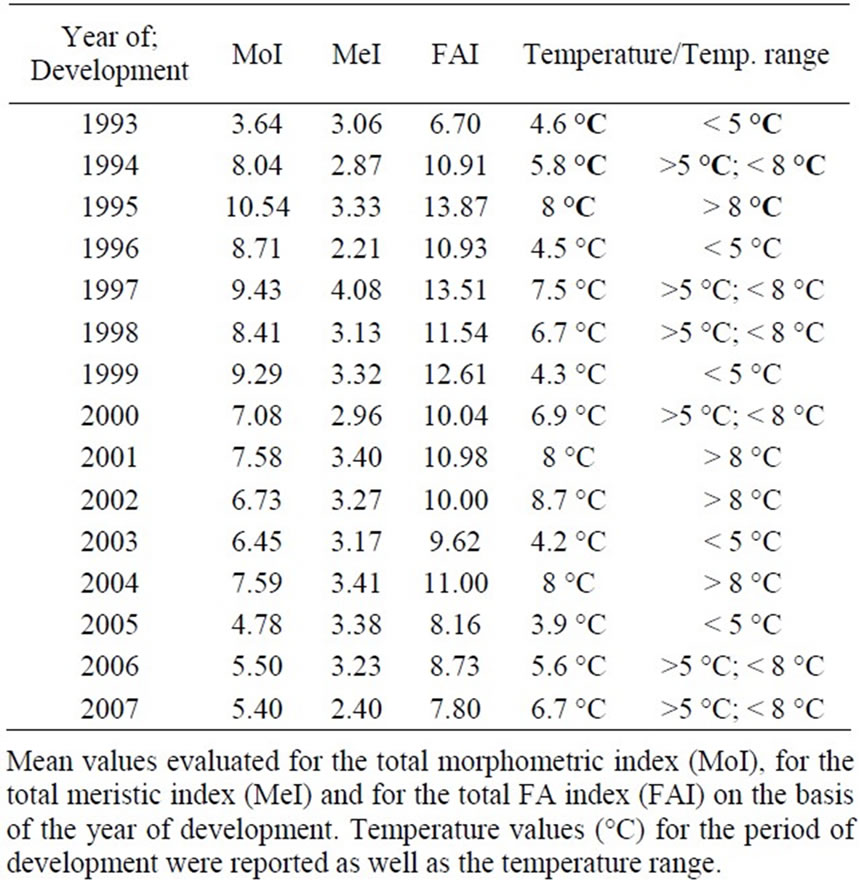
Table 3. MoI, MeI, FAI and Temperatures values.
Figure 1 shows values for each trait for both morphometric (Figure 1 (A)) and meristic (Figure 1 (B)) traits.
The mean yearly temperature range, evaluated for each year for the reproduction and early growth period (until the re-absorption of the yolk sack), is reported in Table 3 together with the calculated MoI, MeI and FAI.
There is a positive correlation between MoI, MeI, FAI and temperature; correlation values were 0.42 (MoITemperature), 0.49 (MeI-Temperature) and 0.5 (FAITemperature). Shapiro-Wilk’s test underlined that distributions were not normal (Table 4). The non-parametric
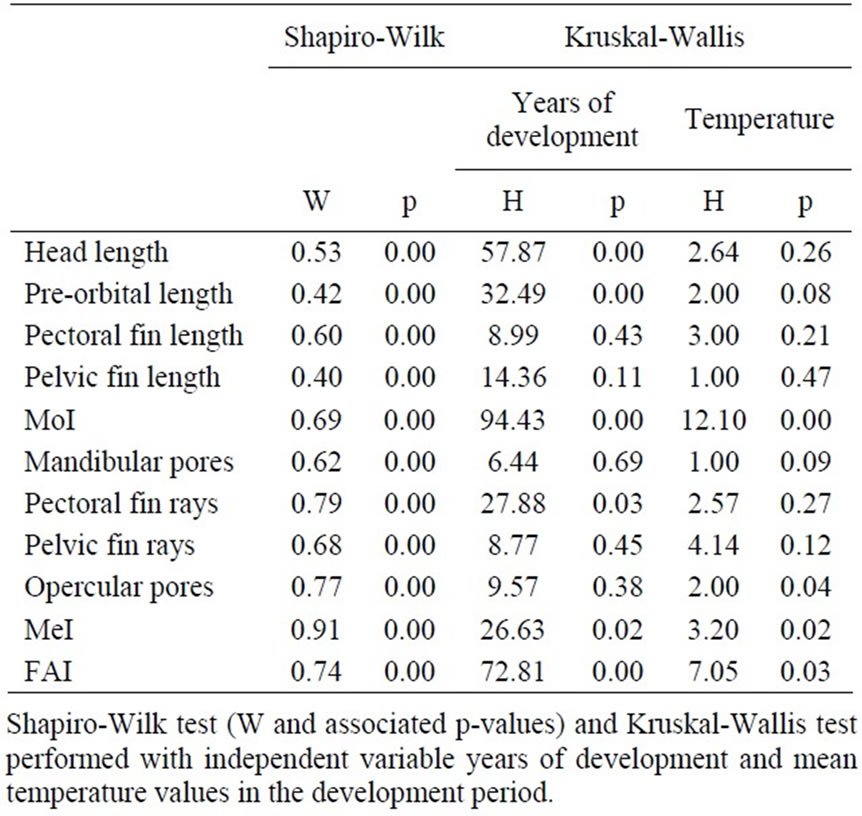
Table 4. Shapiro-Wilk and Kruskal-Wallis test.

Figure 2. The effect of temperature on the three FA indexes. Fishes were grouped on the basis of the mean temperature of the development period, as specified in Table 3.
Kruskall-Wallis analysis on data of the development period disaggregated by temperature shows significant differences in FA levels (p<0.05) for MoI, number of opercular pore, MeI and FAI (Table 4).
On this basis, the graphic restitution of FA indexes was performed grouping together stocks developed in years having mean water temperature values lower than 5°C (years: 1993; 1996; 1999; 2003; 2005), between 5 and 8°C (years: 1994; 1997; 1998; 2000; 2006; 2007) and higher than 8°C (years: 1995; 2001; 2004). The results (Figure 2), underlined that, for both morphometric and meristic traits, FA increased in individuals grown at a temperature above 8°C as compared with those grown at 5°C or at lower temperatures.
The non-parametric Kruskall-Wallis test conducted on the basis of the year of development shows significant differences in FA levels (p<0.05) of head length to operculum, pre-orbital distance, pectoral rays counts, MoI and FAI, but not of other traits (Table 4).
Correlation analysis over the entire FA measurement and the chemical and physical water characteristics showed a positive correlation of head length to operculum and pre-orbital length respect to pH and ammonia and of pectoral fin length respect to ammonia (Table 5). Subsequently, MoI and FAI showed similar correlations. However, a negative correlation was shown by pre-orbital length, pectoral fin length and pelvic fin length and conductibility, Cl- and SO4-2 ions and between pectoral fin length and orthophosphates.
3.2. Correlation between FA and Microsatellite Data
All microsatellite loci exhibited polymorphism among the thirteen stocks and 56 alleles were detected across the seven examined loci (Table 6). Ho average ranged from 0.40 (1999) to 0.63 (1997 and 1998). No evidence of linkage disequilibrium in the entire data set was found through Arlequin 3.1. The genotyping error was always lower than 4.0%; the moderate error was confirmed by the results of the Hardy-Weinberg equilibrium underlying that the thirteen stocks were in HW equilibrium. All populations showed null alleles for EluB38INRA with the exception of 2002 samples showing null alleles for Elu78; null alleles may be present at these loci, as suggested by the general excess of homozygotes for most allele size classes.
Stuttering might have resulted in scoring errors for EluB38INRA in samples 2003 and 2005, as indicated by the very significant shortage of heterozygote genotypes with alleles of one repeat unit difference (Confidence Interval=95%). No evidence of large allele dropout was found (Confidence Interval=95%). AMOVA analysis underlined that 7.01% of variation was due to variance among populations (sum of squares=68.61) while 92.99% was due to the within-population variance (sum of square =579.83) (data not shown). The Mantel tests showed a low correlation between microsatellite and FA pairwise distances, as indicated by R values ranging from -0.05 (Pectoral fin length vs Elu78) to 0.1 (Pectoral fin length vs Elu87 and Pre-orbital length vs Elu78) (Table 7).
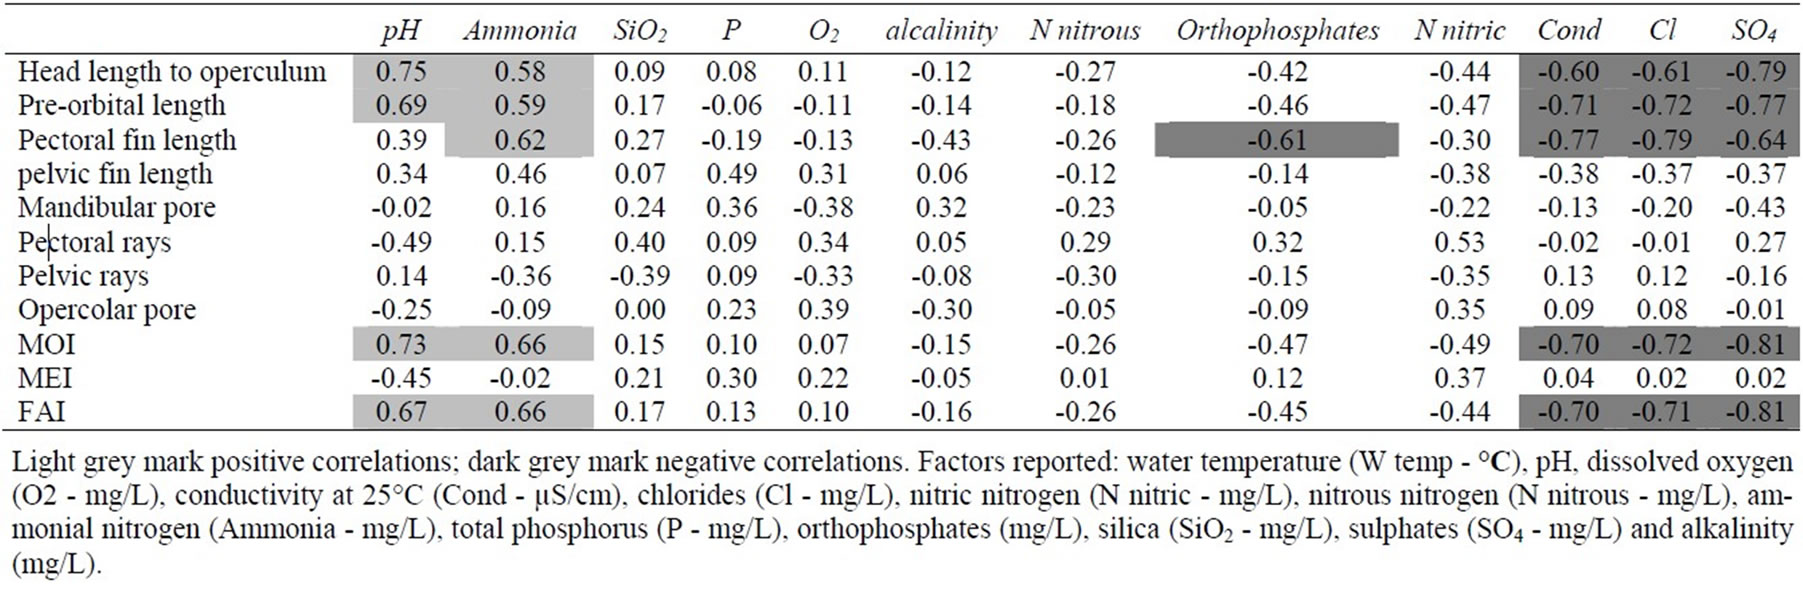
Table 5. Correlation values between each FA measurement and chemical and physical data.
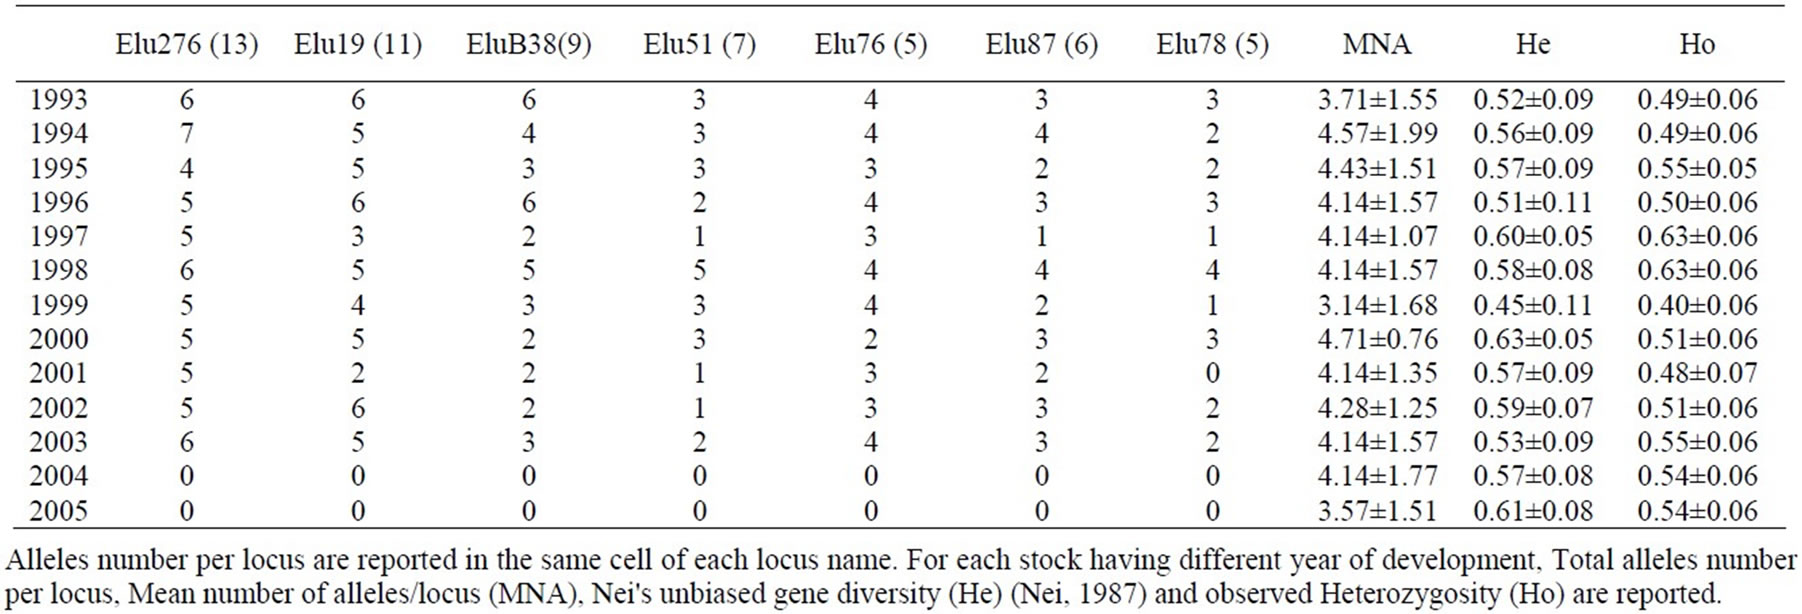
Table 6. Microsatellites analysis.
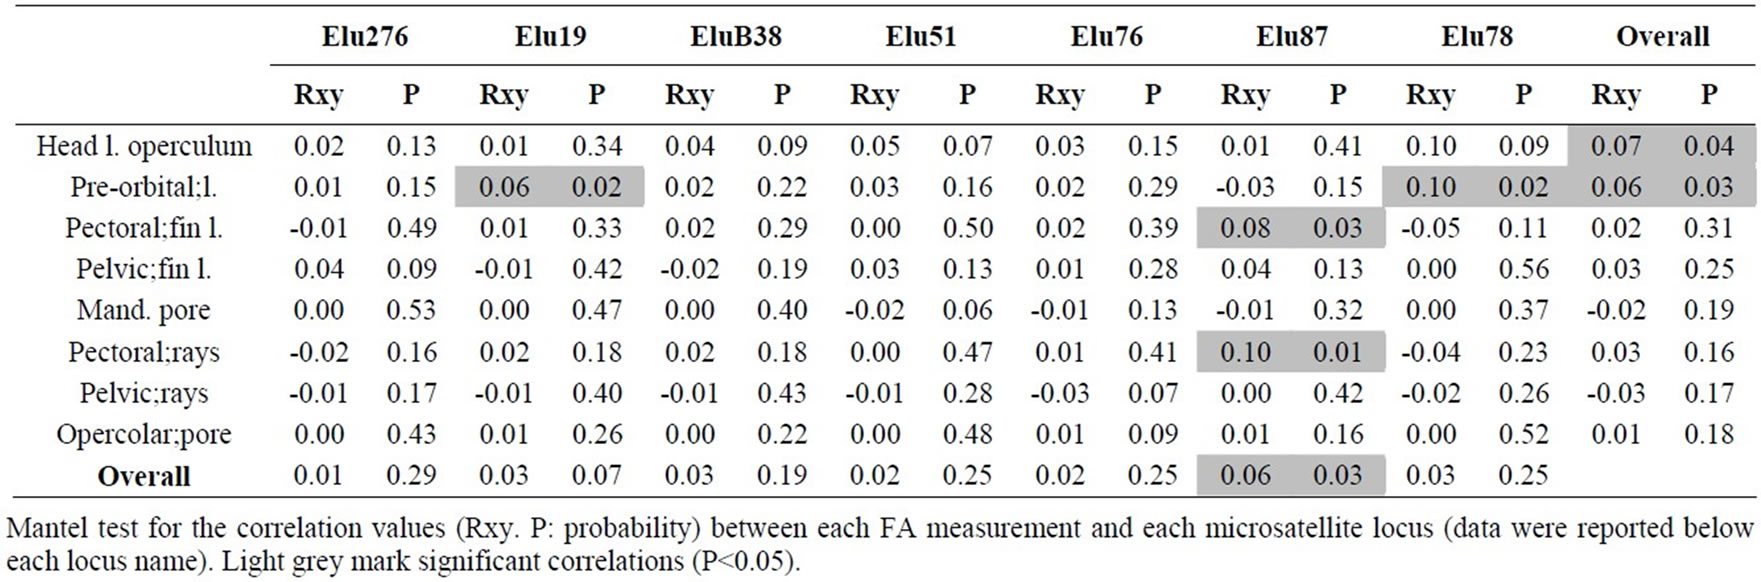
Table 7. Mantel test.
The Mantel test was applied to investigate the relation between each FA parameter and microsatellite data; a positive and significant correlation emerged for the head length to operculum (R=0.07; P=0.04) and for the pre-orbital length (R=0.06; P=0.03) (Table 7). Only Elu87 locus shows a statistical significant correlation versus total FA (R=0.06; P=0.03). Finally, the correlation between each FA parameter versus each locus was analysed, finding several significant comparisons: orbital length vs Elu19 (R=0.06; P=0.02) and vs Elu78 (r=0.10; P=0.02) and the pectoral fin length and the pectoral fin rays vs Elu87 (R=0.08; P=0.03 and R=0.10; P=0.01, respectively).
3.3. Effect of Temperature on Pike Development and Growth
In order to determine the best temperature for pike development, the effect of various water temperatures from 6 to 20°C was investigated in a thermo-regulated room by measuring both the development rate (Figure 3A) and the hatching success (Figure 3B). The experiments were carried out in triplicate and the dead embryos were removed once a day. As expected, results indicated that the incubation time is temperature-dependent (Figure 3A). The ODT was in the range 8–10°C (Figure 3B). Lower and higher temperatures caused drastic embryo mortality (Figure 3C). With a mean water temperature of 12.5°C registered in the Lake Trasimeno during February-March 2002 and of 8.01°C in the same period of 1998, pike embryos hatched in 12.5 and 15.2 days respectively (Figure 3A). These data agreed with those obtained in the laboratory under controlled temperature conditions (Figure 3A). The 562 adult pikes were 1 to 12 years old; their embryonic and larval development occurred between 1993 and 2007; their mean age was 6.8±3.4 and 6.5±3.0 for females and males respectively. Significant differences between length-weight regressions for females (y=5.689x exp0.319) and males (y=4.411x exp0.366) were found (p<0.05). Length at age did not differ significantly between sexes (p>0.05).
4. Discussion
4.1. FA Analysis and Correlation with Chemical and Physical Water Characteristics.
From the 1990s several researches investigated the developmental instability of animals and plants, using FA as a marker of the exposure to different sources of stress. The results obtained were often conflicting and researches that fully approved the use of FA were counterbalanced by several others totally discarding this possibility [13,41–43]. This situation is absolutely normal due to the many mechanisms involved in the development of bilaterality of each organism and it is really difficult to choose a single informative trait to be measured for each species. Several researches directly investigated the influence of temperature on FA, obtaining conflicting results. In some cases FA increased on both ends of a temperature range that was considered as the optimal for the development of one species. In other cases, e.g. with Musca domestica [37] or Aphis gossipyii [1], FA increased at lower temperatures, while with Asellus aquaticus [44] and Culex pipiens [45] FA increased with temperature increase. The Kruskall-Wallis test performed in this study shows that differences between thermal conditions are statistically significant for the eight characters and the total indexes (Table 3). Subsequently, years were ranked according to the asymmetry level of such characters using Bonferroni’s multiple range test, highlighting different metabolic responses according to which of the three temperature ranges was considered. In particular, the correlation between FA and temperature increase agreed with previous observations [44,45]. These data showed that temperatures higher than

Figure 3. A. Relationship between developmental stages and time (hours of development). Data from two different years of development (1998 and 2001) and from laboratory-controlled experiments at 8°C; B. Relationship between duration of development and temperature. Data from this study (square) and from Lindroth (rhombus); C. Influence of temperature on the survival percentage of fertilized eggs to hatching. Four independent data set from this study (data sets from 1 to 4) compared with data reported by Raat, 1988 [49]).
8°C created a more stressful growth environment, confirmed by a definitely greater asymmetric level of the total morphometric indexes (8.11) as compared to the other indexes (6.57 and 7.31). As suggested by the Kruskall-Wallis test, temperature being equal, analysed traits showed different FA levels and just a few characters developed correctly. However, all traits showed sensibility to temperature, as suggested by the lower asymmetry levels in northern pikes reared at a lower temperature. It has been demonstrated that chronic thermal stress on coho salmon produced selectively lethal and sub-lethal effects, that directly shaped FA and fitness profiles [46]. It is evident that for some characters, particularly the head length at operculum, FA decreased during the analysed period, while for other characters FA variations did not seem related to temperature oscillations. Considering the possible effect of water chemical and physical parameters on FA, it was clear that morphometric characters, particularly those related to the head (Table 5), seemed the least canalized. In fact, 10 over a total of 15 significant correlations concerned two head-characters (head length to operculum and pre-orbital length) and the remaining 5 concerned the pectoral fin length. Furthermore, with the sole exception of a negative correlation between pectoral fin length and orthophosphates, the other 14 correlations concerned five environmental parameters: pH, ammonia, conductibility, chloride and sulphates. Among these, the positive correlations found for pH and ammonia underlined that an increment of these values seemed detrimental for the development of northern pike, as already underlined by several data on the stressing power of pH and the use of FA as a measure of pH-related stress.
4.2. Correlation between FA and Microsatellite Data
The Mantel test was performed to test three kinds of correlations: first, correlations between microsatellite and FA pairwise distances, then correlations between microsatellite and each FA parameter and, finally, correlation between each FA parameter and each microsatellite locus. This research reported several highly significant correlations among FA and microsatellite data. Among the former series of correlations emerged those of the year 2005 (R=-0.44; P=0.01) and overall (R=0.06; P=0.02) (Table 7). Among the second group of correlations that were performed, the significant correlation between head length to operculum and pre-orbital length with microsatellite data is of particular interest; these FA parameters, in fact, we are the same showing significant correlations with some chemical and physical parameters (Table 5). Furthermore, the locus Elu87 seemed highly related to pectoral fins.
4.3. Effect of Temperature on Pike Development and Growth
The egg development of northern pike is not strictly stenothermal, nevertheless both the speed of development and the survival percentages might be seriously affected by water temperature [49]. The data here reported, as expected, indicate that the incubation time is temperature-dependent (Figure 3A, B) and that the ODT was in the range 8-10°C (Figure 3B, C). Lower and upper temperatures caused drastic embryo mortality, in accord with previous data [49] (Figure 3C). With a mean water temperature of 12.5°C registered in Lake Trasimeno during February-March 2002 and of 8.0°C in the same period of 1998, the pike embryos hatched in 13.5 and 15.2 days respectively. These data correlated well with those obtained in the laboratory under controlled temperature conditions.Overall results for northern pike grown under different thermal conditions showed a nonhomogeneous or comparable growth. ANCOVA analysis demonstrated, separately for both sexes (p<0.05), that length-weight regressions were significantly different in years characterized by different development temperatures. The analysed samples showed that females were slightly bigger and older than males. Length-weight regression underlined that males, length being equal, gained more weight than females. Subdividing the sample according to the mean temperature of the year of development, the length weight regression calculated for the entire sample coincided with the data of stocks developed at temperatures ranging from 5 to 8°C. For both females and males, length being equal, stocks under 5°C gained more weight than those over 8°C (data not shown). These data do not agree completely with those reported here for FA, but are congruent with the knowledge that fishes grown in cold water, such as those of Northern Europe, have a slowest but greater growth as compared to fishes grown in warmer water.
These data suggest the possibility of periodic stress, caused by the water temperature during the developmental and larval phases that might influence juvenile and adult growth.
The data reported in this study demonstrate that thermal conditions are a source of variability having monitorable influences on northern pike’s ontogenesis and agree with previous works indicating that the homeostasis analysis can be a measure of environmental stress. In the large amount of data concerning the thermal conditions of development and metabolic rate of this species the temperatures reported ranged greatly. In conclusion, the exposure to different temperature regimes, near the optimum for northern pike growth, causes short-term effects on developing pike’s FA, particularly on four of the morphometric and meristic traits analysed. Reported data suggest that below 5°C just a few morphological characters were affected, whereas at 8°C and, presumably, at a higher temperature, the exposure has greater measurable effects. Data on ODT, particularly the hatching percentage, suggested an optimum in the range 8-10 °C, i.e. slightly higher than FA range. This difference, as suggested for the relationships between FA and development, could be due to the fact that development and fixation of various characters took place in different winter and spring weeks in which temperature can be greatly varied.
However, the relative breeding easiness of this species may be a valid tool for the estimation of controlled environmental stress influences, not only of thermal origin, and a valid informational basis for studies on wild populations.
5. Conclusions
In agreement with Bobbit [1], our results agreed with the assumption that temperature increase might increase molecular perturbations and, subsequently, the global developmental noise during development. As argued by Moller and Manning [5], several findings underlined an inverse correlation between FA and growth rate, as in high-density breed chickens, suggesting that FA could really be considered a measure of animal welfare. Our results showed robust correlations, both positive and negative, between some FA parameters and chemical and physical characters. The positive correlation of FA data and pH is of particular interest, considering the great impact of pH variations in several lentic ecosystems. Nevertheless, our results underlined also that the analysed biological data set could not be entirely considered as valid, and that the potential use of FA as a measure of pH-related stress should not be considered valid a priori, but should be tested for each species and for different characters. Wiener and Rago [47] demonstrated in Bluegills (Lepomis macrochirus Rafinesque) that FA in adult fishes was judged to be insensitive as a potential measure of pH-related stress. Among the negative correlations, those found between FA values and conductibility and chloride could indicate that northern pike canalized better the head development under a mild salinity. These data could be compatible with the presence of northern pike in briny waters, where well structured populations were found [18,48]. Unfortunately, the data here reported are difficult to compare with those reported by Jacobsen et al., [18] on the short-term salinity tolerance of northern pike fry related to temperature and size because of differences in temperature ranges and measurement protocols. Finally, at present it is difficult to understand and judge the positive correlation between the FA of head parameter and pectoral fin length and sulphates; the only hypothesis is that sulphates could lower pH values, influencing indirectly FA levels.
It has long been debated whether FA levels depend upon genetic variability, the particular molecular marker notwithstanding. Many studies favour such a relationship and as many studies rejecting it (see Moller and Manning [5] for a review). The question is not just whether an excess or a deficiency of heterozygosis might influence FA levels, but also whether it is possible to use one or more molecular markers to understand better FA data. Microsatellites are particularly informative on northern pike. Three types of DNA sequence feature satisfy requirements for genetic mapping: restriction fragment length polymorphisms (RFLPs), single nucleotide polymorphisms (SNPs) and simple sequence length polymorphisms (SSLPs), which comprise microsatellites. Therefore we decided to perform the comparison of genetic distances and FA through seven already tested microsatellites loci. The here performed Mantel tests showed very interesting correlations between FA and the investigated microsatellites. Unfortunately, no linkage map was investigated for this species and for these microsatellites loci, so that it was impossible to determine the relationships between the FA parameter and the microsatellite loci defined as correlated by the Mantel test. We shall test other molecular markers on these samples, in particular AFLP patterns, to compare FA and genetic polymorphism levels and to understand better the relationships between genetic variability and fine tuning development.
6. Acknowledgment
We are grateful to Mr. Romano Dolciami and Dott. Mauro Natali—Centro Ittiogenico of the Provincia di Perugia for helping us in providing northern pike samples and to ARPA (Agenzia Regionale Per l’Ambiente—Region Umbria, Italy) for providing chemical and physical data.
REFERENCES
- G. A. Babbitt, “How accurate is the phenotype? - An analysis of developmental noise in a cotton aphid clone,” BMC Developmental Biology, Vol. 8, No. 19, pp. 1–9, February 2008.
- P. Gienapp, C. Teplitsky and J. S. Alho, J. A. Mills, and J. Merila, “Climate change and evolution: disentangling environmental and genetic responses,” Molecular Ecology, Vol. 17, No. 1, pp. 167–178, July 2008.
- A. P. Moller and J. P. Swaddle, “Asymmetry, developmental stability, and evolution,” In: Oxford series in ecology and evolution, Oxford University Press, 1997.
- S. Van Dongen, “What do we know about the heritability of developmental instability? Answers from a bayesian model,” Evolution, Vol. 61, No. 5, pp. 1033–1042, May 2007.
- O. P. Moller and J. Manning, “Growth and developmental instability,” Veterinary Journal, Vol. 166, No. 1, pp. 19–27, July 2003.
- R. Palmer and C. Stobeck, “Fluctuating asymmetry as a measure of developmental stability: implications of non-normal distribution and power of statistical test,” Acta Zoologica Fennica, Vol. 191, pp. 57–72, June 1992.
- P. Siikamaki, A. Lammi and K. Mustajarvi, “No relationship between fluctuating asymmetry and fitness in Lychnis viscaria,” Evolutionary Ecology, Vol. 16, No. 6, pp. 567–577, December 2002.
- O. Johnson, K. Neely, and R. Waples, “Lopsided fish in the Snake River Basin – fluctuating asymmetry as a way of assessing impact of hatchery supplementation in chinook salmon, Oncorhynchus tshawytscha,” Environmental Biology of Fishes, Vol. 69, No. 4, pp. 379-393, March 2004.
- X. Chang, B. Zhai, M. Wang, and B. Wang, “Relationship between exposure to an insecticide and fluctuating asymmetry in a damselfly (Odonata, Coenagriidae),” Hydrobiologia, Vol. 586, No. 1, pp. 213-220, April 2007.
- M. S. Eriksen, A. M. Espmark, T. Poppe, B. O. Braastad, R. Salte, and M. Bakken, “Fluctuating asymmetry in farmed Atlantic salmon (Salmo salar): also a maternal matter?,” Environmental Biology of Fishes, Vol. 81, No. 1, pp. 87-99, January 2008.
- L. Lucentini, M. Lorenzoni, F. Panara, and M. Mearelli, “Effects of shortand long-term thermal stress in perch (Perca fluviatilis L.) determined through fluctuating asymmetry and HSP70 expression,” Italian Journal of Zoology, Vol. 69, No. 1, pp. 13-17, November 2002.
- Sinclair and A. A. Hoffmann, “Developmental stability as a potential tool in the early detection of salinity stress in wheat,” International Journal of Plant Sciences, Vol. 164, No. 2, pp. 325-331, August 2003.
- P. Fey and J.A. Hare, “Fluctuating asymmetry in the otoliths of larval Atlantic menhaden Brevoortia tyrannus (Latrobe) - a condition indicator?” Journal of Fish Biology, Vol. 72, No. 1, pp. 121-130, January 2008.
- K. Iguchi, K. Watanabe, and M. Nishid, “Validity of fluctuating asymmetry as a gauge of genetic stress in ayu stocks,” Fisheries Science, Vol. 71, No. 2, March 2005.
- M. Lorenzoni, M. Corboli, A. J. M. Dörr, M. Mearelli, and G. Giovinazzo, “The growth of pike (Esox lucius Linnaeus, 1758) in Lake Trasimeno (Umbria, Italy),” Fisheries Research, Vol. 59, No. 1–2 , pp. 239–246, 2002.
- P. A. Nilsson, C. Skov, and J.M. Farrell, “Current and future directions for pike ecology and management: a summary and synthesis,” Hydrobiologia, Vol. 601, No. 1, pp. 137–141, April 2008.
- L. Lucentini, A. Palomba, L. Gigliarelli, G. Sgaravizzi, C. Ricciolini, M. E. Puletti, H. Lancioni, L. Lanfaloni, and F. Panara, “Northern Pike: A Species In Crisis?” In: Alexandra M. Columbus and Luke Kuznetsov. Endangered Species: New Research. ISBN: 978-1-60692-241-5, 2009b.
- B. Jacobsen, M. M. Hansen, and V. Loeschcke, “Microsatellite DNA analysis of northern pike (Esox lucius L.): insights into the genetic structure and demographic history of a genetically depauperate species,” Biological Journal of the Linnean Society, Vol. 84, No. 1, pp. 91-101, February 2005.
- S. Launey, F. Krieg, J. Morin, and J. Laroche, “Five new microsatellite markers for northern pike (Esox lucius),” Molecular Ecology Notes, Vol. 3, No. 3, pp. 366–368, September 2003.
- J. C. Nicod, Y. Z. Wang, L. Excoffier, and C. R. Largiader, “Low levels of mitochondrial DNA variation among central and southern European Esox lucius populations,” Journal of Fish Biology, Vol. 64, No. 5, pp. 1442–1449, April 2004.
- R. Ahas, “Long-term phyto-, ornithoand ichthyophenological time-series analyses in Estonia,” International Journal of Biometeorology, Vol. 42, No. 3, pp. 119–123, February 1999.
- J. M. Casselman, E. J. Crossman, P. E. Ihssen, J. D. Reist, and H. E. Booke, “Identification of muskellunge northern pike and their hybrids,” Special Publication of American Fisheries Society, Vol 15, No. 1, pp. 14–46, 1986.
- J. Winfield, J. B. James, and J. M. Fletcher, “Northern pike (Esox lucius) in a warming lake: changes in population size and individual condition in relation to prey abundance,” Hydrobiologia, Vol. 601, No.1, pp. 29–40, April 2008.
- L. Lucentini, A. Palomba, L. Gigliarelli, H. Lancioni, M. Natali, and F. Panara, “Microsatellite polymorphism in Italian populations of northern pike (Esox lucius L.),” Fisheries Research, Vol. 80, No. 2–3, pp. 251–262, September 2006.
- L. Lucentini, A. Palomba, L. Gigliarelli, G. Sgaravizzi, H. Lancioni, L. Lanfaloni, M. Natali, and F. Panara, “Temporal changes and effective population size of an Italian isolated and supportive-breeding managed northern pike (Esox lucius) population,” Fisheries Research. Vol. 96, No. 2–3, pp. 139–147, March 2009a.
- L. Lucentini, A. Carosi, R. Erra, G. Giovinazzo, M. Lorenzoni, and M. Mearelli, “Fluctuating asymmetry in Perch (Perca fluviatilis L.) from three lakes of the region Umbria (Italy) as a tool to demonstrate the impact of man-made lakes on developmental stability,” Atti CEI IX, 1997.
- M. J. Servia, F. Cobo, and M. A. González, “Effects of short-term climatic variations on fluctuating asymmetry levels in Chironomus riparius larvae at a polluted site,” Hydrobiologia, Vol. 523, No. 1–3, pp. 137-147, July 2004.
- J. Pither and P. D. Taylor, “Directional and fluctuating asymmetry in the black-winged damselfly Calopteryx maculata (Beauvois) (Odonata: Calopterygidae),” Canadian Journal of Zoology, Vol. 78, No. 10, pp. 1740–1748, June 2000.
- S. A. Øxnevad, K. Østbye, and L. A. Vøllestad, “Year class variation in fluctuating asymmetry in perch (Perca fluviatilis L.) from an acidic aluminium-rich lake,” Ecology of Freshwater Fisheries, Vol.3, pp.131–137, June 1995.
- L. M. Miller and A. R. Kapuscinski, “Microsatellite DNA markers reveal new levels of genetic variation in pike,” Transactions of American Fishery Society, Vol.125, No.6, pp. 971–977, November 1996.
- L. M. Miller and A. R. Kapuscinski, “Historical analysis of genetic variation reveals low effective population size in a northern pike (Esox lucius) population,” Genetics, Vol. 147, No. 3, pp. 1249–1258, November 1997.
- B. S. Weir, and C. C. Cockerham, “Estimating F-statistics for the analysis of population structure,” Evolution, Vol.38, No. 6, pp. 1358–1370, May 1984.
- P. E. Smouse, J. C. Long, and R. R. Sokal, “Multiple regression and correlation extensions of the Mantel test of matrix correspondence,” Systematic Zoology, Vol. 35, No. 4, pp. 627–632, 1986.
- B. Kimmel, W. W. Ballard, S.R. Kimmel, B. Ullmann, and T. Schilling, “Stages of embryonic development of the zebrafish,” Developmental Dynamics, Vol. 203, No. 3, pp. 253–310, July 1995.
- J. D. Shardo, “Comparative embryology of teleostean fishes. I. Development and staging of the American Shad, Alosa sapidissima (Willson, 1811),” Journal of Morphology, Vol. 225, No.2, pp. 125–167, February 1995.
- R. F. Leary, F. W. Allendorf, and K. L. Knudsen, “Genetic, environmental, and developmental causes of meristic variation in rainbow trout,” Acta Zoologica Fennica, Vol. 191, pp. 79–95, 1992.
- J. W. Chapman and D. Goulson, “Environmental versus genetic influences on fluctuating asymmetry in the house fly, Musca domestica,” Biological Journal of the Linnean Society, Vol. 70, No. 3, pp. 403–413, July 1998.
- W. B. Campbell, J. M. Emlen, and W. K. Hershberger, “Thermally induced chronic developmental stress in coho salmon: integrating measures of mortality, early growth, and developmental instability,” Oikos, Vol. 81, No. 2, pp. 398–410, January 1998.
- W. L. Seddon, “Mechanisms of temperature acclimation in the channel catfish Ictalarus punctatus: isozymes and quantitative changes,” Comparative Biochemistry and Physiology, Vol. 118, No.3, pp. 813–820, November 1997.
- S. Watabe, J. Imai, M. Nakaya, Y. Hirayama, Y. Okamoto, H. Masaki, T. Uozumi, I. Hirono, and T. Aoki, “Temperature acclimation induces light meromyosin isoforms with different primary structures in carp fast skeletal muscle,” Biochemical and Biophysical Research Communications, Vol. 208, No. 1, pp. 118–25, March 1995.
- S. Prentice, A. P. Jobes, and G. Burness, “Fault bars and fluctuating asymmetry in birds: are the two measures correlated?,” Journal of Field Ornithology, Vol. 79, No. 1, pp. 58–63, March 2008.
- V. L. Vershinin, E.A. Gileva, and N.V. Glotov, “Fluctuating asymmetry of measurable parameters in Rana arvalis,” Russian Journal of Ecology, Vol. 38, No. 1, pp. 72–74, February 2007.
- E. Zachos, G. B. Hartl, and F. Suchentrunk, “Fluctuating asymmetry and genetic variability in the roe deer (Capreolus capreolus): a test of the developmental stability hypothesis in mammals using neutral molecular markers,” Heredity, Vol. 98: pp. 392–400, March 2007.
- A. Savage and P. J. Hogarth, “An analysis of temperature-induced fluctuating asymmetry in Asellus aquaticus,” Hydrobiologia, Vol. 411, No. 0, September 1999.
- M. Mpho, A. Callaghan, and G. J. Holloway, “Temperature and genotypic effects on life history and fluctuating asymmetry in a field strain of Culex pipiens,” Heredity, Vol. 88, No. 4, pp. 307-312, November 2002.
- W. E. Bradshaw and C. M. Holzapfel, “Genetic response to rapid climate change: it’s seasonal timing that matters,” Molecular Ecology, Vol. 17, No. 1, pp. 157–166, September 2008.
- J. G. Wiener and P. J. Rago, “A test of fluctuating asymmetry in Bluegills (Lepomis macrochirus Rafinesque) as a measure of pH-related stress,” Environmental Pollution, Vol. 44, No. 1, pp. 27–36, June 1987.
- L. Laikre, L. M. Miller, A. Palmé, S. Palm, A.R. Kapuscinski, G. Thoresson, and N. Ryman, “Spatial genetic structure of northern pike (Esox lucius) in the Baltic Sea,” Molecular Ecology, Vol. 14, No.7, pp. 1955–1964, May 2005.
- A. J. P. Raat, “Synopsis of biological data on the northern pike, Esox lucius Linnaeus, 1758,” FAO Fisheries Synopsis, No. 30, rev. 2, p. 178, 19.
NOTES
Research partially funded by grants of the University of Perugia and by the project FISR-MICENA 2006-2009.