Journal of Service Science and Management
Vol.6 No.1(2013), Article ID:28956,16 pages DOI:10.4236/jssm.2013.61009
An Empirical Evaluation of the ISO 9001 Quality Management Systems for Certified Work Organizations in Kuwait as Benchmarked against Analogous Swedish Organizations
![]()
1School of Mechanical and Manufacturing Engineering, Dublin City University, Dublin, Ireland; 2Mechanical Engineering Department, King Fahd University of Petroleum and Minerals, Dhahran, KSA; 3Department of Quantitative Methods & Information Systems, Kuwait University, Kuwait City, Kuwait.
Email: salahy2k@hotmail.com
Received November 10th, 2012; revised December 15th, 2012; accepted December 25th, 2012
Keywords: Motives; Commitment; Auditing; Certification Bodies; ISO 9001:2008; QMS; Continual Improvement; Customer Satisfaction
ABSTRACT
The purpose of this paper is to investigate and explore the quality management system (QMS) of the ISO 9001 certified work organizations in Kuwait and evaluate their expectation and satisfaction levels with respect to the auditing procedures performed by various well-known certification bodies. The research has addressed multiple quality principles through a well-designed, verified and validated questionnaire. The research was based on 98 valid responded questionnaires as format (A) and 69 items as format (B). Thus, two formats were distributed for each organization under the study. Formats (A) and (B) are tailored toward quality managers or quality management representatives and non-quality related employees respectively, in the same organization. The differences in attitudes and awareness level between these two categories are statistically measured. Furthermore, for the purpose of benchmarking, some of the research results are compared against previous research results conducted in Sweden.
1. Introduction
Over the last decade, working sectors in Kuwait have witnessed high motivations to go with the implementation of available management system standards. The one that is most popular standard is the ISO 9001 quality management systems. Researchers have taken the responsibility to investigate whether there are perceived benefits for those organizations seeking ISO 9001:2008 standard certificate. Such a research was done before, from different perspectives, in different countries of the same region and worldwide. It has been found that Kuwait was one of the countries which has been missed for evaluation in the ISO 9001 quality management system (QMS) from the perspective of end users. End users in this research are the government and private sectors which have already been certified as per ISO 9001:2008 quality management system standards. From literature review, there were several investigative and comparative studies on the effect of ISO 9001 implementation in different countries. The author in [1] has researched the TQM practices only in the food and refractor industries in Kuwait, a decision was made to take a step further and generally target and focus on the ISO certified organizations regardless of their business sectors types. Therefore, it was agreed, initially, to perform quality auditing assessment of Kuwaiti ISO certified work organizations and obtain their views to give some indication of the current status of organization QMS as per ISO 9001 standard systems. Then, a comparative analysis between Kuwait and Sweden would be carried out to see if there are any statistically significant differences between the two cultural views. The analysis is basically stemmed from the view point of customers toward the auditing process as being conducted by the external auditor. The authors in [2] have discussed—beyond compliance with the standard—the added value from external auditing. Focus on the added value of auditing will eventually explore other quality management system parameters such as customer satisfaction level, top management commitment, improvements, and involvement of people. This may give birth to questions such as: Why is it necessary to compare Kuwait with Sweden? It could be argued that this is necessary in order to benchmark the ISO 9001 certified Kuwaiti organizations against other international work organizations for the purpose of understanding the gaps and differences in ISO 9001 implementation. It could possibly yield suggestions of ways to narrow these gaps by improving the existing ISO 9001 QMS in Kuwait, adding value and contributing further quality experience in the research history. Therefore, it has been decided to begin this research in Kuwait using a survey as a main research instrument. The survey [3] was originally developed by the Anderson Graduate School of Management at the University of California, Los Angeles. The survey was customized and modified to meet cultural and language differences and be more applicable to the Kuwaiti work organizations and their culture. The next part of this paper will describe the literature history of ISO 9001 quality management system implementation in different regions of the world.
2. Literature Survey
Before proceeding and dwelling into the topic of our research, it would be imperative that a reader at minimum have some knowledge of ISO 9001 standard. ISO 9001: 2008 standard [4] is part of a whole family of ISO standards that describes the quality management system requirements. ISO 9000 [5] is a family of standards and instructional guidelines for the purpose of quality management system development. The requirements of this standard are documented based on eight quality management principles. These principles [6] are: 1) customer focus; 2) leadership; 3) involvement of people; 4) process approach; 5) system approach to management; 6) continual improvement; 7) factual approach to decision making; and 8) mutually beneficial supplier relationship. These principles were translated into requirements and documented as ISO 9001:2008 standard requirements. Therefore, all work organizations, seeking ISO 9001: 2008 certification, shall adopt these principles and be compliant with the standard requirements. From the standard perspective, the customer is a key player in the whole ISO implementation process. The customer is the determinant factor that can provide a reasonable picture of a quality management system implementation. In order to address the customer focus principle of quality standard, it would be necessary to define customers. In many specialized texts, customers are the end users. However, some customers are considered to be the producers of the services; these are called internal customers. The author in [7] classified customers into three various categories: 1) Powerful; 2) Weak; and 3) Patients). Powerful customers are more influential on their suppliers than weak and patient customers [7]. The authors in [8] showed that customer could put pressure on the work organization to seek ISO 9001 certification. Thus, a customer satisfaction must be the primary vision for any work organization that wishes to seek or maintain a quality management system as per ISO 9001. Customer satisfaction requirement is fully illustrated in the ISO 9001 standard—clause 8.2.1. PDCA Deming’s cycle [4] determines the key components that enhance the customer satisfaction within the certified work organization. These components are management responsibility, resource management, product or service realization, and measurement, analysis and improvement. Part of the organization’s management responsibility is its management commitment toward ISO standard implementation. Top management commitment and involvement of the organization employees are essential towards the ISO 9001 registration [9]. Top management commitment is explicitly apparent if the work organization has: 1) set clear business goals; 2) manufacturing expertise; and 3) adopts the team work philosophy [10]. The author in [11] found a direct relation between commitment and employee job satisfaction. In other words, organizational commitment will be highly enhanced if internal customers are satisfied. The authors in [8] have shown that the willingness and innovation of the organization in implementing ISO 9001 quality system has increased the efficiency of business performance. The author in [12] has shown, in his Canadian case, study that managerial commitment toward ISO 9001 implementation would also increase productivity, overcome problems, and conflicts. The authors in [13] have shown that top management commitment and support is very crucial to make improvement happen in the organization. The authors in [14] have emphasized that organization should be very committed in educating its workforce toward ISO 9001 implementation. This will bring the issue of the awareness factor among organization staff. Therefore, employees’ awareness level will subjectively increase if top management has shown a documented commitment policy and a practical translation of that policy in the same organization. The authors in [15] have shown that top management commitment was a leading factor to a successful ISO 9001 implementation in the work organizations. The author in [16] also indicated the extent of managerial commitment was a fundamental factor behind the success of quality policy implementation. Other results of research have shown specifically the managers’ role in commitment and involvement plays a dominant factor in bringing success to quality implementation [17]. Other researchers in [18] have gone further and identified that the main barrier in implementing a quality program is attributed to the managerial commitment. Similar findings in [19,20] which have also shown that management commitment was behind the success of ISO implementation in the business organizations. Judging the above research work and other additional sources, it could be concluded that customer satisfaction can be achieved, if at least, the managerial commitment takes an active/effective role in quality management system implementation. Therefore, a decision was made to investigate customer satisfaction from all aspects and explore its relation to other possible affecting indicators. Indicators are the focal points of our attention in this research. An emphasis of this research is based on indicators rather than parameters since the latter ones can be obtained with an objective evidence from the audited organization. In other words, it would not make sense to address parameters while these parameters are not physically under your control.
3. Research Objectives and Hypotheses
We have decided to address the value of auditing process in this research, since auditing is considered to be one of the six main required documented procedures [4]— clause 8.2.2—for any certified QMS. Auditing can also ensure an evidential presence of organization compliance with the standard requirements. Since auditing is done by either internal or external party to assure compliance with the standard requirements, the customer in this case will be the work organization itself. Particularly speaking, the certification body will view the certified organization as their own customers. In this paper, the satisfaction level of the organization about the auditing process will be investigated. This will eventually draw a reasonable picture of the certified organization’s quality management system. This approach of studying a QMS is acceptable and more welcomed in the Kuwaiti culture than to have the respondents answer the survey questions directly pertinent to their QMS. Furthermore, it will enhance reliability of the respondents’ answers. Using this approach, several hypotheses were constructed to test for any statistical significance in different aspects of organization’s QMS. These hypotheses are:
1) Hypotheses related to testing motives:
H1: There are no significant differences between the government and private sectors with respect to motives to seek ISO 9001 certification.
H2: There are no significant differences between the business sectors with respect to motives to seek ISO 9001 certification.
H3: Motives are seen significantly different with respect to respondents’ job positions.
H4: Motives are seen significantly different between the quality and non-quality related employees.
2) Hypotheses related to organizations with standard exclusions, clause 7.0 [4]:
H1: Organization with exclusion has an association with cost of certification.
H2: Organization with exclusion has an association with length of auditing.
3) Hypotheses related to auditors (certification bodies):
H1: Auditors perform significantly different from one certification body to another.
H2: There are significant benefits from external auditing besides granting the certificate to the organization.
H3: The choice of certification bodies are dependent on what certification bodies can offer to their customers.
H4: Auditors are seen to perform significantly different from private to government sectors.
H5: Customers evaluate auditors significantly different within the same work organization.
4) Hypotheses related to customer awareness of QMS:
H1: Private and government sectors share the same level of awareness.
H2: Nature of business sectors influences the level of QMS awareness in the work organization.
H3: Job positions play significant role in the QMS awareness level.
H4: Significant QMS awareness level differences exist between quality and non-quality staff.
H5: Enhancing Top management commitment and involvement will improve awareness levels of ISO 9001 implementation within the work organization.
4. Research Methodology, Validity, and Reliability
This research took about 6 months to finish collecting data from all corresponded work organizations. It has taken a considerable amount of effort from the researchers and all participated parties. The authors have started thinking of preparing a list of names for the ISO 9001 certified organizations. The list of names was generously provided by the Public Authority for Industry (PAI) of Kuwait. Since PAI is a governmental sector, it is then considered the most trustable organization to refer to with respect to ISO 9001 certified organization. The list consisted of named governmental and private organizations only. We then had to look further for contact details such as addresses and phone numbers. Eventually, the list summed up to 204 various organizations. 24 of these organizations are governmental. We then customized the research instrument, the survey, previously used by the authors of [2]. The customization was necessary to meet the cultural and research needs. This was done by eliminating a few and adding more questions to also ensure and enhance the validity of the instrument. Before starting using the survey, it was examined by several quality auditing consultants. Then, after minor changes were suggested, it was considered acceptable and understandable by the survey respondents. Unlike the used survey in [2], two surveys were developed to question two different job positions in the same organization. Format (A), with 96 questions, was intended to quality managers or a quality in charge employees and format (B) was intended to non-quality related staff in the same organization. Format (B), with 55 questions, is shorter than format (A) but mainly directed to non-quality personnel in the same organization. Format (A) is longer than format (B) since it has all demographic questions plus questions that can only be answered by quality in charge people. 20% of the contacted organizations were personally interviewed for the purpose of data collection as part of the survey. Other contacted organizations wished to receive the survey by email or fax. However, caution was taken when collecting data over emailed surveys. Thus, follow-up contacts were made continuously with all organizations that were already emailed. It was expected to finish data collection within 4-month period. However, this did not happen because of the slow response from the certified organizations. The response rate was almost 30% for format (A) before the New Year. The deadline for receiving all surveys was then extended for another two months and this increased the response rate to 50%. After reviewing all surveys manually, few emailed responded surveys were omitted for their inconsistency. Hence, the response rate came down to 48% with valid 98 completed surveys. In format (B), a valid 69 completed surveys were collected with lower response rate of 33.8%.
The reliabilities of the responded surveys are 86% and 92% in formats (A) and (B) respectively. The reliability test was done using alpha of Cronbach in SPSS ver. 20. Since Cronbach’s alpha has shown a value higher than 70%, it is statistically agreed that the consistency of the provided answers is reliable enough to proceed with further statistical analysis on the survey items. The survey items are the all printed questions in the survey. Apparently, the resulted alpha in format (B) survey that is higher than in format (A) survey is attributable to format (B) survey being shorter with fewer items.
The survey was constructed to address several aspects of quality management system as per ISO 9001:2008 standard requirements. It was divided into several sections. Each section may have at least one variable for measurement. For instance, the section of Motives has 7 variables or research items. There are 24 sections in format (A) survey, including the demographic questions. While, there are 10 sections in format (B) survey. Unlike the range of scale used by the authors in [2], the responses for the main questions were limited to 5 point likert scale. Most of the surveys are categorized to either 5 or 7 point scale as suggested by the authors of [21,22]. Though the authors in [23,24] suggested that the reliability of the survey would be optimized with 7 point Likert scale, the author in [25] argued that the human mind can only take 6 objects at a time and anything over 6 would be futile. Therefore, a decision was made to use a 5 point likert scale. A 5 point Likert scale is quite understandable for the survey respondents. For instance, category (1) means Strongly disagree; category (2) means Disagree; category (3) means Neutral; category (4) means Agree; and category (5) means Strongly Agree. However, if a 7 point Likert scale was used, it would be almost impossible to give two new descriptions for the new additional category slots. Full statistical analysis was performed on each section. The most important ones which authors found relevant to the topic of this research would be presented clearly in the next section. The analysis was performed using the non-parametric techniques using SPSS ver. 20 and Minitab ver. 16, wherever possible. Since the answer of each question except question (21) in survey— format (A) can be described as either nominal or ordinal, there is a slim chance that nominal or ordinal data to fall to be approximately normal. During data analysis, the normality for most of the collected data was not verified nor justified. This resulted in causing our research analysis to be based on non-parametric methods. Another reason for this is that Likert scaled categories of questions can only produce nominal and ordinal data and should only be analyzed by non-parametric tests [26].
5. Research Results
5.1. Demographic Characteristics in Brief
More focus will be on format (A) of the survey since it has all related demographic inquiries than format (B) which is shorter and directed to non-quality staff in the work organization. Of the 98 surveyed organizations almost 32% are quality assurance or control managers who are directly responsible for maintaining the quality management systems of their organizations. That means that higher proportions of different job categories are delegated to the maintenance of quality management system. Only 12% of the organizations have worldwide branches. 35% of the local organizations have manpower size between 50 - 250 employees. Only 7% has manpower of 1 - 9 employees. 18% of those surveyed were government and 82% were private. The manufacturing sector has a higher certification rate than services sector, 38% as compared to 33% to the services sector. It was also revealed that 46.9% of the certified organizations have permissible exclusion [4] from clause 7 in the ISO 9001 QMS standard. The most well-known certification bodies in Kuwait are BV and SGS. These two certification bodies have certified different organizations with 38% and 20% respectively. 60% of the organizations have reported a cost of certification less than 5000 KD and 40% of them have reported a surveillance audit cost between 500 - 1000 KD. 33% of the certified organizations have experienced single audit duration between 4 - 8 hours with a minimum of one auditor to conduct the auditing process.
5.2. Descriptive and Inferential Analysis with Statistical Comparisons
As mentioned earlier, all survey categorized questions are grouped according to the purpose of its intended measurements. Each group of questions is classified under one main title or dimension. 11 possible dimensions are presented, discussed, and possibly compared against similar research items previously performed in Sweden by the authors in [2]. Research items are meant to be all significant questions in the survey.
5.2.1. Motives for Seeking ISO 9001 Certification
Table 1 lists the 7 variable names (research items), agreed by the authors to measure the motives dimension. The author in [27] has shown that 4 main reasons for an organization to seek certification, which are:
1) customer pressure;
2) improved work efficiency;
3) image/marketing improvement; and 4) Improvement of products.
Further to the above reasons, 3 more reasons were added to enhance the concept of motives. Of the 98 survey respondents (format (A)), means, standard deviations, and the percentage of frequency with responses scaling from very important to extremely important are tabulated for illustrations.
Table 1 presents the perception of the respondents toward the 7 variables of motives. It is clear that improvement of organization image takes the highest priority to the organization and goes down to the lowest priority as reduction of paper works. The authors in [3] have arrived almost to the same figures particularly for the research item “customer pressure/demand”. It was valued as 54%. Thus, 5% difference from our result is quite small. However, the standard deviation seems to be quite high with respect to the other variables’ results. This could be accounted for by the respondent’s misunderstanding of the question. For instance, the definition of a customer has most probably made the respondent think that customer can only be patients not powerful ones that can put pressure on the suppliers as described by the author in [7]. The research item, reduction of paper works, has been ranked the lowest since various organizations seem to have differences about the size of documentation that have to be controlled. In addition to that, the authors in [3] have shown that documentation scored (4.02) on the 5- point likert scale. (4.02) signified the highest implementtation factor for ISO 9001 QMS. Furthermore, a MannWhitney test was performed on this variable to see if there is any significant difference in attitude or perception between the two independent variables, government versus private sector. The result showed that p-value > 0.05, indicating there is no significant difference in the ranked mean scores for private and government sectors with respect to reduction of paper works. Thus, it is reasonable to notice a low ranked percentage for the research item “reduction of paper works”.
The following are the results of testing motives against demographic characteristics:
1) There were no statistically significant differences in motives between respondents of the government and private sectors. A Mann-Whitney test was performed on each variable of the motives dimension and a p-value > 0.05
Table 1. Motives for seeking certification with means and standard deviations (SD).
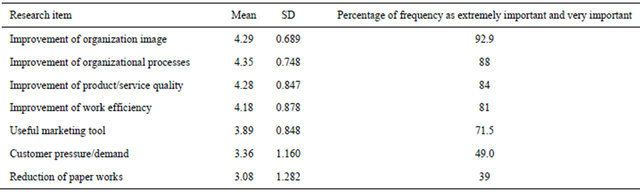
Note: mean and standard deviation (SD) are calculated based on the nominal 5-point Likert scale, such as 1) Not important at all, 2) Slightly important, 3) Fairly important, 4) Very Important, and 5) Extremely Important.
for every single variable indicated the failure of rejecting the null hypothesis.
2) There were no statistically significant differences in motives between the respondents of the 5 various business sectors. The counterpart of ANOVA in non-parametric analysis, Kruskal Wallis test, was used instead since the normality assumption was not justified for the motives variables. The results showed no single p-value < 0.05, which concluded the failure to reject the hypothesis of no differences. These results did not agree with results obtained by the authors in [28], who have studied 472 New Zealand organizations and have found that motivations were different and dependent on the organization type.
3) There were no statistically significant differences in motives between the respondents with 7 different job positions. Kruskal Wallis test was performed and concluded the failure to reject the null hypothesis since p-value > 0.05 for all motives variables. The seven different job positions categorized in this survey are: management representatives; quality control and assurance managers; business or operations manager; plant or general managers; administrative officers; technical officers or engineers; and administrative officers or supervisors.
4) There were only two statistically significant differences in the motives variables between the respondents of quality and non-quality related employees. The differences occurred in the research item “useful marketing tool” and “improvement of work efficiency”. The useful marketing tool variable resulted with a p-value = 0.029, and the improvement of work efficiency variable resulted with a p-value = 0.052, that is on the border of the significance level. The result can be explained since nonquality employees may not be aware of the marketing advantage for an organization with certification, though the other variable, improvement of work efficiency, did not show a much statistically significant difference. It would then be appropriate to conclude that non-quality related employees find an ISO implementation as a barrier to perform their tasks efficiently. Most probably the documentation requirement could be considered another job burden on the non-quality people; mainly those who work in factories and are already preoccupied doing their main tasks. This conclusion would line up with the author’s findings in [29] who stated that ISO 9000 was nothing just a paper driven process for bureaucrats to approve.
Table 2 summarizes the calculated p-values for all differences studied above from (1-4) which have shown at least 95% of the time insignificant differences are a dominant case in the research items for motives.
5.2.2. Motives for the Choice of Certification Bodies
PAI for the state of Kuwait has provided us with 4 main certification bodies responsible for issuing ISO 9001 certificates. These are BV, SGS, TUV Rheinland, and TUV Nord. There are others such as Intertek, RIMA, DNV and others that have a minimum market share in the ISO 9001 certification business. Table 3 describes the reason for choosing a specific certification body. For comparison purposes, tables from [3] were included to see the differences in attitude for such a dimension. A selection compatibility between Swedish and Kuwaiti organizations can be seen in choosing a reputational certification body as a first priority. Also, a compatibility of selection is obvious with certification body being the least expensive among other certification bodies.
5.2.3. Organizations with Permissible Exclusion
ISO 9001 standard permits organizations seeking certifications to have exclusion from the standard requirements and only in clause 7.0 and its sub clauses if a seeking
Table 2. Calculated p-values for motives based on 4 categories: organization types, 5 business sectors, 7 job positions, and quality and non-quality positions.
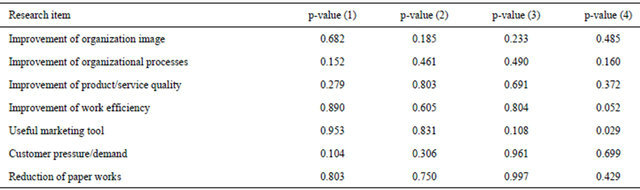
p-value (1): p-values for differences in motives between government and private sectors, p-value (2): p-values for differences in motives among five different business sectors, p-value (3): p-values for differences in motives among seven job positions, p-value (4): p-values for differences in motives between quality and non-quality job positions.
Table 3. Motives for the choice of certification bodies.
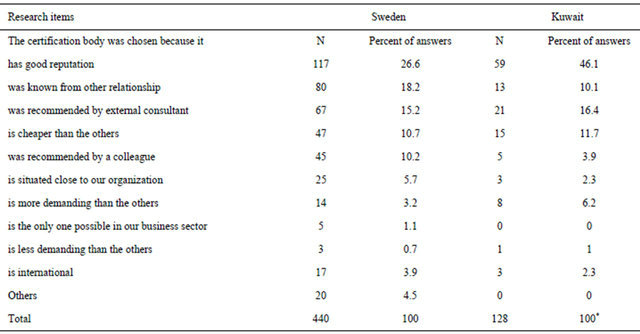
Note: *The total is greater than surveyed people (98 individuals) which it represents the total number of different selections made for a single research item (a survey question), meaning that a surveyed individual could have answered the same question with multiple answers such as good reputation and was known from other relationship were both chosen.
organization can justify the need for this exclusion [4]. From the survey, it was found that 46.9% of the certified organizations have been excluded from clause 7.0 or its sub clauses (7.3, 7.5.1, 7.6, etc.). For further investigation, several hypothesis tests were conducted and results showed the following:
1) There is an association between the cost of the audit and whether the organization is excluded from clause 7.0. This was done using the non-parametric chi square test. The p-value = 0.030 < 0.05, indicates enough evidence of statistical significance to reject the null hypothesis that there is no association between the cost and exclusion.
2) There is no association between the length of audit and organization with exclusion since the p-value = 0.102 > 0.05, almost twice the significance level. This was also done using the chi square non-parametric test. Therefore, the proposed hypothesis had failed to be true.
Another hypothesis test was performed on whether two proportions for the organizations with exclusion and ones without are equal. The result revealed a p-value = 0.544 > 0.05, statistically insignificant differences. This would be an indication that the half numbers of the certified organizations have permissible exclusion from the standard requirement in clause 7.0 of ISO 9001.
5.2.4. Role of External Auditors
Table 4 combines the results of Swedish survey and Kuwaiti survey in regard to the audit process and auditor’s role as they are perceived by the certified organization. The comparison was done against results of Kuwaiti survey in format (A) only. As mentioned earlier the scaling used by the authors in [2] was categorized from an ordinal value = 1 to a value = 7. Therefore, a caution of conversion must be taken. The authors in [30] suggested a conversion method that yields a higher R squared value, which is the linear regression method, is mathematically better to use. The authors in [30] preferred this method to the simple proportional transformation (either multiplying by 5/7 or 7/5) because it is empirically improved and has an error term as a constant. The derived linear formula for converting data from 7 to 5 point Likert scale is as in Equation (1)
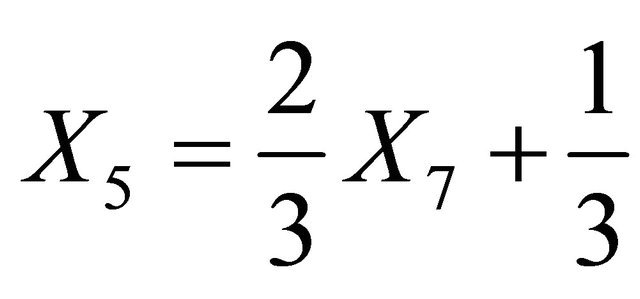 (1)
(1)
where  is the calculated value on 7 point likert scale and can take any ordinal value of 1, 2, 3, 4, 5, 6, 7.
However, the above equation will not be used here since our interest is to check for any significant differences in the attitudes between the quality related employees in two different cultures, Kuwait and Sweden. The statistical method that would be most appropriate and robust for comparison is to use the t-test of the differences between two population means. Before the t-test was applied for means differences of the percentages using Minitab software package ver. 16, a conversion to percentages for
Table 4. The Role of ISO 9001 auditor as perceived by Swedish and Kuwaiti organizations.
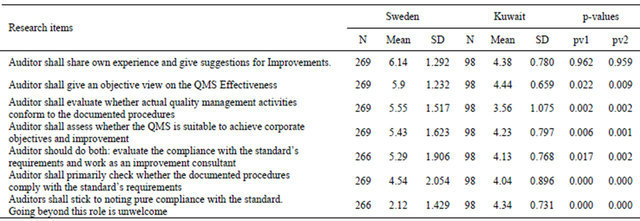
N: Total Surveyed, SD: Standard Deviation. Used scaling: Sweden: 1-7 point Likert scale, 1. Strongly disagree, and 7. Strongly agree. Kuwait: 1-5 point Likert scale, 1) Strongly disagree, 2) Disagree, 3) Neutral, 4) Agree, and 5) Strongly agree. pv1: p-value calculated when both variances are assumed equal. pv2: p-value calculated when both variances are assumed unequal.
the means and standard deviations was conveniently made to Table 4. The conversion was done by dividing each research items’ parameters (mean and standard deviation) by 7 and 5 to Sweden and Kuwait variables respectively. After performing the t-test of means differences for all research items in Table 4 that the two means are equal, surprisingly the result came out to be that means were different for all items except for the research item with regard to the sharing of auditor’s experience in which the p-value resulted to be >0.05. The remaining research items have shown significant differences between the two work organization cultures. This is an indication that respondents of Kuwait survey have stronger attitude toward agreeing with the role of auditors and audit process than respondents of the Swedish surveys. The result of the test supported the alternative hypothesis where means are different under the assumptions that whether the variances of the percentages are equal or not.
The same principle was applied to investigate the attitudes of employees in the same organization. Table 5 describes the outcomes of survey for format (A) and format (B). This test of hypothesis was not done by the authors in [2]. However, it is justifiable to perform such a test since auditing is carried out on different functions of the organization. Therefore, a hypothesis test was conducted to see if quality related employees have different views from non-quality related employees with respect to auditors’ role and audit process. Using Mann-Whitney non-parametric test, there was only one research item “Auditor shall share own experience and give suggestions for improvements” that was statistically significant with p-value = 0.014. This indicates that quality and non-quality staff disagree on whether the auditor shall provide improvement ideas to the existing QMS. However, according to ISO 19011 auditing guidelines document in [31], the auditor’s job is not necessarily to provide the audited organizations with business improvement ideas; as this is the role of a consultant.
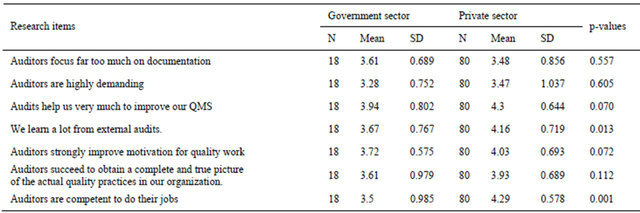
5.2.5. Auditor’s Performance as Perceived by the Audited Organizations
Table 6 presents how auditors’ performances are seen by the respondents according to 7 criteria in the two countries, Sweden and Kuwait. The research item “Auditors make too little demand” was omitted from the research to avoid redundant questions”. The response of such a question can be the complement of the research item “Auditors are highly demanding”. A t-test of means differences for percentages was performed and the result showed differences are statistically significant except for the last research item mentioned in Table 6, “Auditors are competent to do their jobs”. It showed that Kuwaiti and Swedish respondents at least agree positively on the competence of auditors since the p-value > 0.05.
The comparison was also performed between two job categories in Table 7. The two job categories are the quality and non-quality employees. This was again addressed to study the differences in results between the two formats, format (A) and format (B). Using MannWhitney non parametric test, it was found that a p-value, only in one research item, is <0.05. The respondents differ in views of “auditors that focus far too much on documentation”. The other research items resulted with no differences in attitudes between the two job categories. The respondents almost differed on the research item “We learn a lot from external audits”, since p-value = 0.058 almost =0.05. A t-test of means of percentage differences was also performed and resulted a p-value = 0.057 almost nearly to make a decision toward the attitude
Table 5. The role of ISO 9001 auditor as perceived by quality and non quality related employees in the Kuwaiti organizations.
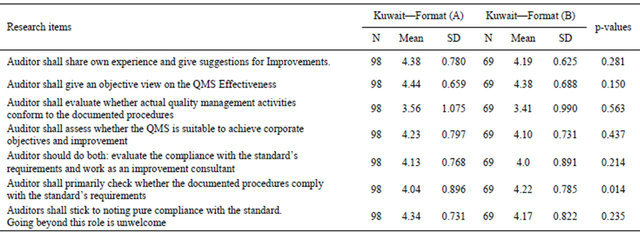
N: Total Surveyed, SD: Standard Deviation. Used scaling: 1-5 point Likert scale, 1) Strongly disagree, 2) Disagree, 3) Neutral, 4) Agree, and 5) Strongly agree.
Table 6. Auditors’ performances as perceived by Swedish and Kuwaiti organizations.
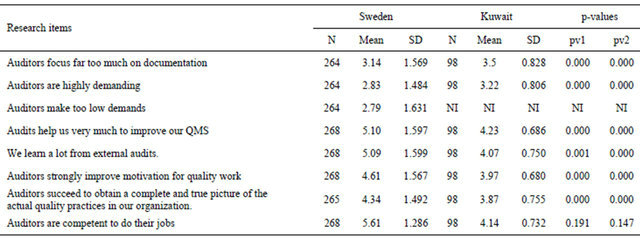
N: Total Surveyed, SD: Standard Deviation, NI: Not investigated. Used scaling: Sweden: 1-7 point Likert scale, 1) Strongly disagree, and 7) Strongly agree. Kuwait: 1-5 point Likert scale, 1) Strongly disagree, 2) Disagree, 3) Neutral, 4) Agree, and 5) Strongly agree. pv1: p-value calculated when both variances are assumed equal. pv2: p-value calculated when both variances are assumed unequal.
Table 7. Auditors’ performances as perceived by quality and non quality employees in the Kuwaiti organizations.
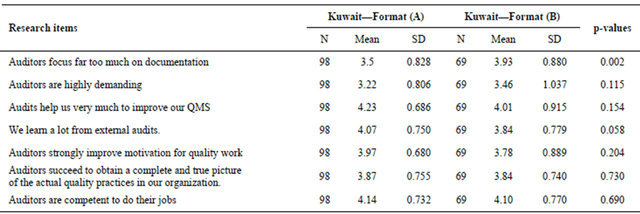
N: Total Surveyed, SD: Standard Deviation. Used scaling: 1-5 point Likert scale, 1) Strongly disagree, 2) Disagree, 3) Neutral, 4) Agree, and 5) Strongly agree.
differences that may exist.
When applying Kruskal Wallis test on format (A), results have shown that auditors failed to perform differently from one certification body to another. However, the differences were statistically significant with p-value < 0.05 when auditing took place in the government and private sectors. The two indicators which exhibit differences are the research items in Table 8: 1) we learn from external audits and; 2) auditors are competent to do their jobs.
Correlation was statistically significant between the choice of certification bodies and what these certification bodies can offer to their customers or how they are described by their customers (business characteristics of the certification bodies). Lambda value was calculated to be 26.2%. This means that 26.2% improvement of the prediction for which certification body selected by the work organization that can be made depending on the business characteristics of the certification bodies. Therefore, the characteristics of the auditing bodies affect the selection of decisions made by the work organizations.
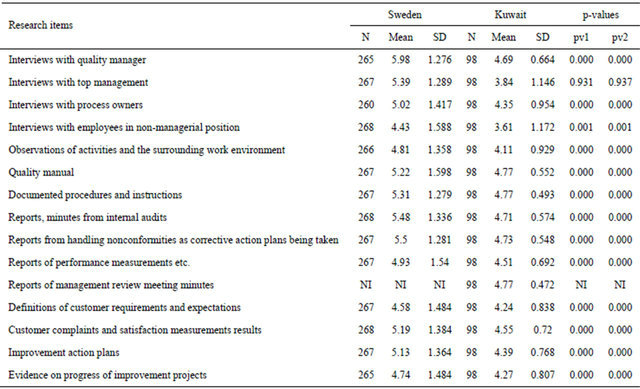
5.2.6. Sources of Information Used by the Auditors
Table 9 illustrates the sources of information collected by the auditors during their review on the organization’s quality management system. From practical experience and the understanding of the ISO 19011:2002 guidelines standard document in [31], the 15 listed items in Table 9 can provide and guide toward the conclusion of organization’s compliance with the standard requirements. Using the t-test of means differences for the percentages as done in the previous sections, the only research item that showed no statistically significant difference was the “interview with top management”. The p-value under both assumption of the homogeneity and heterogeneity of the variances was very much greater than the significance level (p-value > 0.90). Therefore, the conclusion to reject the null hypothesis that Swedish and Kuwaiti respondents feel the same about this research item is unjustifiable. In other words, the importance of the research item “meeting with top management during audit” is very much the same in the two cultures. The differences were significant in the other research items because it is obviously clear that Kuwaiti respondents’ feedback is positively higher than Swedish respondents feedback.
This dimension was not performed on the non-quality employees (format (B)) since it would not be reasonable to ask respondents about tasks for which they are not responsible.
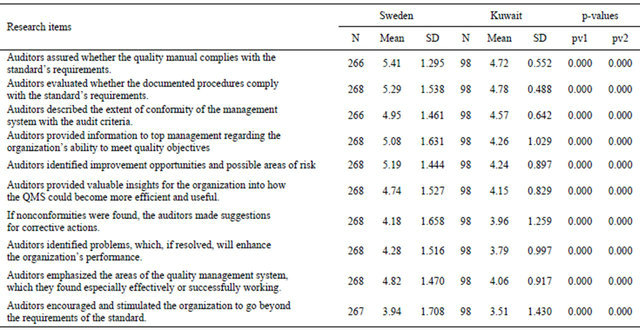
5.2.7. Audit Conclusions and Reports
Table 10 illustrates the content of audit reports submitted by the auditors to the work organization. By performing the t-test of means differences on the percentages, differences were found to be statistically significant for all research items. The respondents were only quality related employees in Swedish and Kuwaiti work organizations. Another test was performed to see if the content of the audit reports, submitted to Kuwaiti organization, differ with respect to the type of business sector. Using Kruskal Wallis test, the results revealed no statistically significant differences in the audit reports submitted to various business sectors. Using Mann-Whitney test to see if differences exist between private and government sectors, the research item “if non-conformities were found, the auditor make suggestions for corrective actions” has shown a statistically significant difference at p-value = 0.030 < 0.05. This result suggests that maybe the audit report content is presented differently depending on whether organization is private or governmental
5.2.8. QMS Functions
The research items for this dimension are described in details as in Table 11 for formats (A) and (B) with their
Table 8. Auditors’ performances as perceived by quality employees in the private and government sectors.
N: Total Surveyed, SD: Standard Deviation. Used scaling: 1-5 point Likert scale, 1) Strongly disagree, 2) Disagree, 3) Neutral, 4) Agree, and 5) Strongly agree.
Table 9. Sources of information collected by auditors in Swedish and Kuwaiti organizations.
N: Total Surveyed, SD: Standard Deviation, NI: Not Investigated. Used scaling: Sweden: 1-7 point Likert scale, 1) Not at all, and 7) Very much. Kuwait: 1-5 point Likert Scale, 1) Never, 2) Seldom, 3) Sometimes, 4) Often, and 5) Always. pv1: p-value calculated when both variances are assumed equal. pv2: p-value calculated when both variances are assumed unequal.
Table 10. Content of audit report submitted to the Swedish and Kuwaiti organizations.
N: Total Surveyed, SD: Standard Deviation. Used scaling: Sweden: 1-7 point Likert scale, 1) Not at all, and 7) Very much. Kuwait: 1-5 point Likert scale, 1) Never, 2) Seldom, 3) Sometimes, 4) Often, and 5) Always pv1: p-value calculated when both variances are assumed equal. pv2: p-value calculated when both variances are assumed unequal.
Table 11. QMS functions as perceived by quality and non quality employees in the Kuwaiti organizations.
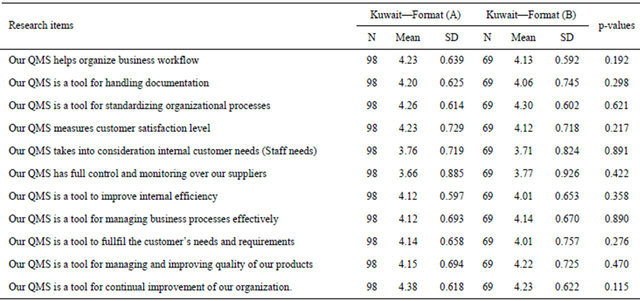
N: Total Surveyed, SD: Standard Deviation. Used scaling: 1-5 point Likert scale, 1) Strongly disagree, 2) Disagree, 3) Neutral, 4) Agree, and 5) Strongly agree.
respective means, standard deviations and calculated p-values. The resulted p-value is >0.05 which conclude that there are no significant differences between quality and non quality related employees with respect to QMS functions. Inferential assessment is also conducted in the following subsections as per single independent variables such as Auditors’ view, and customers’ view.
1) Auditors’ view
The authors in [2] have tested the QMS functions relative to multiple certification bodies. The results revealed that differences were only significant in two research items such as that QMS is a tool to improve internal efficiency and the QMS has great importance for how an organization works. The tested hypothesis was to study if the auditors may influence the view of QMS functions in the audited organizations. In [2], the certification bodies, Sigma, Delta, and Gamma, have shown statistically significant differences for the QMS functions in the audited organizations.
However, in Kuwait, similar survey questions were asked and only few significant differences were shown for the following research items:
a) “Our QMS helps organize business work flow.” The resulted p-value < 0.05.This research item is similar to the question that “Our QMS has great importance for how organization works” in [2]. This question was just rephrased to make it understandable for the respondents.
By calculating the eta-squared in Equation (2),
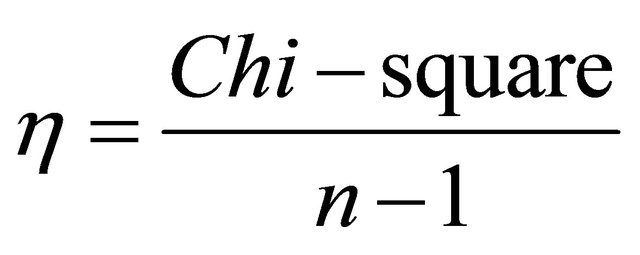 (2)
(2)
it was found the certification bodies, BV and SGS, were mainly responsible for causing the differences since the value of eta-squared came out to be the highest.  means that with 13.7% of the variability in rank scores of this research item is accounted for by which certification body is conducting the audit.
b) “Our QMS is a tool for standardizing organizational processes.” The resulted p-value = 0.008 < 0.05. However, it was not shown statistically significant in Sweden. The eta-squared is calculated to be  for this research item.
c) “Our QMS is a tool to improve internal efficiency.” The resulted p-value = 0.027 < 0.05. That has also shown a statistical significance in Sweden [2]. In other words, differences were statistically significant between the way auditing is conducted and the view of QMS functions to the audited organizations. The eta-squared was calculated to be .
.
As indicated earlier, the ANOVA method was not used here since Data was not statistically significant to show convergence to Normality. Thus, the counterpart method to ANOVA, the nonparametric test, so called Kruskal Wallis test is the only valid statistical tool to be used in the above discussions.
2) Customers’ view
Customers’ attitudes are measured for three categories: the government and private sectors; five various business sectors (manufacturing, services, and etc.); and quality and non-quality employees. Using Mann-Whitney nonparametric method to test for differences in QMS functions as perceived by private and government sectors, and as perceived by quality and non-quality employees, there were no significant differences for any research item in this dimension (p-value > 0.05). A krsukal-Wallis test was performed to test for differences among the organization’s business sectors and found only one significant difference in the research item “Our QMS is a tool for managing and improving quality of our products”. The resulted p-value = 0.025 < 0.05 and the calculated eta-squared .
.
5.2.9. ISO QMS Awareness Level among Employees of the Organizations
Measurement of ISO awareness is an essential need to verify the compliance with the ISO 9001 standard requirements and implementation. This dimension consists of 10 research items. This dimension was not addressed or at least categorized as such in [2]. Thus, a comparison with Swedish organizations is not possible.
Table 12 lists these 10 items with the results of significant difference as SIG or no significant difference as NSIG. Three hypothesis tests were performed for three independent variables: organization type; business sectors; and job positions (quality and non-quality employees). Using Mann-Whitney and Kruskal Wallis tests, the results revealed almost a statistically significant difference between government and private organizations for the research item “ISO 9001 standard has helped organization meet its objectives effectively”, and a statistically significant difference among business sectors and between two job positions (quality and non-quality) for the same research item “Our organization provides proper work environment for its employees to perform their tasks efficiently”. Its eta squared value was calculated to be  with respect to business sectors. The big difference was found between the training and education sectors. While comparing differences between the two organization types, the eta squared was calculated to be
 .
.
Another interesting fact of our concern is to investigate whether the enhancement of top management and involvement in the implementation of ISO 9001 standard requirements will improve ISO 9001 implementation, organization’s business performance, financial performance, and other variables listed in Table 12. Using spearman correlation non-parametric test, it was found that top management and involvement have shown highly moderate association with correlation coefficients (r-value) that are statistically significant, corresponding to the following research items:
1) ISO 9001 standard implementation has improved our business performance (r = 0.30, p-value = 0.003).
2) ISO 9001 standard implementation has improved organization’s financial performance (r = 0.312, p-value = 0.002).
3) ISO 9001 standard implementation has helped organization meet its objectives effectively (r = 0.482, p-value = 0.000).
4) ISO 9001 standard has helped the organization control its outsourced processes (r = 0.297, p-value = 0.003).
5) Employees do their tasks efficiently with ISO 9001 implementation (r = 0.530, p-value = 0.000).
6) Customer requirements are fulfilled and controlled effectively with ISO 9001 standard implementation (r = 0.539, p-value = 0.000).
7) Continual improvement programs are always a
Table 12. Calculated p-values for testing differences in a QMS awareness level among different business types, sectors, and job positions.
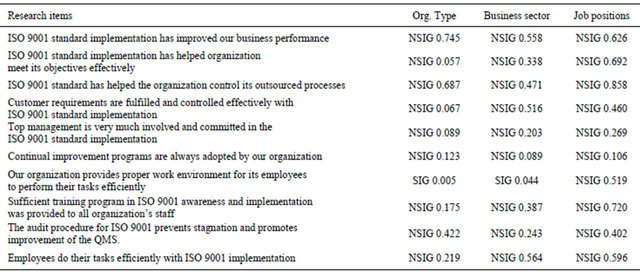
Org. type: Organization type (either government or private). NSIG: Not statistically significant. SIG: Statistically significant. Printed values are the p-values.
dopted by our organization (r = 0.764, p-value = 0.000).
8) Our organization provides proper work environment for its employees to perform their tasks efficiently (r = 0.533, p-value = 0.000).
9) Employees get motivated to do their jobs efficiently (r = 0.488, p-value = 0.000).
10) Sufficient training program in ISO 9001 awareness and implementation was provided to all organization’s staff (r = 0.501, p-value = 0.000).
11) The audit procedure for ISO 9001 prevents stagnation and promotes improvement of the QMS (r = 0.488, p-value = 0.000).
All the above results are attributed to the commitment and involvement level of top management which will eventually lead to effectiveness and efficiency of quality management systems in the organization.
5.2.10. Organization’s Satisfaction with Audits
Respondents were asked to evaluate the auditor’s performance on scale 1 - 10. Table 13 summarized the results and showed the results in Sweden [2] as well. The mean and standard deviation values of satisfaction in Kuwaiti organizations were 7.84 and 1.497 respectively.
Three hypothesis tests were performed for three independent variables: organization type; business sectors; and job positions (quality and non-quality employees). Using Mann-Whitney and Kruskal Wallis tests, the results showed: a statistically significant difference in the satisfaction level between government and private organizations; no statistically significant difference in the satisfaction level among various business sectors; and no statistically significant differences in the satisfaction level between quality and non-quality employees.
5.2.11. Benefits Besides Certificate
In the last dimension of this research, respondents of various categories were asked if benefits are perceived from auditing besides the certificate. Results of the conducted hypotheses were as follows:
1) Using the Chi square proportion test, it was concluded that proportion of respondents were in favor of perceived benefits was higher than those not in favor.
2) Using Mann-Whitney non-parametric test, it was found that no statistically significant difference in the perceived benefits of auditing between quality and nonquality related employees (p-value > 0.05).
3) Using Kruskal Wallis non-parametric test, it was found that no statistical differences in perceived benefits among business sectors, and among certification bodies (p-values > 0.05). This result suggests that benefits of audits exist besides the certificate.
Table 14 describes the percentages of respondents who claimed benefits of auditing besides certificates, and
Table 13. Auditors evaluated by Kuwaiti and Swedish organizations (Satisfaction level).
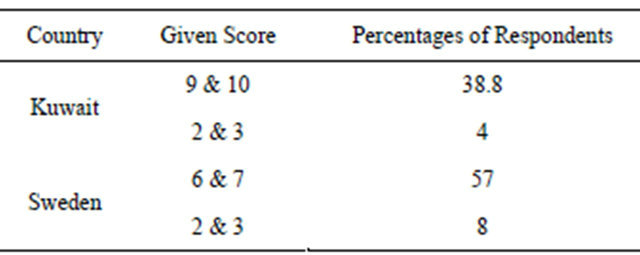
Used scaling: In Sweden, Lowest = 1 and Highest = 7, In Kuwait, Lowest = 1 and Highest = 10.
Table 14. Percentages of claimed benefits with ISO 9001 certificates in the Kuwaiti and Swedish organizations.
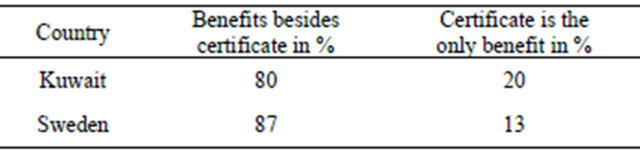
a certificate benefit only in the two countries, Kuwait and Sweden. Using the Minitab software ver. 16 to test proportion differences between Swedish and Kuwaiti organizations, it was found that both Swedish and Kuwaiti organizations have agreed on the perceived benefits of auditing besides certificate at the same level (p-value = 0.197 > 0.05). These benefits agreed with the findings in [32]. He found about 95% of work organizations that have shown internal benefits with respect to better documentations, increased awareness, and enhanced internal efficiency.
Reading the comment box (from the survey) about the benefits perceived by respondents, a simple statistical classification can be made to these comments into four categories with their corresponding percentages and they are as follows:
1) 55.7% responded with perceived process, product, and continual improvement in the QMS of the organization.
2) 11.5% responded that commitment of implementation and awareness has been enhanced with auditing.
3) 13.1% responded that ISO 9001 reflects good image for the outsiders of the organization.
4) 19.7% responded that customer requirements and satisfaction have been improved and enhanced with auditing.
6. Summary and Conclusion
In this research, an overview of indicators for the quality management systems as per ISO 9001 standard was presented with care and understanding of variables that compose and construct the quality management system for any ISO 9001 certified organization. These variables were the research items which authors of this paper find appealing to study before any conclusion that can be drawn about the ISO 9001 QMS certified organizations. Thus, the authors took the burden of customizing an already used survey with deleting, adding, and amending some research items which eventually help the researcher draw a clear picture of the current QMS practices and implementation in the work organization. The authors have used the survey as their one but not necessarily only instrument for this research. The results of this research were taking the part of comparison between Swedish and Kuwaiti ISO certified organizations. Another part was studying all aspects of ISO certified work organizations in Kuwait and learning more about all possible QMS performances indicators. The authors could not indeed address parameters of the QMS unless data collections from the certified organization show some objectivity and that was not possible. Differences in responses between Swedish and Kuwaiti organizations were statistically significant in most of the variables (almost 95% of the compared research items) under study. The reason for this persisting difference could be attributed to the wide scaling used in the Swedish survey or the existing cultural differences between the two countries. Unfortunately, a 7 point scale would not be appropriate for the respondents of Kuwaiti surveys as explained earlier. From literature review, this would be the first research done about ISO 9001:2008 certified work organizations in Kuwait for which many indicators and comparisons at various levels are studied and analyzed. Similar studies have been done before in many countries but not in Kuwait with this multi purposed questionnaire (instrument). Just to make the reader aware that 80% of the analysis was limited to the use of non-parametric methods since the validity of necessary assumptions were not verified for the parametric methods. The analysis was performed by using most of the time SPSS ver. 20 on 96 survey questions in format (A) and 55 questions in format (B). The responses for these questions were the clues to that lead to understanding QMS indicators. The research initially focuses on the performance of the auditor from the view point of the beneficiaries or maybe called the end user which is the certified organization. Besides the brief demographic presentation in section (5.1), at least 11 possible dimensions can be addressed from the survey. Each of these dimensions consists of at least one variable or research item. These dimensions are described as below:
1) Motives for seeking certification;
2) Motives for the choice of a specific certification body;
3) Organizations with permissible exclusion;
4) Role of external auditors;
5) Auditors’ performances;
6) Sources of information used by the auditors;
7) Audit conclusions and reports;
8) QMS functions from auditors’ and customers’ perspectives;
9) ISO level of awareness and top management commitment and involvement;
10) Organizations’ satisfactions with audits;
11) Benefits besides certificates.
One interesting finding in this research was the fairly strong correlation coefficient found between the top management commitment and the adoption of continual improvement programs in the work organization. This finding assures and complies with the discussion in the literature survey section. Thus, it was concluded that no indication of top management commitment and involvement means no or little indication of QMS effectiveness and efficiency.
In the next research, a level of QMS implementation will be investigated and statistically analyzed via collecting actual QMS performance data from the auditing bodies. This new trend of research will give another view of QMS assessment from the investigators rather than implementers.
7. Acknowledgements
Finally, we express our many thanks and gratitude to Mr. Poksinska B, the main author in [2,3], for being so cooperative by giving his permission to utilize his survey and compare our findings with some of his results. Also, our thanks and appreciations go to all stakeholders involved in this research, particularly speaking the respondents. Without their honest feedback, this paper will not be produced.
REFERENCES
- M. Mady, “Quality Management Practices: An Empirical Investigation of Associated Constructs in Two Kuwaiti Industries,” International Journal of Quality and Reliability Management, Vol. 26, No. 3, 2008, pp. 214-233. doi:10.1108/02656710910936708
- B. Poksinska, J. Dahlgaard and J. Eklund, “From Compliance to Value-Added Auditing—Experiences from Swedish ISO 9001:2000 certified organizations,” Total Quality Management, Vol. 17, No. 7, 2006, pp. 879-892. doi:10.1080/14783360600595294
- B. Poksinska, J. Dahlgaard and M. Antoni, “The State of ISO 9000 Certification: A Study of Swedish Organizations,” Total Quality Management, Vol. 14, No. 5, 2002, pp. 297-306.
- International Organization for Standardization, “ISO 9001: 2008(E). Quality Management Systems requirements,” 2012. www.iso.org/iso
- A. H. Quazi, W. C. Hong and T. C. Meng, “Impact of ISO 9000 Certification on Quality Management Practices: A Comparative Study,” Total Quality Management, Vol. 13, No. 1, 2002, pp. 53-67. doi:10.1080/09544120120098564
- International Organization for Standardization “ISO Quality Management Principles,” 2008. www.iso.org/iso
- J. Groocock, “The Impact of Powerful and Weak Customers on Quality Assurance Systems and Quality Improvement Programs,” The TQM Magazine, Vol. 12, No. 6, 2000, pp. 372-388. doi:10.1108/09544780010351661
- M. Terziovski, D. Power and A. S. Sohal, “The Longitudinal Effects of the ISO 9000 Certification Process on Business Performance,” European Journal of Operational Research, Vol. 146, No. 3, 2003, pp. 580-595. doi:10.1016/S0377-2217(02)00252-7
- G. Yaacov, “Reap the Rewards of Quality with ISO 9000,” IEEE Computer-Applications in Power, Vol. 8, No. 4, 1995, pp. 26-30. doi:10.1109/67.468292
- K. Goffin and M. Szwejczewski, “Is Management Commitment to Quality Just ‘a Given’?” The TQM Magazine, Vol. 8, No. 2, 1996, pp. 26-31. doi:10.1108/09544789610114821
- T. Guimaraes, “TQM’s Impact on Employee Attitudes,” The TQM Magazine, Vol. 8, No. 1, 1996, pp. 20-25. doi:10.1108/09544789610107225
- G. Laszlo, “ISO 9000 or TQM: Which to Adopt—A Canadian Case Study,” The TQM Magazine, Vol. 10, No. 5, 1998, pp. 362-366. doi:10.1108/09544789810231243
- M. Mohammad, R. Man and J. P. Wagner, “The Right Improvement Initiative for the Right Situation,” Computer & Industrial Engineering (CIE), 40th International Conference, Awaji City, 25-28 July 2010, pp. 1-6.
- S. Kumar and R. Harms, “Improving Business Processes for Increased Operational Efficiency: A Case Study,” Journal of Manufacturing Technology Management, Vol. 15, No. 7, 2002, pp. 662-674. doi:10.1108/17410380410555907
- A. Al-Rawahi and A. Hamdi, “On the Implementation of ISO 9001:2000: A Comparative Investigation,” The TQM Journal, Vol. 23, No. 6, 2011, pp. 673-687. doi:10.1108/17542731111175275
- C. London, “Management Effects on Quality-Policy Implementation,” The TQM Magazine, Vol. 17, No. 3, 2005, pp. 267-278. doi:10.1108/09544780510594234
- A. Rad, “The Impact of Organizational Culture on the Successful Implementation of Total Quality Management,” The TQM Magazine, Vol. 18 No. 6, 2006, pp. 606- 625. doi:10.1108/09544780610707101
- Y. S. Lee and K. Lam, “Managing Quality at an Engineering Maintenance Centre: From QCC to ISO 9001 and Beyond,” International Journal of Quality and Reliability Management, Vol. 14, No. 2, 1995, pp. 118-137. doi:10.1108/02656719710165392
- R. Ashrafi, “A Review of ISO 9001:2000 Quality Management Practices in Oman,” International Journal of Quality and Reliability Management, Vol. 3, No. 1, 2008, pp. 74-105.
- H. Magd, “ISO 9001:2000 in the Egyptian Manufacturing Sector: Perceptions and Perspectives,” International Journal of Quality and Reliability Management, Vol. 25, No. 2, 2008, pp. 173-200. doi:10.1108/02656710810846934
- W. O. Bearden, R. G. Netmeyer and M. F. Mobley, “Handbook of Marketing Scales: Multi-Item Measures for Marketing and Consumer Behavior Research,” Sage, Newbury Park, 1993.
- M. E. Shaw and J. M. Wright, “Scales for the Measurement of Attitudes,” McGraw-Hill, New York, 1967.
- P. M. Symonds, “On the Loss of Reliability in Ratings Due to Coarseness of the Scale,” Journal of Experimental Psychology, Vol. 7, No. 6, 1924, pp. 456-461. doi:10.1037/h0074469
- E. E. Ghiselli, “The Measurement of Occupational Aptitude,” University of California, Berkeley, 1955.
- G. A. Miller, “The Magical Number Seven, Plus or Minus Two: Some Limits on Our Capacity for Processing Information,” Psychological Review, Vol. 63, No. 2, 1956, pp. 81-97. doi:10.1037/h0043158
- D. Sheskin, “Handbook of Parametric and Nonparametric Statistical,” CRC Press, Boca Raton, 2004.
- W. A. Taylor, “Organizational Differences in ISO 9000 Implementation Practices,” International Journal of Quality and Reliability Management, Vol. 12, No. 7, 1995, pp. 10-28. doi:10.1108/02656719510093529
- P. Castka, M. Balzarova and J. Kenny, “Survey of ISO 9000 Users in New Zealand: Drivers and Benefits,” QNEWZ, Professional Non-Refereed Paper Published in New Zealand, 2007, pp. 4-9.
- J. Mclachlan, “In Praise of ISO 9000,” The TQM Magazine, Vol. 8, No. 3, 1996, p. 213. doi:10.1108/09544789610118421
- M. Colman, E. Norris and C. Preston, “Comparing Rating Scales of Different Lengths: Equivalence of Scores from 5-Point and 7-Point Scale,” Psychological Reports, Vol. 80, No. 2, 1997, pp. 355-362. doi:10.2466/pr0.1997.80.2.355
- International Organization for Standardization, “ISO 19011: 2002(E). Guidelines for Quality and/or Environmental Management Systems Auditing,” 2012. www.iso.org/iso
- K. Sissel, “Survey Rates ISO 9000 Success,” Chemical Week, Vol. 158, No. 13, 1996, p. 33.