Journal of Service Science and Management
Vol.5 No.2(2012), Article ID:19209,7 pages DOI:10.4236/jssm.2012.52022
Empirical Study on the Influence of Rural Labor Transfer upon Rural Economic Development in China Jiangxi—Based on Industrial Structure Deviation
![]()
School of Business, Jinggangshan University, Ji’an, China.
Email: *liyuhong0718@hotmail.com
Received April 5th, 2012; revised May 2nd, 2012; accepted May 12th, 2012
Keywords: Per Capita Income; Industrial Structure Deviation; Integration Analysis; Granger Causality Test
ABSTRACT
Adopt co-integration and granger causality test for analyzing the influences of the deviation of three industrial structures on peasants’ income based on the model of industrial structure deviation with time sequences of peasants’ income and the deviation of three industrial structures in China Jiangxi. It’s found that there exists a long-term positive equilibrium relationship between the deviation of three industrial structures and peasants’ income, and the impact of the tertiary industry on peasants’ income is the greatest. Granger causality test indicates that there isn’t Granger causality between the deviations of the first or the tertiary industrial structure, but the deviation of the second industry structure and peasants’ income are the Granger causes to each other.
1. Introduction
Three issues of agriculture, peasants and rural areas have been the barriers to Chinese economic development and the focus of attention of the society [1]. Jiangxi is an under-developed and agricultural province; the rural economy is relatively backward, there are more than 20 national poverty alleviation counties. Statistics indicates that per capita family net income in the rural areas of Jiangxi was 5777 Yuan in 2010; it was ranked 14 in our country. The percentage of employees in the first industry was 35.6% in the population of Jiangxi, but the contribution rate of it to regional economy was only 12.8%, that means there was obvious deviation between the employees in the first industry and the industrial structure, the labor productivity was still relative low. Jiangxi is a big province of labor export among middle-west area. There were only 8.66 million labors from 17.24 million countries working in first industry; the employee rate was only 50.23%. That is to say, nearly half of them need to transfer to other industries and a big amount of surplus rural labors transfer coexists with backward rural economy [2,3]. What’s the relation between them? And what is the impact of such deviation on rural economy?
Clark was the earliest foreign scholar to disclose the relation between per capital national income and industry structure changes. He thought that the discrepancy of income among different industries results in labors transfer between different industries when economy grows [4]. With per capita national income improving increasingly, the employees transfer from the first to second industry, when it continues to grow, the labors will flood into the tertiary industry. Some scholar did deep research on per capita production value and structure changes considering labor structure and sector production value structure [5,6]. They thought that the increase of per capita income will lead to industry core transfer and some related changes in production value and employee structure [7]; some scholars discussed the features and regularities of the labor fluidity in dual economic structure, they thought that industrialization is the course of rural surplus labors transferring to cities [8]. Besides, some scholars held the ideas that the transfer process of dual economic structure is that industrial sector constantly absorbs the surplus labor from agriculture sector in essence [9]; also some scholars held a view that the decision of labors to transfer to cities not only results from the actual discrepancy of income between cities and counties but also the expected income discrepancy [10].
There are fruitful domestic researches on industrial structure and economic development. Some scholars ever did empirical research on the contribution of industrial structure to economic growth, they found that China’s economic growth was mainly pulled by tertiary industry [11]; while some scholars thought that the productivity of the second industry is more than that of the tertiary industry through empirical study on China’s principal industrial sectors, so much more capital resources should be allocated to industrial sector, and it will be good to improve the overall productivity and the fast economic development [12].
So far, internal researches of the impacts of industrial structure on economic development concentrated on two aspects, one is the analysis of the contribution of the three industries to economic growth or their pushing effects, and the other is empirical studies on element input and its output. Most of the existing researches researched the special phenomenon under specific historical shorttime conditions, and when economic and social conditions change under time sequence, the effects may change, too. There are few available researches studying the effects of rural labor transfer upon rural economic development in the view of industrial structure deviation as well as long-term and dynamic angle. This article has tried to empirically study the influence of rural labor transfer upon rural economic development in Jiangxi—in the view of industrial structure deviation.
2. Industrial Labor Productivity Analysis Based on Industrial Structure Deviation
2.1. The Status of Industrial Structure and Employment Structure in Jiangxi
As a complicated system, the production value structure fluctuating in different sectors of regional economy results from their own growing speeds, but the growth is impacted by invested factors to much extent. As one of the important input factors, labor factor complies with the principle, if sectors can develop coordinately, and the labor structure changes should coincide with production value structure. But in Jiangxi, although the change of labor in all sectors demonstrates identity with that of corresponding production value, it seems to demonstrate weight inconformity of production values in different sectors (see Table 1).
2.2. Industrial Structure Deviation Model
Industrial structure deviation refers to an asymmetric degree which can reflect relative discrepancy of every Industry on labor productivity [13]. It can be employed for analyzing the employment structure and production value
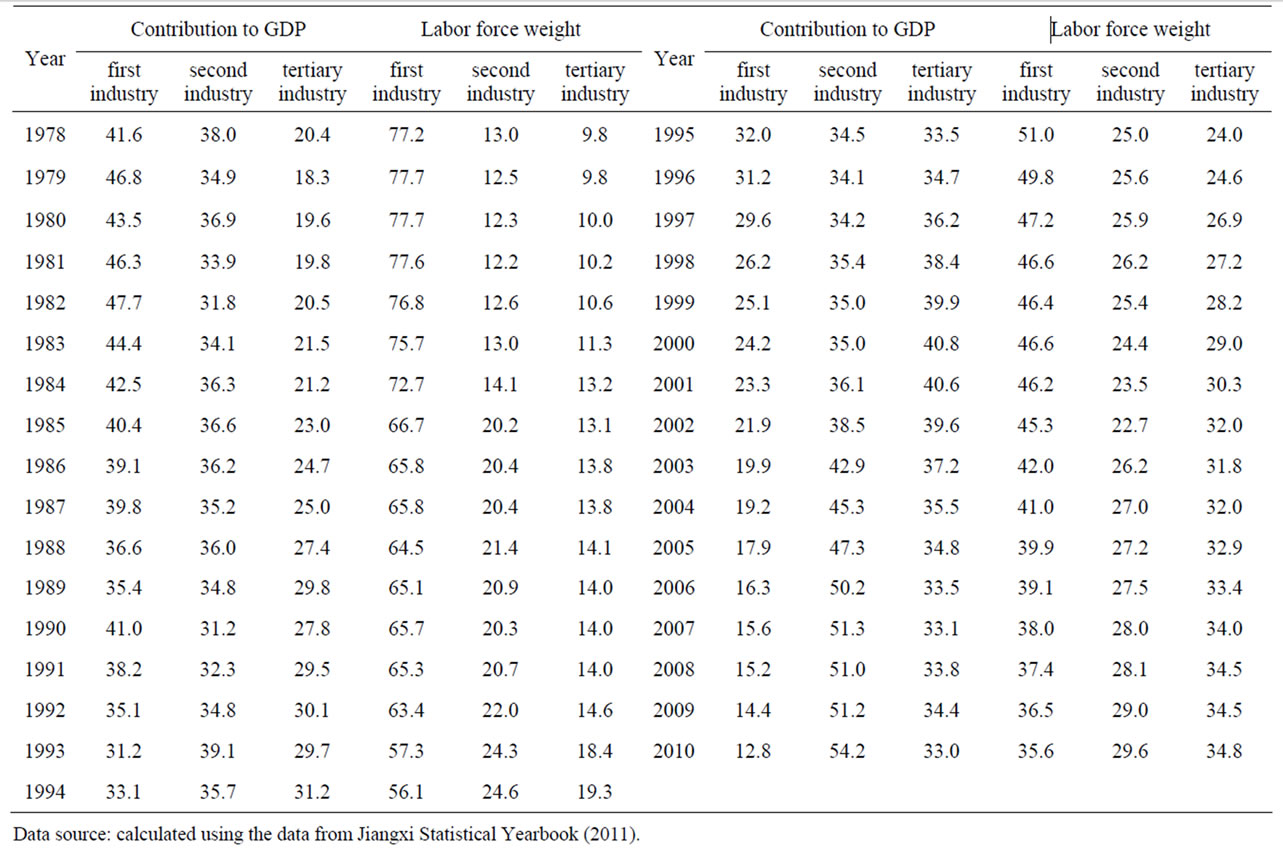
Table 1. Labor force weight in industries and contribution of industries to GDP (Unit: %).
structure, and the corresponding model could be built as:
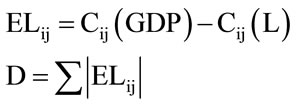
where, 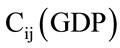 indicates the proportion of the added value of industry I in GDP in year j,
  indicates the proportion of employment in industry Cij(GDP) – Cij(l) in the whole labor force in year j.
  is the balance of indicating the deviation of industry I in year j. And D is the sum of the absolute values of the three industries in the whole economic society.
The bigger the absolute value of some industry, the more asymmetric the deviation of the industry will be, which implies that the efficiency of the industry is lower [14]. Generally, it’s deemed that if the value equals zero, the GDP structure of this industry keeps up with the employment structure, indicating the industrial structure is at the high-point and the industry achieves full employment; and if the value is less than zero, invisible unemployment exists in this industry and the actual labor productivity is less than those of other industries, the more the absolute value of minus value, the more serious the invisible unemployment will be, and the bigger the scale of surplus labors is, and the more urgent the labor transfer will be; if the value is more than zero, there is lack of labors in this industry and the actual labor productivity is higher than those of other industries. The bigger the positive value, the more serious the discrepancy of labors will be, and the more capable for the industry to absorb labors from other industries [15]. Table 2 indicates the industrial structure deviation and peasants’ per capita net income since the reform and opening-up according to the above theory.
2.3. Analysis of Industrial Structure Deviation in Jiangxi
Figure 1 reflects the changes of the deviation of the three industries since opening-up and reform. As the blue curve presenting, the absolute value of the deviation of the first industry decreased from 35.6% in 1978 to 22.8% in 2010, implying the overall improvement of the labor productivity in the first industry, but the absolute value is still fairly big, meaning that there exists big possibility of the labor productivity in the first industry to improve and transfer. As the red curve presenting, the absolute value of the second industry was 25% in 1978, and 246% in
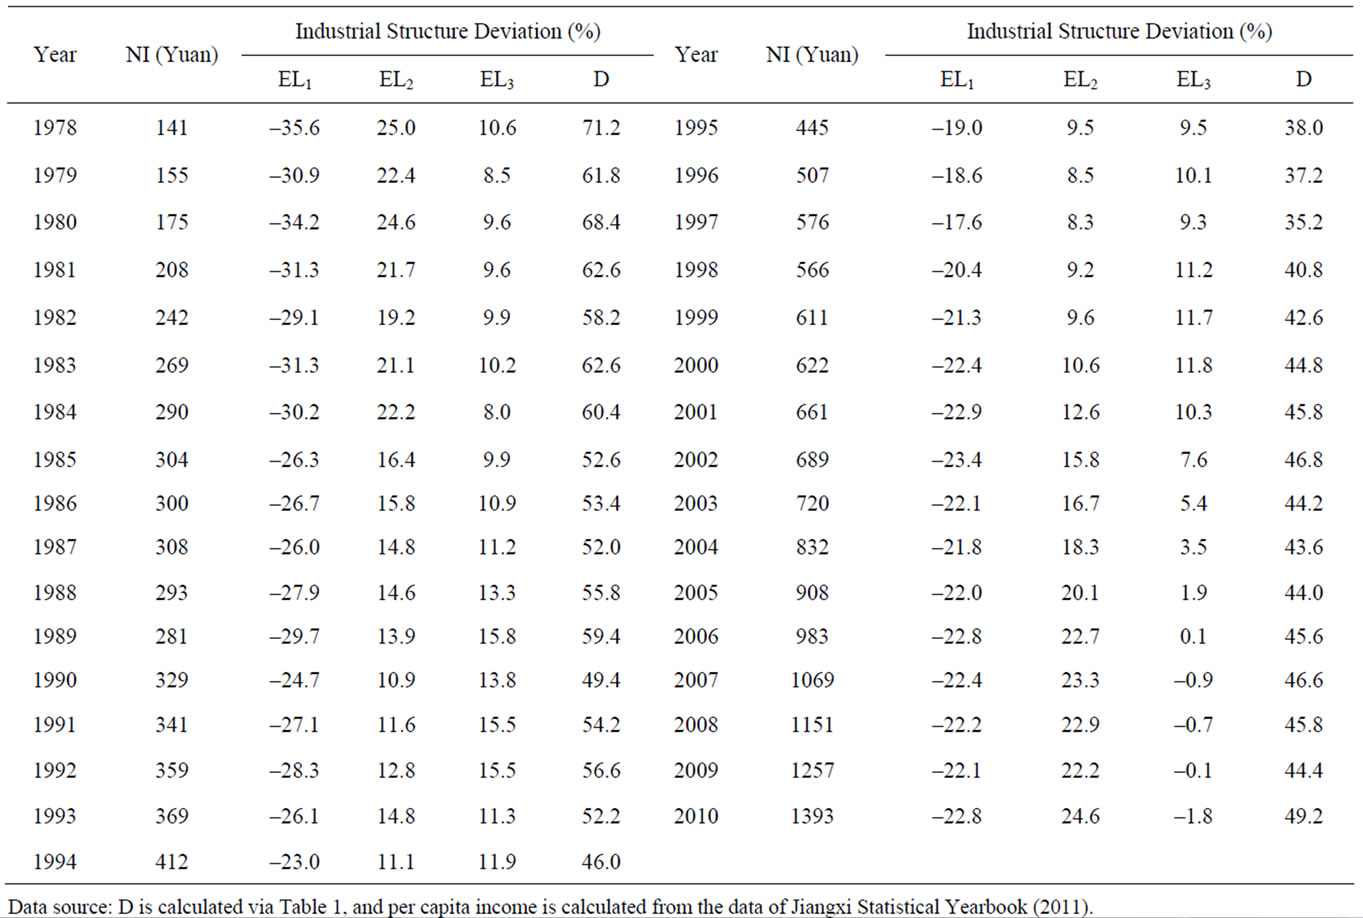
Table 2. The industrial structure deviation and peasants’ per capita net income since 1978.
Data source: D is calculated via Table 1, and per capita income is calculated from the data of Jiangxi Statistical Yearbook (2011).
2010, it experienced a U fluctuation by first decreasing and then increasing, positive value indicates the labor productivity in the second industry is higher than that in the first industry.
Year 1997 is the watershed of the structure deviation of both the first and second industry, in this year, the deviation of the first industry reached the peak (–17.6%) and that of the second industry reached the bottom (8.3%), these trend presented inverted u change and u change respectively, that means, regarding labor productivity, the labor productivity in first industry experienced U fluctuation of firstly increasing and then decreasing, during the period of uprising stage before 1979, the pressure of labor transfer decreased gradually, but during the declining stage after 1979, the pressure increased gradually. However, that in the second industry presented an opposite fluctuation, it can be reflected by the ability to attract rural labors transfer, the ability decreased slowly before 199, and after 1997, it increased gradually in terms of the improvement of labor productivity.
While the watershed of the structure deviation of the third industry was 2000, as the green curve presenting, it went up and down between 8% and 15% before that. And it declined quickly from 11.8% in 2000 to 0.1% in 2006 after 2000, and it became negative in 2007,and it was –1.8% in 2010,which suggests, being into 21st century, the labor productivity in the third industry declined gradually from the value which is obviously higher than that in the first industry. In 2006, the labor proportion approximately equaled the proportion of production value in the tertiary industry, and it achieved full employment. However, after 2007, the negative deviation of industrial structure meant that the surplus labor forces emerged.
as the purple curve presenting, the total deviation of the three industries decreased from 71.2% in 1978 to 49.2% in 2010, which suggests the imbalance of labor productivity in the three industries got improved continuously, but even 35.2% at the bottom in 1978 was still far away from the ideal state 0.
3. Empirical Study on the Impact of Industrial Structure Deviation on Rural Economy in Jiangxi
In this section, time sequence-quantitative analysis is employed to empirically research the correlation of surplus rural labors transfer and the economic development in rural areas of Jiangxi province in the view of industrial structure deviation.
3.1. Variable Selection and Data Processing
Per capita income of rural residents NI is employed as the variable to describe the economic development in rural areas of Jiangxi province, in order to eliminate the impact of prices; NI is based on the price in 1978, the deviations of the three industries EL1, EL2, EL3 are employed as the variables to describe the rural labor transfer. And natural logarithm LnNI, LnEL1, LnEL2, LnEL3 of corresponding variables NI, EL1, EL2 and EL3 are taken to eliminate the heteroscedasticity of time sequence. And the principal data sources are indicated as Table 2.
3.2. Empirical Study
3.2.1. ADF Unit Root Test
Time sequence has a significant attribute of being nonstationary; in order to eliminate the false regression of the model, stationarity of time sequence data must be first tested using ADF to test their unit roots, and the result is indicated as Table 3. And the result implies that the four variables LnNI, LnEL1, LnEL2, and LnEL3 are all I (1) integrated series.
3.2.2. Co-Integration Test
As the four variables LnNI, LnEL1, LnEL2, and LnEL3 are all I (1) integrated, co-integration model could be built to do co-integration analysis, and Engle-Granger is generally employed to test the co-integration relationships of the four variables.
Firstly, using OLS (ordinary least squares) to estimate the impact of deviation of the three industries on the economic development in rural areas of Jiangxi province, and the following long-term equilibrium equation is the result of co-integration:
LnNI = –4.948465 + 0.075838LnEL1 + 6.010796LnEL2 –0.019191LnEL3
(–15.89166) (1.690205)
(61.61749) (–3.918444)
R2 = 0.998607 DW = 0.771143F = 6928.988 This equation is the model of analyzing the long-term equilibrium of the four variables, in it, though the goodness of fit is high, coefficients of the variables all passed the significance test (T-test), and DW is 0.771143, far
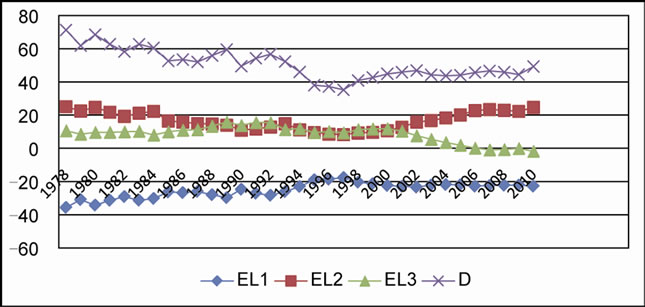
Figure 1. The structure deviations of the three industries in Jinagxi.
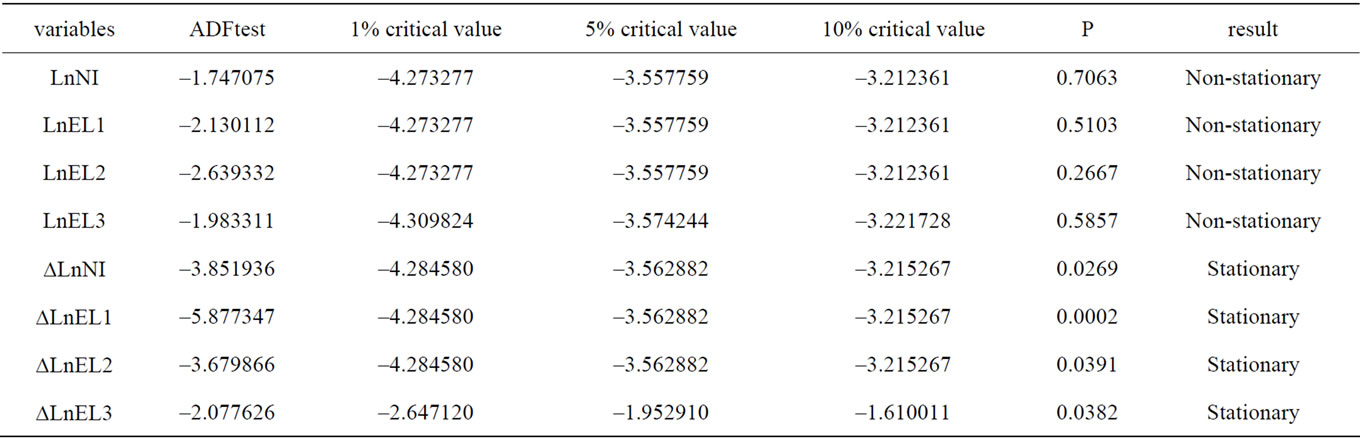
Table 3. Unit root test.
less than 2, in implies that the residual of this model presents serious sequence correlation. Thus, TSLS (Twostage least squares)is employed to eliminate the sequence correlation, when distribution lags of AR (1) and AR (2) are added, the distribution lag model of LnNI, LnEL1, LnEL2, and LnEL3 could be achieved as the followsLnNI = – 5.683890 + 0.040953LnEL1 + 6.452350LnEL2
+ 0.0007611LnEL3 + 1.3592978 AR (1)
–(–0.504685) AR (2)
s.d. = (0.189405) (0.017680) (0.089084) (0.001043) (0.155229) (0.128347)
t = (–30.00912) (2.316273) (72.43031) (0.729476) (8.756737) (–3.932189)
R2 = 0.999938 DW = 1.701421 DW is 1.701421, very close to 2, indicating the sequence correlation is eliminated on the whole through TSLS. That is to say, this new regression equation can reflect the long term equilibrium relation between LnNI and LnEL1, LnEL2, and LnEL3.
Unit root test of the residual of the adjusted regression model is further processed, and the ADF test result is as: ADF statistical values are –32.58976, 1%, 5% and 10% correspondingly; critical values are –3.661661, –2.960411 and –2.619160 correspondingly, and p is 0.0001. The result implies that, at the significance level 1%, the residual sequence is stationary, unit root doesn’t exist. Therefore, there exists co-integration relation between LnNI and LnEL1, LnEL2, and LnEL3, and it is long-term equilibrium relation.
3.2.3. Granger Causality Test
The above co-integration analysis can only prove the long-term equilibrium relation between LnNI and LnEL1, LnEL2, and LnEL3, but it cannot disclose whether there exists causality between them. Thus, Granger causality is used to solve this problem, and the result is indicated in Table 4.
The result indicates that, according to p and the significance level 5%, the hypothesis is accepted with 1 - 3 lags, meaning there isn’t Granger causality between LnNI and LnEL1, and there isn’t Granger causality between LnNI and LnEL3 either, but there is Granger causality between LnNI and LnEL2.
4. Conclusions
According to the careful analysis, the following conclusions could be achieved:
Firstly, in Jiangxi province, the labor productivity in the first industry presents a diminishing trend after 1997 and the employment pressure of rural surplus labor transfer increases continuously; the labor productivity in the second industry is always higher than that in the first
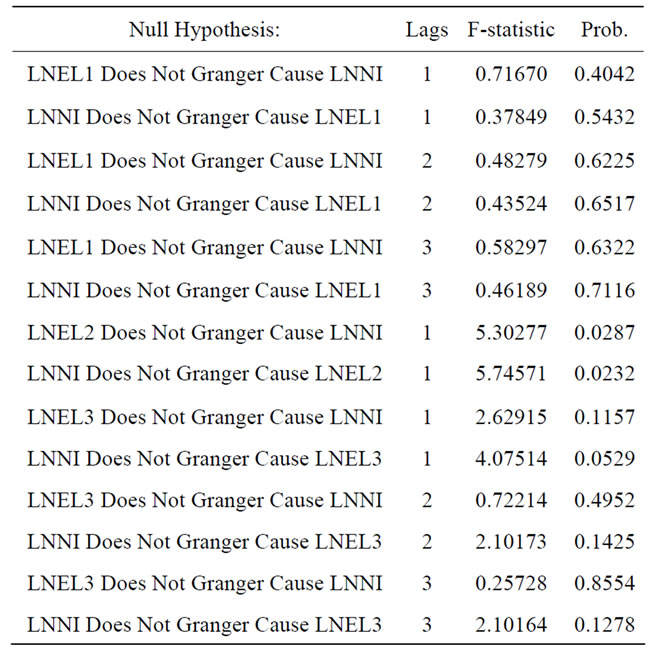
Table 4. Granger causality test.
industry and it presents a rising trend after 1997, and the second industry is the main sector to absorb rural surplus labors and its ability to absorb rural surplus labor is continuously increasing; while, the labor productivity in the tertiary industry presents a diminishing trend after1997 and its ability to absorb rural surplus labor is continuously weakening, even there emerges surplus labors in tertiary industry after 2007.
Secondly, there is long-term equilibrium relation between the structure deviation of the three industries and peasants’ per capita net income. The improvement of structure deviation of the three industries is helpful to the long-term growth of peasants’ income. According to the variable coefficients of the adjusted model, there is positive relation between the structure deviation of the three industries and rural economic development in Jiangxi province, each 1% increment of LnEL1 can lead to 0.040953% increment of LnNI; each 1% increment of LnEL2 can lead to 6.452350% increment of LnNI; each 1% increment of LnEL3 can lead to 0.0007611% increment of LnNI; the huge space brought about by the increase of labor productivity in the second industry effectively absorbs the rural surplus transfer, and make peasants’ income increase.
Thirdly, in short time, there is not Granger causality between LnEL1 and LnNI or LnEL3 and LnNI. Only between LnEL2 and LnNI is there Granger causality, which implies that with the increase of the structure deviation of the second industry or the improvement of labor productivity can improve the peasants’ income growth in short time, and the income growth brought about by the employment in the second industry can reversely improve the increase of labor productivity in the second industry.
5. Acknowledgements
This article is financially supported by Jiangxi provincial project in social science: A Study on the Long—acting Impact of the Transfer of Rural Labor Force on the Rural Economy of Impoverished Mountain Areas in Jiangxi (ID:10YJ95), and project in education science: An Empirical Study on the Dynamic Relationship between Educational Investment and Income Increase of Rural Households—A Case from Jiangxi Province (ID: 11YB066) and Doctorial Scientific Research Project in Social Science of Jinggangshan University: Foreign Trade and Economic Development—Empirical Study on Southwest Minority Region of China (ID: JRB11046).
REFERENCES
- G. j. Tong and C. g. Li, “An Empirical Analysis on Effecting Factor of Urban-Rural Income Disparity in Heilongjiang Province,” Communications in Computer and Information Science, vol. 232, 2011, pp. 499-509. doi:10.1007/978-3-642-23998-4_68
- T. y. Zhong, X. y. Zhang and X. j. Huang, “Impact of Labor Transfer on Agricultural Land Use Conversion at Rural Household Level Based on Logit model,” Chinese Geographical Science, vol. 18, No. 4, 2008, pp. 300-307. doi:10.1007/s11769-008-0300-5
- C. h. Su, B. j. Fu, Y. h. Lu, N. Lu, Y. Zeng, A. He and H. Lamparski, “Land Use Change and Anthropogenic Driving Forces: A Case Study in Yanhe River Basin,” Chinese Geographical Science, vol. 21, No. 5, 2011, pp.587-599. doi:10.1007/s11769-011-0495-8
- R. Dimova and F.-C. Wolff, “Do Downward Private Transfers Enhance Maternal Labor Supply? Evidence from around Europe,” Journal of Population Economics, Vol. 24, No. 3, 2011, pp. 911-933. doi:10.1007/s00148-010-0305-0
- S. b. Yao, Y. j. Guo and X. x. Huo, “An Empirical Analysis of the Effects of China’s Land Conversion Program on Farmers’ Income Growth and Labor Transfer,” Environmental Management, Vol. 45, No. 3, 2010, pp. 502-512. doi:10.1007/s00267-009-9376-7
- D. Thilmany, N. McKenney, D. Mushinski and S. Weiler, “Beggar-thy-neighbor Economic Development: A note on the effect of Geographic Interdependencies in Rural Retail Markets,” The Annals of Regional Science, Vol. 39, No. 3, 2005, pp. 593-605. doi:10.1007/s00168-005-0229-x
- J. R. Park, M. J. Stabler, P. J. Jones, S. R. Mortimer, J. R. Tiffin and R. B. Tranter, “Evaluating the role of environmental quality in the Sustainable Rural Economic Development of England,” Environment, Development and Sustainability, Vol. 11, No. 4, 2009, pp. 735-750. doi:10.1007/s10668-008-9140-9
- A. C. Achudume, “Environmental Health, Development and Economic Empowerment of Rural Women in Nigeria,” Environment, Development and Sustainability, Vol. 11, No. 2, 2009, pp. 459-469. doi:10.1007/s10668-007-9124-1
- C. c. Wang, Y. s. Yang and Y. q. Zhang, “Economic Development, Rural livelihoods, and Ecological Restoration: Evidence from China,” Journal of the Human Environment, Vol. 40, No. 1, 2011, pp. 78-87. doi:10.1007/s13280-010-0093-5
- R. Boero, “Food quality as a Public Good: Cooperation Dynamics and Economic Development in a Rural Community,” Mind & Society, Vol. 10, No. 2, 2011, pp. 203- 215. doi:10.1007/s11299-011-0090-9
- M. x. Xue and F. n. Zhong, “A Cross-regional Study on the Relationships between Agricultural Development, Rural Labor Transfer and the Changes of Rural Poverty Condition,” Issues in Agricultural Economy, No. 3, 2010, pp. 37-45.
- D. Guo, H.-b. Gu and H.-w. Yin, “Analysis on Rural Employment Based on the Rural Industrial Structure Adjustment in China,” China Soft Science, No. 1, 2010, pp. 18-24.
- Z. Y. Xu and S. T. Li, “The Effects of Inter-regional Migration on Regional Disparities,” China Economic Quarterly, No. 10, 2008, pp. 53-76.
- S. p. Yan, “The Fixing of Farmers Amount of Income and Different Choices in Employment,” Management World, No. 1, 2005, pp. 59-69.
- G. Wan and Z. Zhou, “Income Inequality in Rural China: Regression based on Decomposition Using Household Data,” Review of Development Economics, Vol. 9, No. 1, 2005, pp. 107-120. doi:10.1111/j.1467-9361.2005.00266.x
NOTES
*Corresponding author.