Journal of Biomedical Science and Engineering
Vol.6 No.5(2013), Article ID:31901,7 pages DOI:10.4236/jbise.2013.65073
Development and implementation of an automated system to aid laboratory diagnosis using image processing
![]()
1Department of Mechanical Engineering, University of Taubaté, Taubaté, Brasil
2Department of Electrical Engineering, University of Taubaté, Taubaté, Brasil
Email: alvaro@unitau.br
Copyright © 2013 Álvaro Manoel de Souza Soares et al. This is an open access article distributed under the Creative Commons Attribution License, which permits unrestricted use, distribution, and reproduction in any medium, provided the original work is properly cited.
Received 26 February 2013; revised 6 April 2013; accepted 8 May 2013
Keywords: Image Processing; Robotics; Automation; Pattern Recognition
ABSTRACT
The objective of this work is to provide an automatic system to count white blood cells in a blood smear. To do so an experiment was assembled, composed by a standard microscope with two step motors coupled to its knobs in order to move the microscope in x and y directions and a web cam which was mounted in the top of the microscope responsible for to acquire images from the smear. The step motors and the web cam are controlled by a microcomputer PC standard via software developed in Delphi. The motors use the parallel port to communicate with the PC and the camera use the USB port. The main idea is to set an initial point into the smear and the automated system will carry over the smear acquiring images (frames with 640 × 480 pixels) and counting the white blood cells encountered. The double histogram threshold technique is implemented to initially exclude the red cells from the image leaving only the white ones. Preliminaries results are obtained and show that the system is quite fast and has a good capacity of selection, even when different kinds of smear are used.
1. INTRODUCTION
The hemograms are blood tests, requested by the doctors in several occasions, in order to detect or to aid the diagnosis of allergies, inflammations, infections and other diseases. A complete hemogram comprises four exams: counting of red globules, counting of white globules, counting of platelets and cellular morphology. The laboratory technicians perform the counting of white blood cells (leukocytes) through the visual recognition of the cells, with the aid of a microscope, identifying, selecting and counting the proportion of each type that will allow the doctor to diagnose the type of the eventual disease. The progress of the technology caused the search for equipments capable to accomplish the blood tests in an automated way, seeking the standardization of the results and larger speed in the analysis. Several techniques of image processing were developed in the last years that reached satisfactory results. Among these, the implementation of microscopes capable of capturing images and transferring them to a computer, for processing purposes has been prominent. One of the challenges in the “intelligent” microscopes is their cost for small public or private laboratories. The objective of this work is to implement a system for acquisition of digital images associated to a common microscope (mechanic) to identify, recognize and count white blood cells.
2. RELATED RESEARCH
Several techniques of artificial vision have been applied for the recognition and separation of the white blood cells and counting of cells or micro-organisms. Cseke (1992) [1] applied a structure based on thresholds to determine the difference between the nuclei of the white cells and other cells of the image. A first threshold determined the approximate position of the nucleus, and, starting from this position created a sub-image where the cell of interest should be. This sub-image was submitted to a second threshold, aiming at isolating the interest area of the other cells. Using specific equipment for image processing, that included a digital sign processor (DSP), the study ended up with the segmentation of the image, but does not inform any attempt of selection of the white cells. The process reached indexes of 92% of success in 100 images selected specifically for this work, although the author has reported problems about the overlapping of images that caused double reading of a same nucleus. In Theerapattanakul et al. (2004) [2] the captured images are binarized after the application of an automatic threshold, in that the nucleus of the white cells was the part of the image that stayed visible. Based on this nucleus, a Gaussian two-dimensional function was used to draw an active circle in turn of the nucleus. Its position and “dimensions”, transferred to the original image, allowed the location and subsequent segmentation of the image. Although they have not presented results to assess the effectiveness of the algorithm, the system proved to be favorable to the separation of the white blood cells and their segmentation, even in smears where the high number of red cells could hinder the separation work. The work did not present solution for cases in which the red cells had dark cyan tones due to other types of coloring and did not also suggest either forms of selection of the different types of leukocytes. A segmentation structure divided in two phases, expectation and maximization, was related by Sinha and Ramakrishnan (2002) [3]. In the first phase, the unknown alterations in the image were separated. Then, in the second phase, new parameters were previously inserted for comparison with known structures, existent in a database composed of 113 images previously chosen. In this work, the authors created a saturation vector, instead of a RGB pattern. This vector represents the image saturation related to the three basic colors and its histogram present the image saturation peaks. The evaluation of the histogram allows the localization of the white blood cell and its posterior segmentation. The results presented 80% of success in system without the possibility of adjustment. No method of adjustment of the proposed threshold was presented and the algorithm showed to be unstable in relation to the change of brightness of the images. Their method permitted the discrimination of closed cells and the distinction between cytoplasm and red cells proved to be efficient. The work did not present selection approaches for different white blood cells. Koya (2001) [4] reported algorithms for counting the cells of the blood, regardless of their classification. They applied the technique of “inundation” in the image, saturating the colors in the areas of interest, allowing the identification, in an automatic way, of the existent cells in a smear. Following Koya, two other works were published by the team of the Laboratory of Signal Processing (LaPSI) of the Federal University of Rio Grande do Sul (UFRGS). The application of a temporal filter is related in Schuch et al. (2004) [5] as a way of improving the signal/noise ratio of the images used for the counting of cells. In this method, several scenes of a same image are captured, making it possible to obtain medium values of these images and minimize the noise. The fuzzy logic is applied by Figueiró et al. (2005) [6] in the maps of areas of the three channels (RGB), to classify the areas found as: cells, noise and background. The proposed method achieved the correct detection 96% of the cells. In none of the works developed by LaPSI there was the concern with the classification and selection of white blood cells. Lucarini et al. (2003) [7] applied in the algorithm of indexation of connected areas, presented by Gonzáles and Tou (1974) the counting of microorganisms in a Neubauer camera. In this process, the binarized image is scanned in order to seek pixels of value 1 (black). A label is attributed for these pixels, since in their neighborhood; other pixels of value 1 may exist. At the end of the scanning, the number of labels represents the number of the cells found. The software, developed in Visual C++ 6.0 accomplished each counting in time smaller than 1 s, with mean error of 18%. For the classification of the white blood cells, Katz (2000) [8] used a double threshold in the histograms and a subsequent erosion of the image for the detection of the nucleus of the white blood cells that were extracted from the main image in sub-images, with pre-defined size of 81 × 51 pixels. A circle of exclusion was applied for the red cells adjacent to the cell of interest. The image of the cell of interest was isolated from the other elements of the main image and inserted in an artificial neural network, for recognition purposes. This work used a catalog of especially prepared images. The results presented mean error of 2% in the final recognition, mainly in the classification of the monocytes, taken erroneously as lymphocytes. The direct input of the image in an artificial neural network, with back-propagation architecture was proposed by Zheng et al. (2004) [9]. The images of the cells were captured and pre-processed manually, and the neural network received them in the proper size for analysis. In other words, only a picture, where the cell of interest was found, was inserted in the system. The results showed successes around 95% and the system was shown inconsistent for images of darker smears. According to the authors the results were not reliable.
Theera-Umpon (2005) [10] developed an algorithm based on fuzzy logic for the segmentation of the nuclei of the white blood cells found in anomalies, such as cancer. During the process, morphological operators, such as erosion and dilation of the images, were used to improve the definition of the images. A classification system, based on the Bayes theorem, estimated the probability of the found cell to be a white blood cell. The algorithm was tested in 431 images of cells previously chosen and the results proved to be better for the ripe cells (10%), while for immature cells the error approached to 16%. It is important emphasize that this work did not have the objective to recognize or to classify images, but just to segment the nucleus of the cells for subsequent recognition. In Shraddha Tripathi et al. (2012) [11], the authors present a review of different segmentation techniques used in the three major fields as Grey-scale images, medical images and hyperspectral images.
3. PROCESS AUTOMATION
The automatic system proposed in this work tried to reproduce the steps of the manual procedure for white blood cells counting, starting from the placement of the smear in the microscope. It is composed of three subsystems: traction sub-system, image capture sub-system and image processing sub-system. The traction sub-system, built with foils of aluminum, contains with two step motors that make it possible the movement of the table of the microscope. The structure allows the sweeping in x and y directions, enabling movements similar to those performed by a human operator. In order to preserve the original physical characteristics of the microscope, the metallic foils, after cut and conformed to the appropriate position, were fixed to the equipment, using bearings and screws. This sub-system is illustrated in Figure 1. The traction group is controlled by the microcomputer through the parallel port, protected by a current drive, implemented with the integrated circuit ULN2804.
The sub-system of image capture was built with a webcam coupled to the superior part of the microscope (viewfinder), as illustrated in Figures 2 and 3, using a system of fitting thread/pressure, shaped in aluminum.
The choice of the webcam for the capture system, instead of a professional camera, aimed at decreasing the costs, because the webcam, coupled directly to the USB port, do not need a capture board and the reduction of quality of the obtained images did not harm the recognition process. The third sub-system is the dedicated software. The motors and image capture control structure were articulated with the software of images processing,
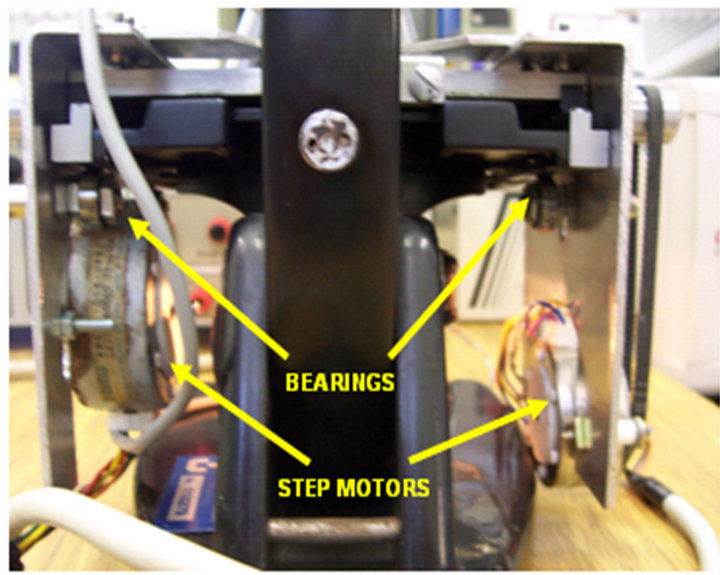
Figure 1. Rear view of the system.
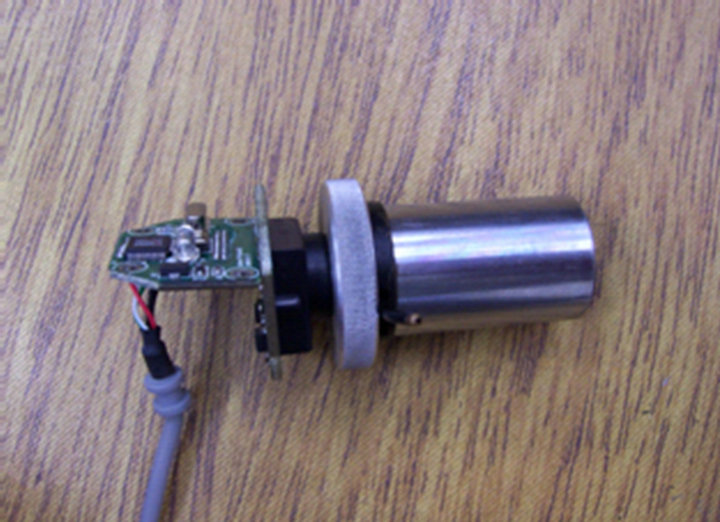
Figure 2. Webcam and lens.
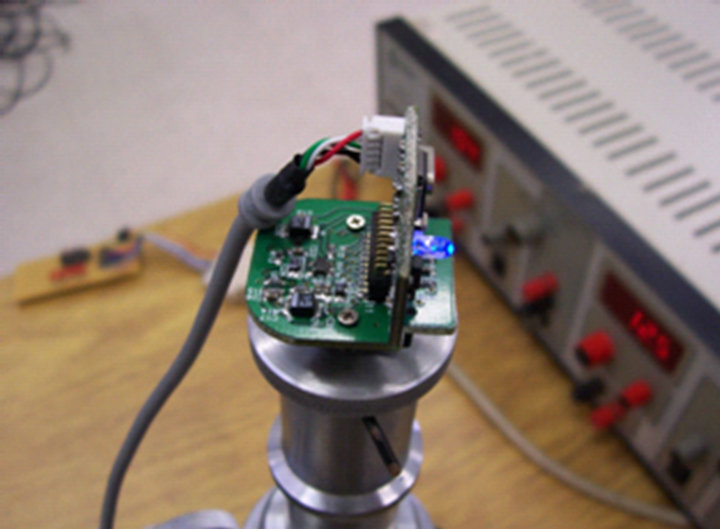
Figure 3. Sub-system coupled on the microscopy.
using algorithms for recognition of images in DELPHI®. In this sub-system, besides the graphic and man-machine interface, there are pre-processing routines for the recognition of the images. Figure 4 shows the system operation flowchart.
4. IMAGE PROCESSOR
The processing of the acquired images is based on three phases: the pre-processing, in which the elements of the image not used are discarded; classification, which separates the white blood cells from the others and selection, which identifies the type of the cells for the counting. The image, saved in the BMP format, is processed by the system, in the color format RGB. This format makes it possible the histograms generation, allowing the statistical analysis of the occurring frequencies of intensity of the three verified colors. In a first step of this project, a cell histogram catalog was created, using a program implemented in DELPHI®, for verification of the methods to be used for the image recognition. The picture, of rectangular format (640 × 480 pixels) generated by the
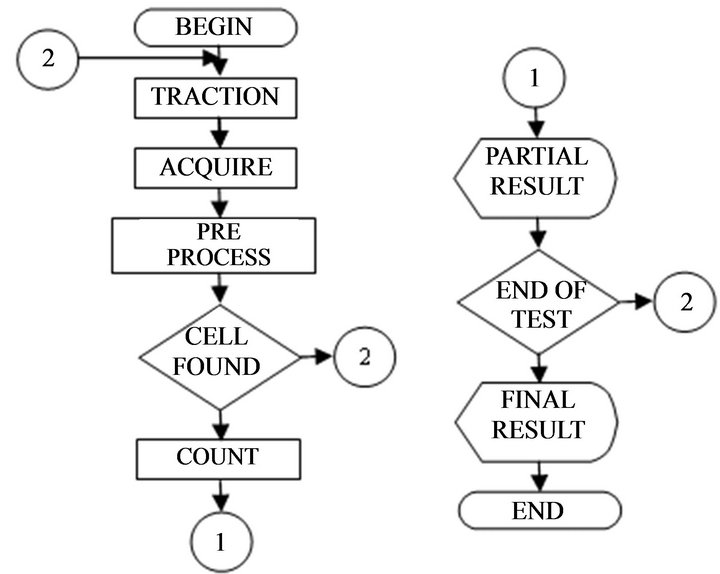
Figure 4. System operation flowchart.
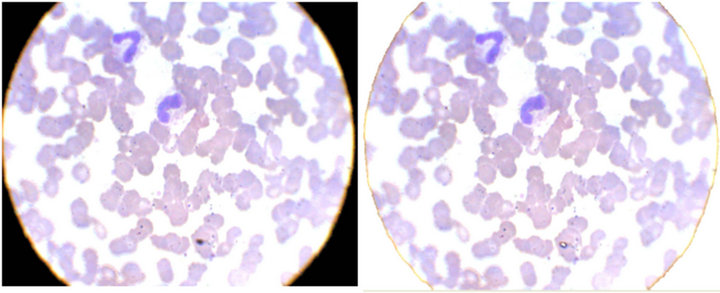
camera, did not coincide with the microscope view, in a circular way. Besides, the sludge spots and platelets captured by the lenses, which will not be analyzed in this study, can be discarded. The proposed solution was the application of a threshold in the histograms. After several practical tests, we verified that, when the three colors of image formation had, simultaneously, luminosity intensities smaller than 100 (the scale of image intensities used by the system goes from 0 (black) to 255 (white)), the pixels were not suitable for processing. With the application of the threshold, the pixels found inside the range (< 100) were converted to white and discarded. Figure 5(a) shows the image, before and Figure 5(b) shows the image after the application of the threshold.
To achieve the white blood cells recognition, first it would be necessary that these cells were isolated from the erythrocytes (red cells) that are majority in all the studied images. Analyzing the red cells histograms, using the catalog built during in the capture work, we verified that the red blood cells had “clearer” shades than the white cells and, therefore, the application of a second threshold, without alteration of the histograms, could detect shade differences, enabling the discrimination of the red cells. Figure 6 displays the image (120 × 120 pixels), after the application of the second threshold.
The images obtained by the pre-processing, in frames of 120 × 120 pixels, contained the cell of interest and erythrocytes, as show in Figure 7. The presence of the red cells generates an alteration of the histogram and makes it unfeasible the recognition. So, the application of the circle method in the interest area, proposed by Katz (2000) [8], proved to be effective. In agreement with this study, the nucleus of the white blood cells is the only area of the images used in her work with values of green intensity inferior to 100.
Similarly, when finding such values of inferior intensities, position of the cell nucleus could be determined
 (a) (b)
Figure 5. Captured image before (a), and after (b) threshold.
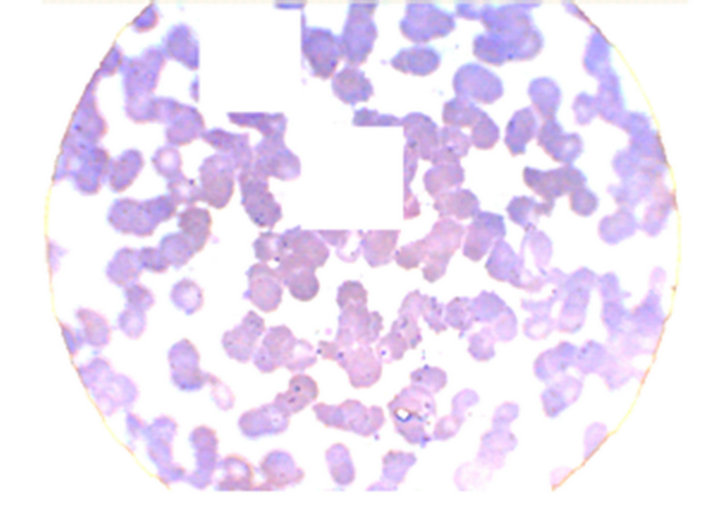
Figure 6. Image after application of the second threshold.
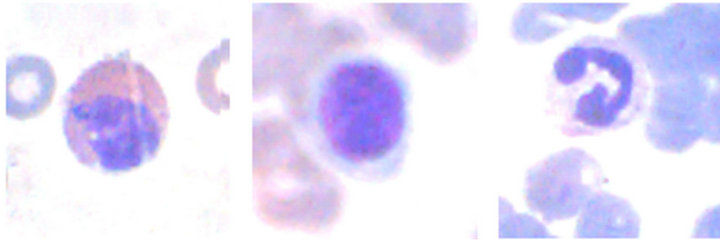
Figure 7. Frames 120 × 120 pixels with the interest area and red cells.
with a simple approach. Starting from this solution, the construction of the circle, proposed by Katz (2000) [8], around the nucleus could delimit the image, exclud- ing the erythrocytes. The circle application was accomplished in that study and this result are presented in Figure 8.
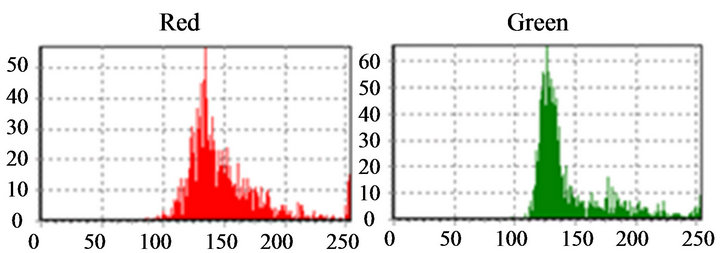
After achieving the circles that contains the interest cells, using initially a program implemented in DELPHI®, the process of definitive selection of the white blood cells continues, with the purpose of indicating each leukocyte type separately. As the interest of the analysis concentrates on the histograms peaks, the first step in the recognition structure was the vectors processing (red and green) for the two peaks location, which represent the nucleus and cytoplasm of the cell. The recognition algorithm of the first peak detects a point, where the position of a larger incidence of a certain shade was found in the histogram. The implementation of this algorithm, in
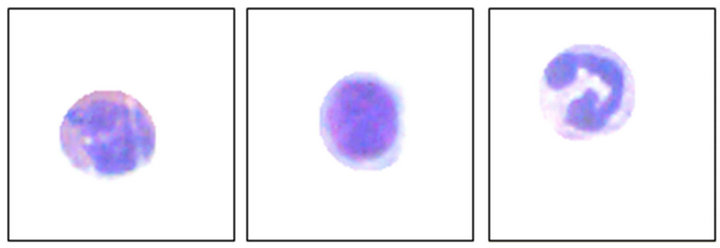
Figure 8. Frames 120 × 120 pixels with interest area.
pseudo-code is:
pico1 ← 0;
for i ← 0 to 255 do
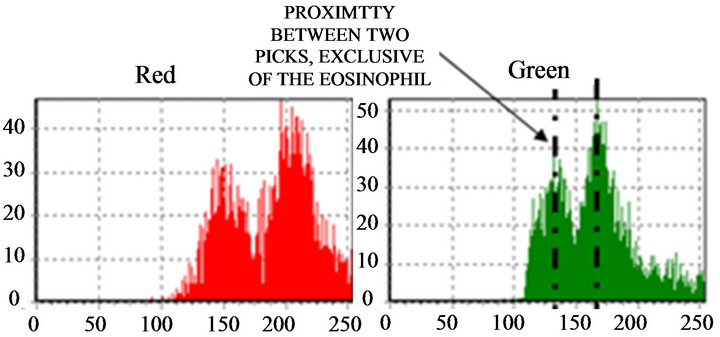
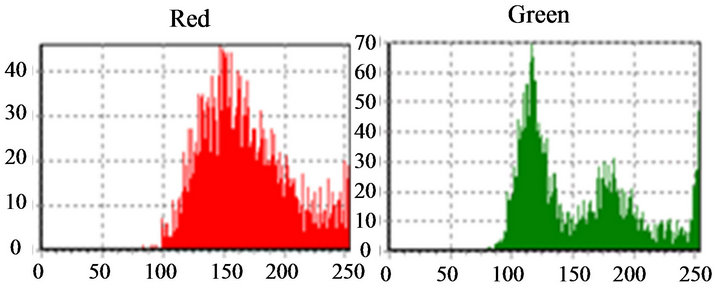
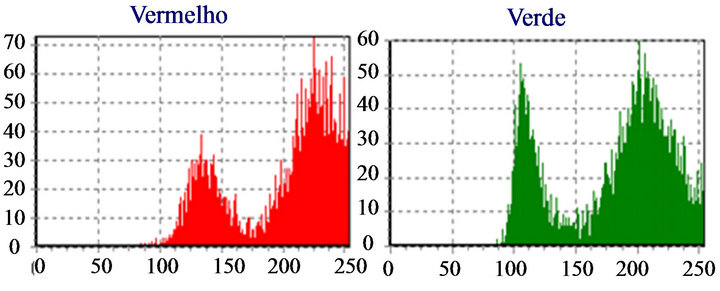
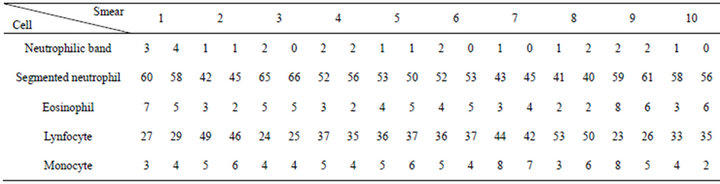
if (pico1 pico1 ← (v[i]); k ← i; end if; end for; We noticed that, when “pico1” is smaller than the value in the average vector position and the position is smaller than 250 (except for very clear points, to avoid peaks located in the histogram final positions, due to excess of white in the image), the vector value is stored in “pico1” and the average position is stored in “k”. Determined this point, the position of larger incidences will be identified. After the determination of this peak, a filter was applied, in order to avoid false peaks. The points at the beginning and at the end of this filter fulfilled the histograms study, since the absence of other peaks of interest was verified at a vectorial distance of 30 positions. This filter was implemented in the following way: for i ← (k-30) to (k+30) do if (i<>k) then v[i] := 0; end if; end for; The histogram was prepared for the location of the second peak, that it was implemented with the following structure: pico2 ← 0; for i ← 0 t0 254 do if (v[i] <> 0) and (i<>k) then if(v[i]>pico2) and (i<250) then pico2 ← v[i]; l ← i end if; end if; end for; The location of the peaks is illustrated in Figure 9. Applying the structure shown in Figure 9(c) to the catalog images, we could determine the characteristics of the histogram peaks of each type of leukocyte. Starting from these characteristics, the algorithm for recognition of white blood cell was devised. The lymphocytes main characteristic is the concentration of the largest occurring frequencies in a single peak (in the green color), as seen in Figure 10, which represents that the cell nucleus has the same gray level in almost all extension. Besides, the first peaks are in positions with vectorial distances smaller than 12. It was verified that, existing a second red peak, the distance of the first a second will be larger than 30. According to these characteristics, algorithm for counting the lymphocytes was implemented as follows. if (pico2g=0) and (kr<=135) and lr<=165 and abs(kr-kg)<=10) and ((pico2r<=picolr/2) or (pico25<>0) and abs(kr-lr)>=30)) then linfo ← linfo+1; end if; where g and r are the indexes used by the green and red histograms. The main characteristics of the eosinophil cell (Figure 11) are: the proximity between the two green color peaks and the low gray tones (positions smaller 180), which characterizes it as a dark cell cytoplasm. In the cases where the second green color peak is null, the difference between the frequencies values of the two red peaks are not inferior to 75%. Figure 9. (a) Cell histogram; (b) Pick histogram (c) Found value. Figure 10. Characteristic of lymphocytes histograms. Figure 11. Characteristics of eosinophil histograms. The counting of eosinophils was accomplished by the following algorithm. if (abs(kg-kl)<=70 and (lr<180) and ((kg<180) and (lg<=180) or (pico2g=0) and picolr>pico2r*0.75)) then eosi ← eosi+1; end if; Even though the monocyte cells, shown in Figure 12, present dark nuclei and large dimensions, their cytoplasms are differents from those of the lymphocyte. Therefore, when these peaks are low, the histogram provides a second peak, always smaller than the first, with higher levels of gray, which can be noticed mainly in the green color. So, neglecting peaks with values smaller than 50% of the main pick, them monocyte cells are characterized by a single green peak. The algorithm confirms that a monocyte cell has it first peak in a position larger than that of the lymphocyte, allowing the discrimination of the two types of cell. if (pico2g=0) and ((pico2r=0) and (kr>110) and (lr > 200) or (kr>130)) then mono ← mono+1; end if; The neutrophils cytoplasm occupies a larger area than the nucleus, that is two peaks are evident in the histograms. Figure 13 shows that the neutrophil presents larger levels of gray than those found in the cells. if (pico2g<>0) and (pico2r<>0) then if(lr>130) and (kr>200) and (lg>200) and (trar<0.02) then bastão ← bastão + 1; end if; end if; if ((pico2g=0) and (kr<130)) or (lg>200) or ((trar<0.02) and (lr>-200)) then segmentado ← segmentado+1; end if; where trar is the transverse matrix of the color (red). 5. EXPERIMENTAL RESULTS A skilled technician carried out the first tests. Five smears were used in this phase, and the reading was performed simultaneously by the system and by the human operator. The maximum margin of error was 10% and the system was three times faster than the operator. To validate the process, 10 smears were sent to the Laboratory of Clinical Analyses “Santa Lúcia”, in the city of Taubaté, with the respective results. Aiming at protecting the identity of the patients, the results of the exams were sent without individual information. Table 1 shows the comparison of the results originated from the laboratory and those found automatically by our system. For each smear, the left column show the human operator results and the right column show the system count. The differences found between the reading of the human operator and the system are similar to the occurred when one same blade is submitted the two operators. In such a way, the results obtained after the comparison show the negligible variations caused by some factors, such as: point for the beginning of the reading and clarity of the environment. Other interference factors had not been verified during the practical tests. Figure 12. Characteristics of monocyte histogram. Figure 13. Characteristics of neutrophil histogram. Table 1. Comparison of human operators x system. 6. CONCLUSION The results obtained during the phase of tests of the system can be considered satisfactory due to their high speed, accuracy and errors inferior to 15%. Therefore, the main objective of this work was completely fulfilled: the implementation of an automatic system aimed to provide an efficient aid to laboratorial exams, offering to the society, a reliable and inexpensive service. Besides, this work gives us the real importance of the interpretation of histograms in signal processing, mainly in image analysis and recognition. 7. ACKNOWLEDGEMENTS The authors thank Laboratory of Clinical Analyses “Santa Lúcia” by your help in this study. REFERENCES (c)
(c)