Journal of Biomedical Science and Engineering
Vol.6 No.3A(2013), Article ID:29549,9 pages DOI:10.4236/jbise.2013.63A047
Normalized intervertebral disc MRI signal as a biomarker of pain
![]()
1Mechanical Engineering Department, Ecole Polytechnique de Montréal, Montreal, Canada
2Research Center Sainte-Justine University Hospital, Montreal, Canada
3Sacré-Coeur de Montréal Hospital, Montreal, Canada
4Department of Surgery, Faculty of Medicine, Université de Montréal, Montreal, Canada
Email: *delphine.perie@polymtl.ca
Received 16 January 2013; revised 24 February 2013; accepted 4 March 2013
Keywords: MRI; Intervertebral Disc; Normalized Signal Intensity; Low Back Pain; Vertebral Fractures
ABSTRACT
The drop in the MRI signal intensity, analysed without any normalisation, was found related to the intervertebral disc degeneration, but its association with low back pain remains controversial. The authors developed the analysis of MR signal intensity distribution (AMRSID) method that analyzes the 3D distribution of the normalized T2-weighted MR signal intensity within the intervertebral disc using descriptive statistics of histograms and weighted centers. In this study, we hypothesized that the distribution of the normalized MRI signal intensity within T2- weighted images of the intervertebral disc is a biomarker of low back pain (LBP) independently of age and disc degenerescence. The aims were to: 1) characterize intervertebral disc degeneration in vertebral fracture from MR T1-weighted and T2-weighted images; 2) evaluate the sensitivity of the normalized MRI signal distribution to the presence of LBP, discs height loss and aging. We prospectively studied 22 patients who underwent an MRI acquisition within 48h after an accidental lumbar vertebral fracture. The presence of pre-fracture low back pain, spinal stenosis, annular disruption, intervertebral disc height loss was noted from each patient’s medical record. The presence of Modic changes, High-Intensity Zones (HIZs) and vertebral endplate perforations was recorded from MRI. The descriptive statistics of the normalized T2-weighted signal were compared using one-way ANOVAs and a principal component analysis was proposed. MRI, associated to normalisation of the signal intensity and principal component analysis, offers a remarkable potential for in-vivo imaging and analysis of vertebral fractures and adjacent tissues for the patient’s follow-up. The mean normalized MRI signal intensity of the adjacent intervertebral disc to the vertebral fracture was found to be a biomarker of pain, independently of age and disc degeneration. However, the parameters describing the distribution of the normalized signal intensity were found to be not sensitive to the presence of low back pain, discs height loss and aging. Further studies need to be performed to detect small abnormalities that may explain the presence of LBP.
1. INTRODUCTION
Vertebral endplate damage and annular tears trigger an important intervertebral disc degeneration mechanism characterized by a loss of cellularity and the degradation of the extracellular matrix that entail morphological changes and alteration of the biomechanical properties [1-6]. Secondary changes occurring from the redistribution of the tissue stresses within the intervertebral disc include fibrocartilage production, with a disorganization of the annular architecture and an increase in type-II collagen. The nucleus pulposus becomes more consolidated and fibrous, and is less clearly demarcated from the annulus pulposus.
Magnetic resonance imaging (MRI) offers an important potential for detecting vertebral endplate damage from T1- and T2-weighted images using the Modic changes classification technique [7-9]. The changes observed within the vertebral endplate and marrow are described as follow: Type 1, hypo-intense T1-weighted and hyper-intense T2-weighted; Type 2, hyper-intense on T1- weighted and isoor slightly hyper-intense T2-weighted; Type 3, hypo-intense T1- and T2-weighted. Despite the signal intensity changes observed after a successful spinal fusion [10], the significance of Modic changes following a surgical treatment remains unclear.
Early MRI work on intervertebral discs consisted in the detection of degenerative abnormalities. Diminished signal intensity in the intervertebral disc and evidence of radial tears in the annulus fibrosus were highly associated with positive symptoms on discography [11-19]. High intensity zones (HIZs) observed on MR T2- weighted images were suggested to originate from a formation of vascularised granulation tissue in the outer annulus fibrosus [20], and to be associated with annular tears [16]. However, these MRI techniques are limited to depict later stage of disease after moderate to severe changes in tissue have occurred. Weighted images are protocol dependent and do not lend themselves to direct comparison. Moreover, clinical MRI of intervertebral discs is limited by low signal-to-noise ratio, low contrastto-noise ratio, and inadequate spatial resolution [21]. Geometrical data were measured on these MR T2- weighted images of the intervertebral disc, such as the nucleus zone migration that was found significantly correlated to flexion-extension movements of the spine [22- 24] or intervertebral disc wedging in scoliosis [25-27]. The intervertebral disc volume was also measured to quantify the effect of spine fusion on the subjacent discs [28] or to improve the diagnosis of idiopathic scoliosis and spondylolisthesis [29].
Low back pain (LBP) is known to be multifactorial and may originate from different spinal structures, including ligaments, zygapophyseal joints, compressed nerve roots, the lumbar dura mater, musculature, intervertebral discs, vertebral body and endplate and the sacroiliac joints. However, whatever causes pain must have a nerve supply and can be associated with inflammation when tissue damage is involved. Annular tears and vertebral endplate damage may induce LBP as the annulus fibrosus is innervated in its outer third part and vertebral endplate alteration may lead to the introduction of inflammatory cytokines within the nucleus pulposus which can be a source of pain [30]. Some authors associated the presence of HIZs as seen from MRI T2- weighted images to a concordant pain [16,20,31-33], but not all [34]. The presence of type 1 Modic changes or combined changes including type 1 and disc degeneration were later associated with pain reproduction at discography [9,35].
While it is well recognized that the drop in the MR signal intensity is related to the intervertebral disc degeneration, its association with low back pain remains controversial. A study of the association between MRI measures and low back pain variables showed the highest association for Modic changes and anterolisthesis, significantly positive associations for hypointense disc signals and reduced disc height, and moderate association for the other disc abnormalities [36]. Disc height was also found associated with back pain variables while annular tears were found associated with LBP frequency and intensity during the twelve months before imaging [37]. However, while early disc degeneration in adolescent patients with low back pain predicted the evolution of enhanced disc degeneration and herniation in adulthood, this degeneration was not found associated with severe low back pain [38]. An increased risk of sciatic pain was found related to posterior disc bulges, but local LBP was not found related to disc degeneration [39]. Multiple logistic regression analysis demonstrated that the extent of disc herniation, the lack of sports activities, and night shift work were significant predictors for disc degeneration but a weak correlation existed between progressive disc degeneration and low back pain [40]. However, all these studies compared the MRI signal intensity drop between patients without considering the different acquisition signal gains, acquisition times, acquisition parameters (repetition and echo times), signalto-noise ratio, and patients morphologies.
The authors developed the AMRSID (analysis of MR signal intensity distribution) method that analyzes the 3D distribution of the normalized T2-weighted MR signal intensity within the intervertebral disc using descriptive statistics of histograms, weighted centers and volume ratios between the nucleus pulposus and the whole intervertebral disc [29,41]. Their study proved for the first time that changes in the intervertebral disc, non appreciated by direct visual observation as currently performed in clinics, can be detected from these specific indices. Moreover, these indices were able to discriminate between the spinal deformities and their severities, and provide essential information on the composition and structure of the discs whatever the spine deformity considered. We hypothesized that the distribution of the normalized MRI signal intensity within T2-weighted images of the intervertebral disc is a biomarker of pain independently of age and disc degenerescence. The aims of this study were to: 1) characterize intervertebral disc degeneration in vertebral fracture from MR T1-weighted and T2-weighted images; 2) evaluate the sensitivity of the normalized MRI signal distribution to the presence of low back pain, discs height loss and aging.
2. METHODS
2.1. MRI Acquisition
We prospectively studied 22 patients (8 male, 14 female, mean age of 50 years, range 23 - 77 years) who underwent an MRI acquisition (Siemens Avanto 1.5 T system) within 48 h after a lumbar vertebral fracture between 2006 and 2010 at the Hospital Sacré Coeur, with the ethic approval of the institution. The written informed consent for participation in research studies was obtained from all the participants. The MRI protocol included axial and sagittal T1- and T2-weighted Turbo Spin Echo and a sagittal short tau inversion recovery (STIR) sequence with a slices thickness of 4 mm for sagittal and 3 mm for axial images. Repetition and echo times TR/TE were 3000-3500/116-121 for T2-weighted and 602-754/ 14 for T1-weighted images.
2.2. Clinical Parameters
Fractures were categorized according to Magerl’s classification which consists in regrouping the fractures in different categories, sub-categories and specifications based mainly on the pathomorphological criteria [42]. In term of intervertebral disc degeneration, the adjacent intervertebral discs were graded using the Pfirrmann classification [43], based mostly on the structure, the signal intensity and the height of the disc as seen from T2-weighted images. Modic changes, the presence of HIZs, spinal cord compression and roots compression were also studied from both axial and sagittal images.
2.3. Image Segmentation
A semi-automatic segmentation was performed by the same operator within the nucleus pulposus, the annulus fibrosus and the whole intervertebral disc (Figure 1) using SliceOmatic software (Tomovision, Inc.). The repetition of the semi-automatic segmentation by a same operator did not influence the quality of the contour while the instructions given prior to the segmentation influenced the quality of the contour [41].
2.4. Normalisation of the MRI Signal Intensities
The MRI intensities were normalized to account for different acquisition signal gains, acquisition times, acquisition parameter), signal-to-noise ratio, and patients morphology according to the AMRSID method [29,41] using Matlab (MathWorks, Natick, MA). Each intensity value was divided by the mean signal intensity of either the cerebrospinal fluid (CSF) or the vertebral cancellous bone. Bone normalization produces an index which jointly highlights intervertebral disc and bone health, whereas CSF normalization only suppresses the effect of the acquisition gain.
2.5. Histogram Analysis
The descriptive statistics computed within the segmented zones (whole intervertebral disc, nucleus pulposus and annulus fibrosus) of each subject were the Skewness and the Kurtosis. These parameters are descriptors of the shape of the Gaussian distribution of the normalized MRI signal intensities histogram. The repetition of the semi-automatic segmentation by a same operator did not influence these MRI distribution parameters while the
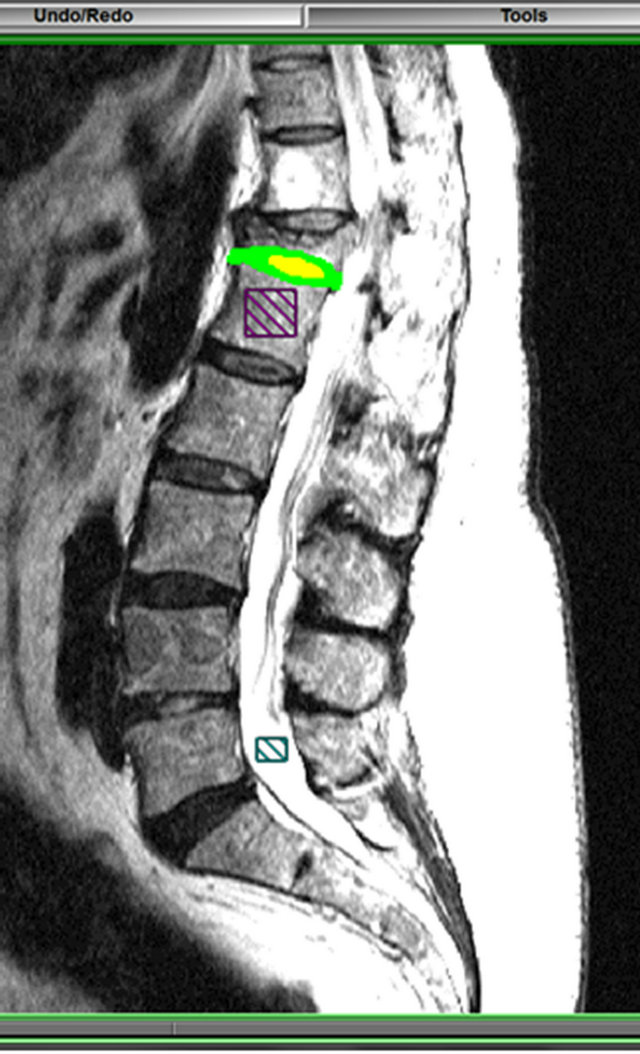
Figure 1. Region of interest segmented from the annulus fibrosus and nucleus pulposus in the adjacent intervertebral disc to the vertebral fracture, and square region of interest chosen in the CSF and in the bone.
skills of the operator and the instructions given prior to the segmentation influenced these MRI distribution parameters [41].
2.6. Center of Intensity
The center of intensity was defined as a tridimensional point which position was weighted by the MRI signal intensity in each intervertebral disc, nucleus pulposus and annulus fibrosus zones. The normalized distance between the center of intensity and the geometric center of the intervertebral disc was calculated. This distance allows minimizing the effects of the variable intervertebral disc sizes and different local coordinate systems of each disc between subjects on the result. This index represents an undirected translation in the intervertebral disc morphology from an ideally symmetric disc to a pathologic disc.
2.7. Statistical Analysis
From the each patient’s medical record, we noted the age, weight and gender. The presence of pre-fracture low back pain, spinal stenosis, annular disruption and intervertebral disc height loss were also included. Low back pain was identified using the pain drawing score. If any patient received steroids on admission, it made no difference on the pain drawing score as it concerned the six months before the fracture. The descriptive statistics of the normalized T2-weighted signal were compared using one-way ANOVAs (Xlstats, Addinsoft, New York, United States) in which the quantitative dependant variables were the MRI variables and the qualitative independent variables were LBP, age category and disc height loss. A principal component analysis was used to convert the set of possibly correlated variables into a set of linearly uncorrelated variables. The data were first centered and reduced, and organized as a matrix where each row represents a different observation of the experiment and each column gives a different mechanical or MR parameter. The covariance matrix and its eigenvectors and eigenvalues were computed. The cumulative energy content for each eigenvector was used to select a subset of eigenvectors as basis vectors. The source data were then converted into the new basis. The first principal component (F1) has the largest possible variance, and each succeeding component (F2, F3, ∙∙∙, Fn) has in turn the highest variance possible under the constraint that the current component is orthogonal to the preceding components.
3. RESULTS
3.1. Vertebral Fractures Type, IVD Degeneration Grade and Modic Changes
Eleven patients had previous history of LBP, 18 had at least one intervertebral disc with a severe height loss and 12 had a spinal stenosis with >50% compression (Table 1). Most of the fractures were of type A pattern and resulted in a vertebral foramen compression. Both medial and lateral protrusions of the vertebral body were seen from axial and sagittal T2-weighted images. Spinal cord contact and possible nerve roots compression (Figures 2 and 3) were seen in most patients. Most of the adjacent intervertebral discs were graded ≥4 mainly because of the morphological structure being completely altered. All patients had at least one Modic change type in their lumbar column. Type 1 and Type 3 (Figures 2 and 3) changes were found mostly at the site of fracture in all the 22 patients while 4 patients had Type 2 changes elsewhere within the thoracolumbar segment.
3.2. Presence of HIZs
Within the 22 patients studied, 5 patients had one or more HIZs in their lumbar column. Two of these patients had pre-fracture pain while the other 3 patients had no records related to a previous history of LBP. On the T2-weighted images, all HIZs were located in the outer third part of the annulus fibrosus. We found several profiles of HIZs anteriorly and posteriorly when looking at
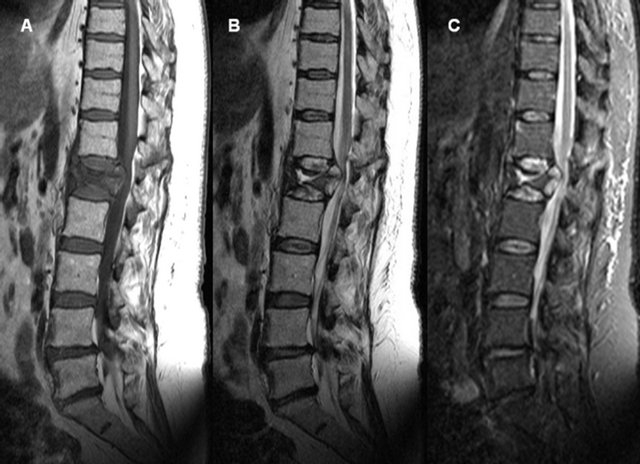
Figure 2. T1-weighted (A), T2-weighted (B) and STIR-weighted (C) mid-sagittal images of a 58 years old women smoker with a fracture of type A2.3 at L1 resulting in a severe spinal compression. Type 3 and type 1 Modic changes are observed. Fissures at the central part of T12 were also seen from axial images (not shown). Endplate perforation was seen in both the top and the bottom at L1 with an amerced NP content migration to central part of the vertebral body resulting in a local signal drop withing the T12-L1 and L1-L2 NP.
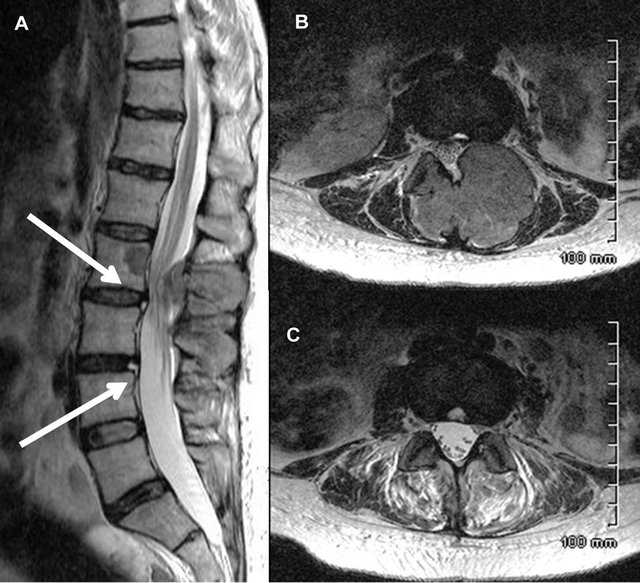
Figure 3. Sagittal T2-weighted (A) and Axial T2-weighted images at the level of HIZs (B) and (C) of a 47 years old women has severe spinal stenosis at L2-L3 and neural arch infiltration following a pathological fracture. The sagittal T2- weighted images shows high intensity zones (white arrow) located at the outer third part of the AF at L2-L3 and L3-L4.
Axial images including small concentrated areas of spherical shape and HIZs located at the outskirts part of the annulus fibrosus looking like fissures.
3.3. Mean Normalized MRI Signal Intensity
For each mean MRI signal intensity within the annulus fibrosus, the nucleus pulposus or the intervertebral discTable 1. Fractures type, degeneration grade, Modic changes and the presence of HIZ in the thoracolumbar segment for all the patients included in the study.
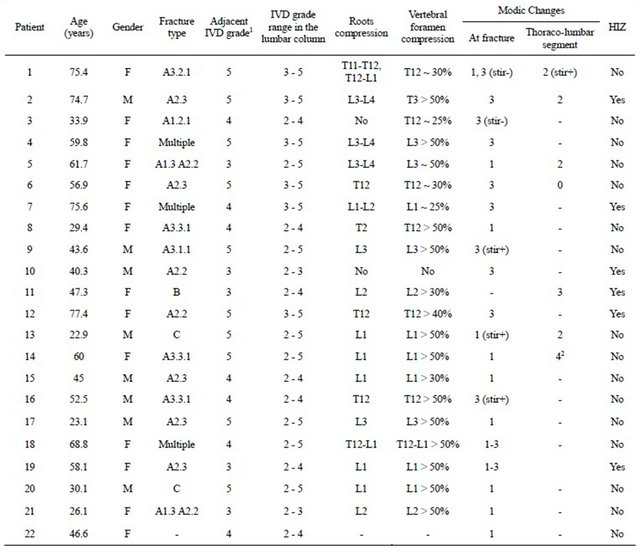
1Grade V was determined mainly from the structure of the IVD and not from its intensity; 2Type 4 Modic changes change consisted in a hyper-intense T1-weighted and hypo-intensity T2-weighted signal intensity.
normalized by either bone or CSF, the ANOVAs showed:
• No significant differences due to the age of the patient (Fisher p-value > 0.17) or due to the disc height loss (Fisher p-value > 0.05);
• Significant differences due to LBP (Fisher p-value < 0.05), except for the mean MRI signal intensity within the annulus fibrosus as normalized by CSF.
Due to the presence of LBP, the mean MRI signal intensity decreased of 35% in the nucleus pulposus or intervertebral disc and of 20% in the annulus fibrosus.
3.4. Histogram Analysis and Center of Intensity
For all distances between the center of intensity and the geometrical center, and for the descriptive statistics of the histogram (Skewness and Kurtosis), the ANOVAs showed no significant differences due to the age of the patient (Fisher p-value > 0.17), due to the disc height loss (Fisher p-value > 0.17) or due to LBP (Fisher pvalue > 0.09).
3.5. Principal Component Analysis
The spearman correlation matrix showed moderate correlations between LBP and age (r = 0.6) or disc height loss (r = 0.7). Moderate negative correlations were observed between LBP and normalized signal intensity in the NP and IVD by either CSF or bone (r = −0.7). Moderate positive correlations were observed between Skewness or Kurtosis and disc height loss (r = 0.7).
The principal component analysis reduced our fourteen variables to two principal components F1 and F2 with a cumulative variability of 62%, which increased to 75% and 85% when considering the third principal component F3 and the fourth principal component F4 respectively. The representation of the variables in the (F1, F2) plane (Figure 4) showed correlations when the parameters were located near the circle and near to each other (positive correlation) or symmetric relatively to the circle origin (negative correlation). The location of the parameters near the circle suggested that F1 and F2 expressed mainly these parameters. The location of the parameter age far away from the circle suggested that this parameter is not expressed only by F1 or F2. The eigenvectors of the covariance matrix showed that Age was expressed more by F3 than F1 or F2.
4. DISCUSSION
T1- and T2-weighted images of patients with vertebral fracture were analysed for Modic changes, HIZs, normalized mean MR intensity and parameters describing the distribution of the MR signal within the adjacent intervertebral disc to the fracture. The differences in the mean normalized MRI signal intensity between patients due to LBP and not to age nor disc height loss revealed these parameters as biomarkers of LBP independently of age and disc degenerescence. However, our hypothesis was not verified for the distribution of the normalized signal intensity within the adjacent intervertebral disc to the vertebral fracture, which was found to be not sensitive to the presence of low back pain, discs height loss, annulus fibrosus disruption, spinal compression, patient’s weight or gender and aging.
The normalization of the MRI signal intensity using the AMRSID method accounted for different acquisition signal gains, acquisition times, acquisition parameters (repetition time and echo time), signal to noise ratio (SNR), and patient morphologies. Bone normalization produces an index which jointly highlights intervertebral disc and bone health, whereas CSF normalization only suppresses the effect of the acquisition gain, as its chemical contents are invariable and produce the same MRI signal. As opposed to the results of previous studies that compared the MRI signal intensity drop between patients without any normalization [36-40], bone or CSF normalisation revealed relationships between the mean normalized MRI signal intensity and LBP only, not with age nor disc degenerescence.
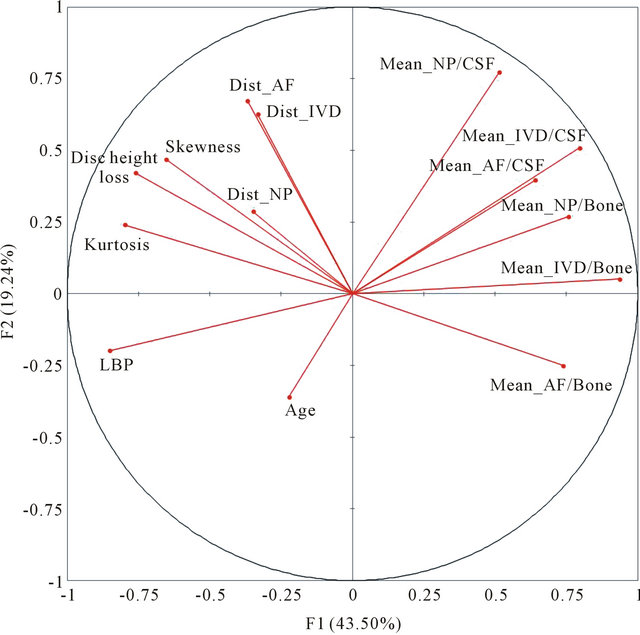
Figure 4. Representation of the LBP, age, disc height loss, skewness, kurtosis, distances (Dist) in the intervertebral disc (IVD), annulus fibrosus (AF) and nucleus pulposus (NP), and mean signal intensities (Mean) as normalized by Bone or CSF in the (F1, F2) plane of the principal component analysis.
The parameters presented in this study to analyse the MRI signal distribution within the intervertebral disc were found to be sensitive to spinal deformities including adolescent idiopathic scoliosis and spondylolisthesis and their severities [44,45]. The skewness detected the loss of the high white intensities values within the intervertebral disc, which represents the loss of the healthy nucleus pulposus and inner annulus fibrosus. The distance between the weighted center and the geometrical center of the intervertebral disc express structural and composition changes in the intervertebral disc by detecting the asymmetry in the intervertebral disc. However, all these parameters presented no significant differences in the presence of pre-fracture LBP, discs height loss, annulus fibrosus disruption, spinal compression, patient’s weight or gender and aging. The degeneration existing in the intervertebral disc before fracture does not entail asymmetry or morphologic equilibrium disturbance as spinal deformities do.
Most of the vertebral fractures seemed of type A, particularly A2 and A3 subcategories. Fractures types and characteristics were different from one patient to another and this was expected since the traumas were different for each patient. With the use of both sagittal and axial MRI images during analysis, problems of fractures classification reproducibility [46] should be substantially reduced. Surprisingly, most of compression fractures resulted in central vertebral body fissures at both next higher and next lower level. Voormolen et al. [47] has reported that bone marrow edema is presumably the result of micro fractures within the medullar bone and resultant hemorrhage. Kerttula et al. has shown that patients with an earlier vertebral fracture had higher disc degeneration and endplate injury was strongly associated with disc degeneration [3]. On the other hand, a biomechanical study on cadaveric lumbar motion segments has shown that a degenerated disc may predispose the anterior vertebral body to Stress-Shielding [48,49] and the neural arch to resist more of the spinal compressive load [48]. However, injuries to the outer and middle annulus fibrosus have a small impact on intra-discal stresses distribution, while injury to the vertebral endplate will result in an immediate and widespread effect [5]. Heyde et al. has reported that vertebral fractures, associated with a high energy spinal trauma, seem to mark an important trigger mechanism for both morphological and molecular changes of the intervertebral disc matrix [50].
In term of Modic classification, all vertebral fractures included in this study showed type 1 or type 3 within the fractured vertebrae. Type 1 changes are associated with bone marrow edema, inflammation or haematogenous vertebral osteomyelitis and as a result of disruption and fissuring of the vertebral endplate while type 3 represents abnormal fatty marrow [7,8,51]. The normal MR signal intensity of a vertebral body is influenced by fat content, marrow morphology, vascularity, edema, inflammation, and acquisition technical factors [52]. Acute vertebral compression fracture is manifested by a hypo-intense signal intensity on T1-weighted images and a hyperintense signal intensity on T2-weighted and STIRweighted within the bone marrow space [47]. On the other hand, some patient had also Modic changes of type 2 at other levels within the thoracolumbar segment. Type 2 changes are associated with a conversion of normal red hemopoietic bone marrow into yellow fatty marrow as a result of marrow ischemia [7,8,53].
All of the 5 HIZs we found were described by a hyperintense signal T2- and STIR-weighted and iso-intense T1-weighted signal suggesting highly hydrated abnormalities. Interestingly, the closest nucleus pulposus part to theses HIZs was undergoing an important signal decrease. We believe that intervertebral disc degeneration was previously triggered and the presence of these HIZ at the outskirts of the annulus fibrosus suggests also the presence of annular tears.
5. CONCLUSION
MRI, associated to normalisation of the signal intensity and principal component analysis, offers a remarkable potential for in-vivo imaging and analysis of vertebral fractures and adjacent tissues for the patient’s follow-up. The mean normalized MR signal intensity of the adjacent intervertebral disc to the vertebral fracture was found to be a biomarker of pain, independently of age and disc degeneration. However, the parameters describing the distribution of the normalized signal intensity were found to be not sensitive to the presence of low back pain, discs height loss and aging. Further studies need to be performed to detect small abnormalities that may explain the presence of LBP.
6. ACKNOWLEDGEMENTS
Funded by the Scoliosis Research Society (SRS).
The Authors would like to thank Mrs. Soraya Barchi for the support with the patients’ Medical files.
![]()
![]()
REFERENCES
- Osti, O.L., Vernon-Roberts, B., Moore, R. and Fraser, R.D. (1992) Annular tears and disc degeneration in the lumbar spine. A post-mortem study of 135 discs. The Journal of Bone & Joint Surgery (British Volume), 74, 678-682.
- Buckwalter, J.A. (1995) Aging and degeneration of the human intervertebral disc. Spine (Phila Pa 1976), 20, 1307- 1314.
- Kerttula, L.I., Serlo, W.S., Tervonen, O.A., Paakko, E.L. and Vanharanta, H.V. (2000) Post-traumatic findings of the spine after earlier vertebral fracture in young patients: Clinical and MRI study. Spine (Phila Pa 1976), 25, 1104- 1108.
- Adams, M.A. and Roughley, P.J. (2006) What is intervertebral disc degeneration, and what causes it? Spine (Phila Pa 1976), 31, 2151-2161.
- Przybyla, A., Pollintine, P., Bedzinski, R. and Adams, M.A. (2006) Outer annulus tears have less effect than endplate fracture on stress distributions inside intervertebral discs: Relevance to disc degeneration. Clinical Biomechanics, 21, 1013-1019. doi:10.1016/j.clinbiomech.2006.07.003
- Hadjipavlou, A.G., Tzermiadianos, M.N., Bogduk, N. and Zindrick, M.R. (2008) The pathophysiology of disc degeneration: A critical review. The Journal of Bone & Joint Surgery (British Volume), 90, 1261-1270. doi:10.1302/0301-620X.90B10.20910
- Modic, M.T., Masaryk, T.J., Ross, J.S. and Carter, J.R. (1988) Imaging of degenerative disk disease. Radiology, 168, 177-186.
- Modic, M.T., Steinberg, P.M., Ross, J.S., Masaryk, T.J. and Carter, J.R. (1988) Degenerative disk disease: Assessment of changes in vertebral body marrow with MR imaging. Radiology, 166, 193-199.
- Braithwaite, I., White, J., Saifuddin, A., Renton, P. and Taylor, B.A. (1998) Vertebral end-plate (Modic) changes on lumbar spine MRI: Correlation with pain reproduction at lumbar discography. European Spine Journal, 7, 363- 368. doi:10.1007/s005860050091
- Vital, J.M., Gille, O., Pointillart, V., Pedram, M., Bacon, P., Razanabola, F., Schaelderle, C. and Azzouz, S. (2003) Course of Modic 1 six months after lumbar posterior osteosynthesis. Spine (Phila Pa 1976), 28, 715-720; discussion 721.
- Horton, W.C. and Daftari, T.K. (1992) Which disc as visualized by magnetic resonance imaging is actually a source of pain? A correlation between magnetic resonance imaging and discography. Spine (Phila Pa 1976), 17, S164-S171.
- Kornberg, M. (1989) Discography and magnetic resonance imaging in the diagnosis of lumbar disc disruption. Spine (Phila Pa 1976), 14, 1368-1372.
- Linson, M.A. and Crowe, C.H. (1990) Comparison of magnetic resonance imaging and lumbar discography in the diagnosis of disc degeneration. Clinical Orthopaedics and Related Research, 160-163.
- Osti, O.L. and Fraser, R.D. (1992) MRI and discography of annular tears and intervertebral disc degeneration. A prospective clinical comparison. The Journal of Bone & Joint Surgery (British Volume), 74, 431-435.
- Schneiderman, G., Flannigan, B., Kingston, S., Thomas, J., Dillin, W.H. and Watkins, R.G. (1987) Magnetic resonance imaging in the diagnosis of disc degeneration: Correlation with discography. Spine (Phila Pa 1976), 12, 276-281.
- Aprill, C. and Bogduk, N. (1992) High-intensity zone: A diagnostic sign of painful lumbar disc on magnetic resonance imaging. The British Journal of Radiology, 65, 361- 369. doi:10.1259/0007-1285-65-773-361
- Sether, L.A., Yu, S., Haughton, V.M. and Fischer, M.E. (1990) Intervertebral disk: Normal age-related changes in MR signal intensity. Radiology, 177, 385-388.
- Yu, S.W., Haughton, V.M., Sether, L.A. and Wagner, M. (1988) Anulus fibrosus in bulging intervertebral disks. Radiology, 169, 761-763.
- Schmidt, T.A., An, H.S., Lim, T.H., Nowicki, B.H. and Haughton, V.M. (1998) The stiffness of lumbar spinal motion segments with a high-intensity zone in the anulus fibrosus. Spine (Phila Pa 1976), 23, 2167-2173.
- Peng, B., Hou, S., Wu, W., Zhang, C. and Yang, Y. (2006) The pathogenesis and clinical significance of a high-intensity zone (HIZ) of lumbar intervertebral disc on MR imaging in the patient with discogenic low back pain. European Spine Journal, 15, 583-587. doi:10.1007/s00586-005-0892-8
- Hargreaves, B.A., Gold, G.E., Beaulieu, C.F., Vasanawala, S.S., Nishimura, D.G. and Pauly, J.M. (2003) Comparison of new sequences for high-resolution cartilage imaging. Magnetic Resonance in Medicine: Official Journal of the Society of Magnetic Resonance in Medicine/Society of Magnetic Resonance in Medicine, 49, 700-709.
- Beattie, P.F., Brooks, W.M., Rothstein, J.M., Sibbitt, Jr., W.L., Robergs, R.A., MacLean, T. and Hart, B.L. (1994) Effect of lordosis on the position of the nucleus pulposus in supine subjects. A study using magnetic resonance imaging. Spine (Phila Pa 1976), 19, 2096-2102.
- Fennell, A.J., Jones, A.P. and Hukins, D.W. (1996) Migration of the nucleus pulposus within the intervertebral disc during flexion and extension of the spine. Spine (Phila Pa 1976), 21, 2753-2757.
- Brault, J.S., Driscoll, D.M., Laakso, L.L., Kappler, R.E., Allin, E.F. and Glonek, T. (1997) Quantification of lumbar intradiscal deformation during flexion and extension, by mathematical analysis of magnetic resonance imaging pixel intensity profiles. Spine (Phila Pa 1976), 22, 2066- 2072.
- Perie, D., Sales de Gauzy, J., Curnier, D. and Hobatho, M.C. (2001) Intervertebral disc modeling using a MRI method: Migration of the nucleus zone within scoliotic intervertebral discs. Magnetic Resonance Imaging, 19, 1245-1248. doi:10.1016/S0730-725X(01)00452-0
- Perie, D., Curnier, D. and de Gauzy, J.S. (2003) Correlation between nucleus zone migration within scoliotic intervertebral discs and mechanical properties distribution within scoliotic vertebrae. Magnetic Resonance Imaging, 21, 949-953. doi:10.1016/S0730-725X(03)00216-9
- Perie, D. and Curnier, D. (2010) Effect of pathology type and severity on the distribution of MRI signal intensities within the degenerated nucleus pulposus: Application to idiopathic scoliosis and spondylolisthesis. BMC Musculoskeletal Disorders, 11, 189. doi:10.1186/1471-2474-11-189
- Violas, P., Estivalezes, E., Briot, J., Sales de Gauzy, J. and Swider, P. (2007) Quantification of intervertebral disc volume properties below spine fusion, using magnetic resonance imaging, in adolescent idiopathic scoliosis surgery. Spine (Phila Pa 1976), 32, E405-412.
- Gervais, J., Perie, D., Parent, S., Labelle, H. and Aubin, C.E. (2012) MRI signal distribution within the intervertebral disc as a biomarker of adolescent idiopathic scoliosis and spondylolisthesis. BMC Musculoskeletal Disorders, 13, 239. doi:10.1186/1471-2474-13-239
- Kallewaard, J.W., Terheggen, M.A., Groen, G.J., Sluijter, M.E., Derby, R., Kapural, L., Mekhail, N. and van Kleef, M. (2010) Discogenic low back pain. Pain Practice, 10, 560-579. doi:10.1111/j.1533-2500.2010.00408.x
- Schellhas, K.P., Pollei, S.R., Gundry, C.R. and Heithoff, K.B. (1996) Lumbar disc high-intensity zone. Correlation of magnetic resonance imaging and discography. Spine (Phila Pa 1976), 21, 79-86.
- Ito, M., Incorvaia, K.M., Yu, S.F., Fredrickson, B.E., Yuan, H.A. and Rosenbaum, A.E. (1998) Predictive signs of discogenic lumbar pain on magnetic resonance imaging with discography correlation. Spine (Phila Pa 1976), 23, 1252-1258; discussion 1259-1260.
- Lam, K.S., Carlin, D. and Mulholland, R.C. (2000) Lumbar disc high-intensity zone: The value and significance of provocative discography in the determination of the discogenic pain source. European Spine Journal, 9, 36- 41. doi:10.1007/s005860050006
- Rankine, J.J., Gill, K.P., Hutchinson, C.E., Ross, E.R. and Williamson, J.B. (1999) The clinical significance of the high-intensity zone on lumbar spine magnetic resonance imaging. Spine (Phila Pa 1976), 24, 1913-1919; discussion 1920.
- Kuisma, M., Karppinen, J., Niinimaki, J., Ojala, R., Haapea, M., Heliovaara, M., Korpelainen, R., Taimela, S., Natri, A. and Tervonen, O. (2007) Modic changes in endplates of lumbar vertebral bodies: Prevalence and association with low back and sciatic pain among middleaged male workers. Spine (Phila Pa 1976), 32, 1116- 1122.
- Kjaer, P., Leboeuf-Yde, C., Korsholm, L., Sorensen, J.S. and Bendix, T. (2005) Magnetic resonance imaging and low back pain in adults: A diagnostic imaging study of 40-year-old men and women. Spine (Phila Pa 1976), 30, 1173-1180.
- Videman, T., Battie, M.C., Gibbons, L.E., Maravilla, K., Manninen, H. and Kaprio, J. (2003) Associations between back pain history and lumbar MRI findings. Spine (Phila Pa 1976), 28, 582-588.
- Waris, E., Eskelin, M., Hermunen, H., Kiviluoto, O. and Paajanen, H. (2007) Disc degeneration in low back pain: A 17-year follow-up study using magnetic resonance imaging. Spine (Phila Pa 1976), 32, 681-684.
- Luoma, K., Riihimaki, H., Luukkonen, R., Raininko, R., Viikari-Juntura, E. and Lamminen, A. (2000) Low back pain in relation to lumbar disc degeneration. Spine (Phila Pa 1976), 25, 487-492.
- Elfering, A., Semmer, N., Birkhofer, D., Zanetti, M., Hodler, J. and Boos, N. (2002) Risk factors for lumbar disc degeneration: A 5-year prospective MRI study in asymptomatic individuals. Spine (Phila Pa 1976), 27, 125- 134.
- Gervais, J., Périé, D. and Aubin, C.E. (2013) Sensitivity of MRI signal distribution within the intervertebral disc to image segmentation and data normalization. Computer Methods in Biomechanics and Biomedical Engineering, in press. doi:10.1080/10255842.2012.748756
- Magerl, F., Aebi, M., Gertzbein, S.D., Harms, J. and Nazarian, S. (1994) A comprehensive classification of thoracic and lumbar injuries. European Spine Journal, 3, 184- 201. doi:10.1007/BF02221591
- Pfirrmann, C.W., Metzdorf, A., Zanetti, M., Hodler, J. and Boos, N. (2001) Magnetic resonance classification of lumbar intervertebral disc degeneration. Spine (Phila Pa 1976), 26, 1873-1878.
- Gervais, J., Périé, D., Aubin, C.E., Parent, S. and Labelle, H. (2012) MRI signal distribution within the intervertebral disk as a descriptive factor of spine deformities. Spine, submitted.
- Périé, D. and Curnier, D. (2010) Effect of pathology type and severity on the distribution of MRI signal intensities within the degenerated nucleus pulposus. BMC Musculoskeletal Disorders, 11, 189. doi:10.1186/1471-2474-11-189
- Oner, F.C., Ramos, L.M., Simmermacher, R.K., Kingma, P.T., Diekerhof, C.H., Dhert, W.J. and Verbout, A.J. (2002) Classification of thoracic and lumbar spine fractures: Problems of reproducibility. A study of 53 patients using CT and MRI. European Spine Journal, 11, 235- 245. doi:10.1007/s00586-001-0364-8
- Voormolen, M.H., van Rooij, W.J., van der Graaf, Y., Lohle, P.N., Lampmann, L.E., Juttmann, J.R. and Sluzewski, M. (2006) Bone marrow edema in osteoporotic vertebral compression fractures after percutaneous vertebroplasty and relation with clinical outcome. AJNR American Journal of Neuroradiology, 27, 983-988.
- Pollintine, P., Dolan, P., Tobias, J.H. and Adams, M.A. (2004) Intervertebral disc degeneration can lead to “stressshielding” of the anterior vertebral body: A cause of osteoporotic vertebral fracture? Spine (Phila Pa 1976), 29, 774-782.
- Adams, M.A., Pollintine, P., Tobias, J.H., Wakley, G.K. and Dolan, P. (2006) Intervertebral disc degeneration can predispose to anterior vertebral fractures in the thoracolumbar spine. Journal of Bone and Mineral Research, 21, 1409-1416. doi:10.1359/jbmr.060609
- Heyde, C.E., Tschoeke, S.K., Hellmuth, M., Hostmann, A., Ertel, W. and Oberholzer, A. (2006) Trauma induces apoptosis in human thoracolumbar intervertebral discs. BMC Clinical Pathology, 6, 5. doi:10.1186/1472-6890-6-5
- Rahme, R. and Moussa, R. (2008) The modic vertebral endplate and marrow changes: Pathologic significance and relation to low back pain and segmental instability of the lumbar spine. American Journal of Neuroradiology, 29, 838-842. doi:10.3174/ajnr.A0925
- Lang, P., Chafetz, N., Genant, H.K. and Morris, J.M. (1990) Lumbar spinal fusion. Assessment of functional stability with magnetic resonance imaging. Spine (Phila Pa 1976), 15, 581-588.
- de Roos, A., Kressel, H., Spritzer, C. and Dalinka, M. (1987) MR imaging of marrow changes adjacent to end plates in degenerative lumbar disk disease. American Journal of Roentgenology, 149, 531-534. doi:10.2214/ajr.149.3.531
NOTES
*Corresponding author.