Journal of Cancer Therapy
Vol.2 No.2(2011), Article ID:5664,9 pages DOI:10.4236/jct.2011.22017
Identification of a 12-Gene Signature for Lung Cancer Prognosis through Machine Learning
![]()
Department of Computer Science, Houghton College, Houghton, USA.
Email: Wei.Hu@houghton.edu
Received March 18th, 2011; revised April 20th, 2011; accepted April 28th, 2011.
Keywords: Bioinformatics, Classification, Feature Selection, Gene Signature, Kaplan-Meier Analysis, Lung Cancer, Machine Learning, Personalized Medicine
ABSTRACT
Personalized medicine is critical for lung cancer treatment. Different gene signatures that can classify lung cancer patients as highor low-risk for cancer recurrence have been found. The aim of this study is to identify a novel gene signature that has higher recurrence risk prediction accuracy for non-small cell lung cancer patients than previous research, which can clearly differentiate the highand low-risk groups. To accomplish this we employed an ensemble of feature selection algorithms, an ensemble of classification algorithms, and a genetic algorithm, an evolutionary search algorithm. Compared to one previous study, our 12-gene signature more accurately classifies the patients in the training set (n = 256), 57.32% compared to 50.78%, as well as in the two test sets (n = 104 and n = 82), 67.07% compared to 54.9% and 57.32% compared to 54.8%; where the prediction accuracy was determined by the average of the four classifiers. Through Kaplan-Meier analysis on highand low-risk patients our 12-gene signature revealed statistically significant risk differentiation in each data set: the training set had a p-value less than 0.001 (log-rank) and the two test sets had (log-rank) p-values less than 0.05. Analysis of the posterior probabilities revealed strong correlation between 5-year survival and the 12-gene signature. Also, functional pathway analysis uncovered associations between the 12-gene signature and cancer causing genes in the literature.
1. Introduction
The National Cancer Institute and the Centers for Disease Control and Prevention have confirmed that lung cancer is responsible for the majority of cancer-related deaths. In 2007 (the most recent year with verified national statistics), the number of lung cancer deaths was greater than the combined total of breast cancer, prostate cancer, and colon cancer deaths [1,2].
Lung cancer is typically classified into two subcategories: either non-small cell lung cancer (NSCLC), the most common type of lung cancer, or small cell lung cancer. The two most important distinguishing factors between NSCLC and small cell lung cancer are initial tumor size and rate of growth [3,4]. In NSCLC the malignant cells do not clump together and thus are not easily observed under a microscope; instead they must be detected through bronchial or mucus cultures [4]. Also, NSCLC does not typically spread as fast as small cell lung cancer, which can grow so fast that, by the time of detection, surgical removal is impossible or has an extremely low success rate [3]. In small cell lung cancer the malignant cells tend to clump together and form masses which are readily identified visually through an x-ray or other scanning methods [3]. Because small cell lung cancer spreads so rapidly and is essentially untreatable through surgery, research tends to focus on NSCLC patients where the goal is to correctly predict the patients’ risk of cancer recurrence within 3 to 5 years (depending on the study). This enables patients who are at low-risk for recurrence to receive surgery while those at high-risk for cancer recurrence may receive more aggressive treatment plans, such as chemotherapy or radiation therapy.
In order to accomplish this classification, researchers have sought to identity gene signatures that can accurately predict lung cancer patients’ risk status (high or low) and which clearly differentiate the highand low-risk groups [5-8]. This classification process can be accomplished with the application of gene expression profiling or machine learning algorithms [5-12].
One such approach to predicting patient classification and finding a significantly deterministic gene signature involves pairing a genetic algorithm with Support Vector Machines (a classification algorithm) [9]. Another method includes the use of gene expression profiling in concert with statistical analysis, specifically Cox proportional hazards modeling [7]. A simpler approach is to use only a genetic algorithm, which is highly effective at identifying new prognostic gene signatures [10].
In [6], a multi-step gene search was conducted using both statistical tests and machine learning techniques. In the first step, unsupervised clustering of the gene dataset identified two clusters that significantly differentiated patients (p = 0.036) according to their recurrence risk. Also in the first step, the dataset was analyzed with a Cox proportional hazards model in order to select the most significant genes. Then, quantitative reverse transcription polymerase chain reaction and immunohistochemistry techniques were used to validate individual gene candidates from the tissue microarrays. Kaplan-Meier analysis on the resulting gene signature showed significant stratification of highand low-risk patients (p = 0.04). In the second step of the analysis the cluster-based classifier and the hazards-based classifier were combined and implemented on a test set; the resulting gene signature yielded a significant differentiation between highand low-risk patients (p = 0.0002).
Another study, [8], paired genetic algorithm with one of several classification algorithms (OneR, Naïve Bayes, Decision Tree, and Support Vector Machines) in order to identify the algorithm combination which yielded the highest prediction accuracy on a previously labeled dataset. The goal of their research was not to identify a new gene signature but rather to analyze the average accuracy of the classifiers.
The above research methodology first specified that the genetic algorithm be run on the dataset, in order to choose the genes which are the best predictors of patient risk status. In order to yield a more diverse set of genes between iterations, the genetic algorithm parameters were randomized within each iteration of the program; this also significantly reduced the possibility of gene favoritism in the study. Then in each iteration, once a set of genes was selected, the machine learning classifiers analyzed the set and reported their respective prediction scores. The classifiers were then ranked according to the average accuracy of their predictions over the duration of the study. The prognostic models built by the combination of the genetic algorithm with Naïve Bayes or the genetic algorithm with Support Vector Machines were found to consistently be the two most accurate predictors of patient risk status.
In [5], the gene datasets previously published in [7] were assessed with SAM Statistics and unequal variance t-tests. The genes selected by both tests were ranked by the Relief algorithm, which ranked the genes according to their prognostic accuracy and then executed a forward selection process where the top genes were added one at a time to the final gene signature until the next gene to be added did not increase classification accuracy. This process resulted in a twelve gene signature. This signature was then used with the Naïve Bayes classifier to build a prognostic model, based on the data from the censored training set (UM& HLM, n = 229), which was then tested on all three uncensored datasets: UM&HLM (n = 256), MSK (n = 104), and DFCI (n = 82).
The goal of our study is to identify a novel gene signature that can be used to distinguish between lung cancer patients with highand low-risk for cancer recurrence within 5 years. We also added the constraint that our signature must have better classification accuracy than the signature reported in [5].
2. Materials and Methods
2.1. Patient Data
The clinical data used in this study was first published in [7]. There are 22,282 gene probes provided for each patient in each of the datasets (the probe 207140_at was excluded from this study as it had only null values). The training set samples came from the University of Michigan Cancer Center (UM) and the Moffitt Cancer Center (HLM) and has 256 samples (or 229 if censored—see below). The two test sets came from the Memorial Sloan-Kettering Cancer Center (MSK, n = 104) and the Dana-Farber Cancer Institute (DFCI, n = 82). Since the three datasets came from the same study and were collected and processed with exactly the same procedures in the four affiliated research labs, they are particularly well suited for use in this study. Furthermore, this dataset is the largest lung cancer dataset currently available. Additional information regarding the data and its collection is available in [7], as well as the actual data.
During preprocessing of the data, 27 samples from the training set were censored because those patients left the study before the 5 year mark and thus we cannot accurately classify them as either highor low-risk since we do not know their survival status at the 5 year mark. These 27 censored cases were then re-added to the UM&HLM test set during validation of the gene signature, in order to provide additional test data, following standard practice in the literature.
2.2. Algorithms
In this study, three types of algorithms were employed to find a gene signature: feature selection, genetic, and classification algorithms.
Feature selection algorithms function under the premise that not all the attributes of the instances are necessary for accurate classification; thus these algorithms seek to identify a subset of the attributes which still accurately represents the characteristics of the instances. There are two common methods to accomplish this: filtering and wrapping. Filtering is typically applied as a preprocessing technique that assigns a score to each attribute and only keeps the attributes which exceed a score threshold. Wrappers select an attribute subset based on the prediction accuracy of a particular classification model [9,13].
Related to feature selection algorithms are genetic algorithms: heuristic search algorithms based on the concepts of biological evolution, such as mutation, crossover, and inheritance. These concepts are applied across each generation (iteration) of a given population.
In genetic algorithms, the population refers to the collection of individuals that compose the set of possible solutions to the given problem (typically represented as an array of bits). Thus the goal of genetic algorithms is to have the population of each generation improve upon the previous until the algorithm finds the individual (meaning the solution) with the desired fitness score within that population (depending on the problem being studied, the fitness score can be calculated in several different ways). Genetic algorithms are remarkable in the field of machine learning due to their ability to search a large space efficiently; consequently, they have found wide applications in many different fields [8,9,13-15].
Classification algorithms seek to assign a class label to each instance in a dataset. To achieve this, the dataset is divided into two non-overlapping subsets: a training set and a test set; alternatively, multiple datasets may be used, one for training and the rest for testing. Classification of the data is completed through a two phase process. In the training phase the algorithm associates the attributes of an instance in the training set with the instance’s known class label; this association defines a prediction model. In the testing phase the model is applied to the instances in the test set in order to evaluate the effectiveness of the model at correctly predicting class labels. This process of training and testing is known as supervised learning [13,16].
2.3. Software
Most of the research completed in this study was carried out using WEKA 3.4 [17], a collection of open source machine learning algorithms for data mining (supported by the University of Waikato, New Zealand). Custom Java programs were written which used WEKA’s feature selection, genetic, and classification algorithms.
All statistical analysis for this study was performed with the use of the program R [18], the PAMR package of R, and Microsoft Excel 2007. In R, the PAMR function plotsurvival was used to determine the survival curves and plot them for Kaplan-Meier analysis. Also the built-in function t.test was used to implement the unequal variance t-tests (by default it is a two-tailed test and uses the Welch-Satterthwaite equation to find the degrees of freedom automatically). Excel was used to generate all graphs and the confidence function was used to find and plot the 95% confidence interval for Figure 4. The SAM plug-in for Excel was used to perform SAM analysis. Functional pathway analysis was carried out through Ingenuity Pathway Analysis (IPA) [19].
2.4. Statistical Methods
Three statistical methods were used in our study: two for selecting significant genes and one for validation of our signature, following the methodology used in [5].
The two methods used for selecting significant genes were Significance Analysis of Microarrays (SAM) and unequal variance t-tests. Unequal variance t-tests check the null hypothesis that a gene has the same means for highand low-risk groups of patients. From the test’s resulting t-value, a p-value is calculated. This p-value represents the probability of the two means to be equal. Typically a gene with p-value < 0.05 is said to have statistically different means for highand low-risk patients. SAM also checks the null hypothesis that a gene has equal means for highand low-risk patients. However, SAM additionally provides a tuning parameter, delta, which is used for determining the significance threshold (and thus the number of significant genes identified by SAM) and which influences the false discover rate (FDR) [20]. These two tests work well in tandem to ensure that the genes selected are significant in risk status differentiation.
The third statistical method used was Kaplan-Meier analysis, which creates a survival curve for a given dataset. The main benefit of using Kaplan-Meier analysis is the support it offers for data censoring. Typically Kaplan-Meier analysis is used in conjuncture with the log- -rank test in order to compare survival curves. The log-rank test produces a (log-rank) p-value, which represents the measure of how much evidence we have against the null hypothesis of no difference between the two survival curves. If the p-value is less than 0.05 it is considered to be statistically significant and we reject the null hypothesis.
2.5. Highand Low-Risk Determination
In order to determine the accuracy of our classification predictions, we need to define what “high-risk for cancer recurrence” means in our study. We defined it following the typical definition found in the literature: any patient who has cancer recurrence within 5 years of initial treatment will be labeled as “high-risk”; all other patients are labeled ‘low-risk’. This is also the primary definition used in [5], allowing for better comparison between our results.
2.6. Gene Selection Method
Learning from the approach in [5], we used the following methodology (summarized in Figure 1). First, an ensemble of seven feature selection algorithms was chosen to select the genes that are most significant for accurate classification of patient survival. We used the following feature selection algorithms: FilteredAttributeSelection, InfoGain, Relief, SymmetricalUncertainty, InfoGainRatio, OneR, and ChiSquared.
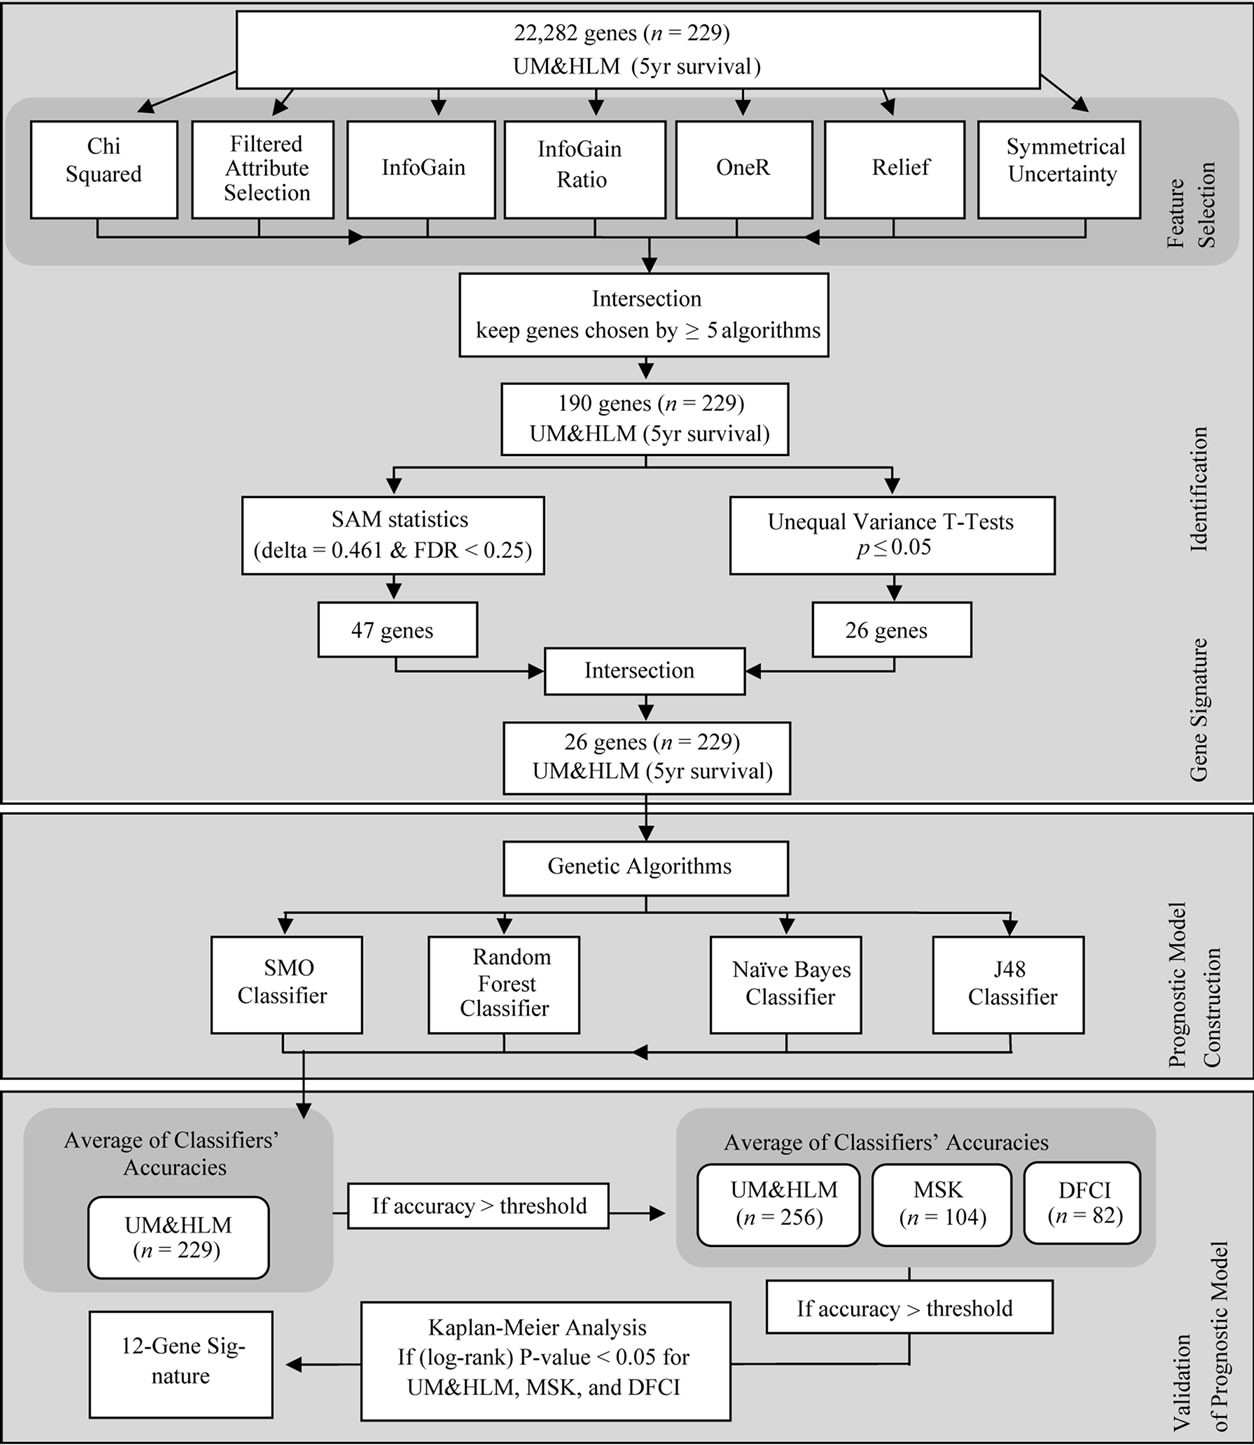
Figure 1. Search process for identification of the 12-gene signature.
To limit the number of genes selected, only the genes that were chosen by at least five of the feature selection algorithms were carried through to the next step (we chose five algorithms because it was the largest number of algorithms that returned a large set of genes; the intersection of six and of seven algorithms returned fewer than 13 genes—which we felt was too specific a set). This process produced a set of 190 genes.
To find the significant genes, SAM statistics (using delta = 0.461 with FDR < 0.25) and unequal variance t-tests (with p ≤ 0.05) were independently run on the set of 190 genes. These two statistical tests enabled us to reduce the number of genes to only those which are the best predictors of patient risk. The intersection of the tests’ results yielded a set of 26 genes.
Next, the genetic algorithm was applied to the set of 26 genes to find the gene subsets which produce the highest prognostic classification accuracy. For each gene subset selected as a candidate signature by the genetic algorithm, we took the average of the classification results for our four classifiers (Naïve Bayes, Random Forest, J48, and SMO) on the training dataset (UM&HLM, n = 229). If the gene subset’s accuracy exceeded a threshold, set equal to the accuracy reported in [5] for the training set, then that gene subset was recorded in a log file for further analysis.
We next confirmed that each recorded gene subset had better prediction accuracy for the test sets (UM&HLM, n = 256; MSK, n = 104; and DFCI, n = 82) than reported in [5] (again computed by taking the average of the prediction accuracy reported by the four classifiers). For the gene subsets that passed this test, we then computed the differentiation of each gene-set’s lowand high-risk survival curves, found through Kaplan-Meier analysis, producing a p-value (log-rank) for each dataset.
Of the gene sets examined, only the 12-gene signature (Table 1) had both higher prediction accuracy than the signature reported in [5] and statistically significant risk differentiation (p < 0.05) for all three datasets.
The parameters for the genetic algorithm which yielded the final 12-gene signature were nine generations, a population size of 16, a crossover probability of 48.5%, and a mutation probability of 20.3%.
3. Results
3.1. Overview
In order to determine the prediction accuracy reported by each classifier for a given dataset, the WEKA API was called from a custom Java program which also stored the WEKA output. If the average of the four classifiers’ prediction accuracy for the training set (UM&HLM, n = 229) exceeded the given threshold, then the results were also logged in a text file.
The text file logs contained the detailed results for all four classifiers and their average for the training set and all three test datasets: UM&HLM (n = 256), MSK (n = 104), and DFCI (n = 82). Next, all the text file logs were manually reviewed and compared in order to identify the gene signatures most likely to yield the desired signature characteristics (highest prediction accuracy and smallest p-value). After that, a posteriori probabilities histogram and the survival curves were generated for the most promising gene signatures. These further results were then manually compared to select the gene signature with the highest overall prognostic accuracy and the lowest (log-rank) p-value for the three test datasets.
3.2. Classification Accuracy
The classification performance of our 12-gene signature for all three datasets was higher than in [5]. Specifically, we observed average prediction accuracy scores 6.58%, 12.17%, and 2.52% higher than [5] for the UM&HLM, MSK, and DFCI datasets respectively; full prediction results can be found in Table 2.
Using Kaplan-Meier analysis on patient highand low-risk groups, we were able to plot the two respective survival curves (Figure 2—the prediction results used to generate the survival curves came from the Random Forest classifier, which yielded the highest accuracy predictions
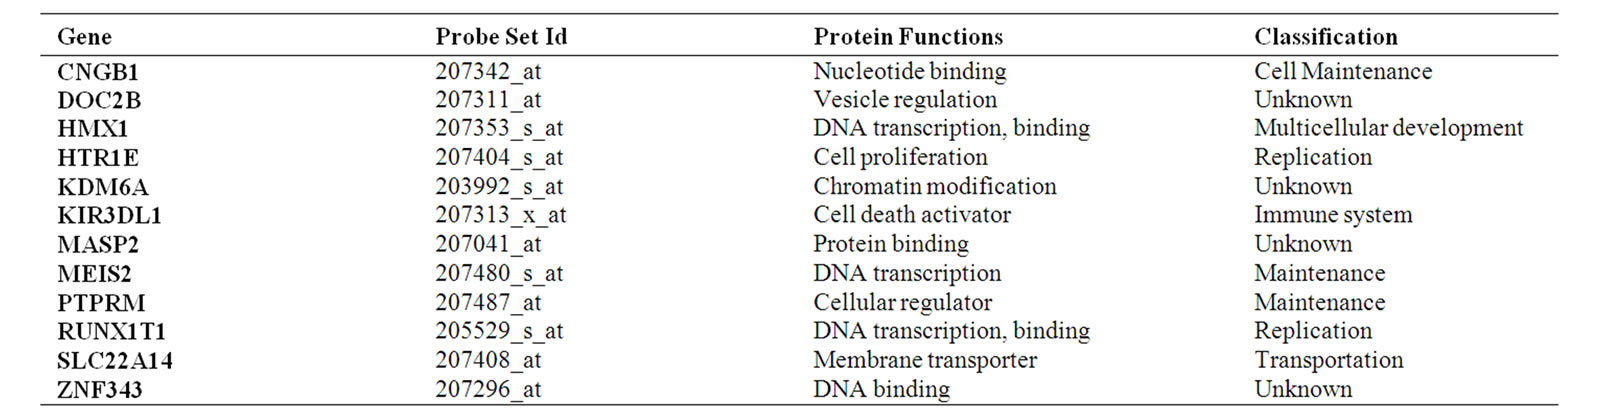
Table 1. The 12-gene signature. Gene name, protein function, and classification obtained from IPA literature.
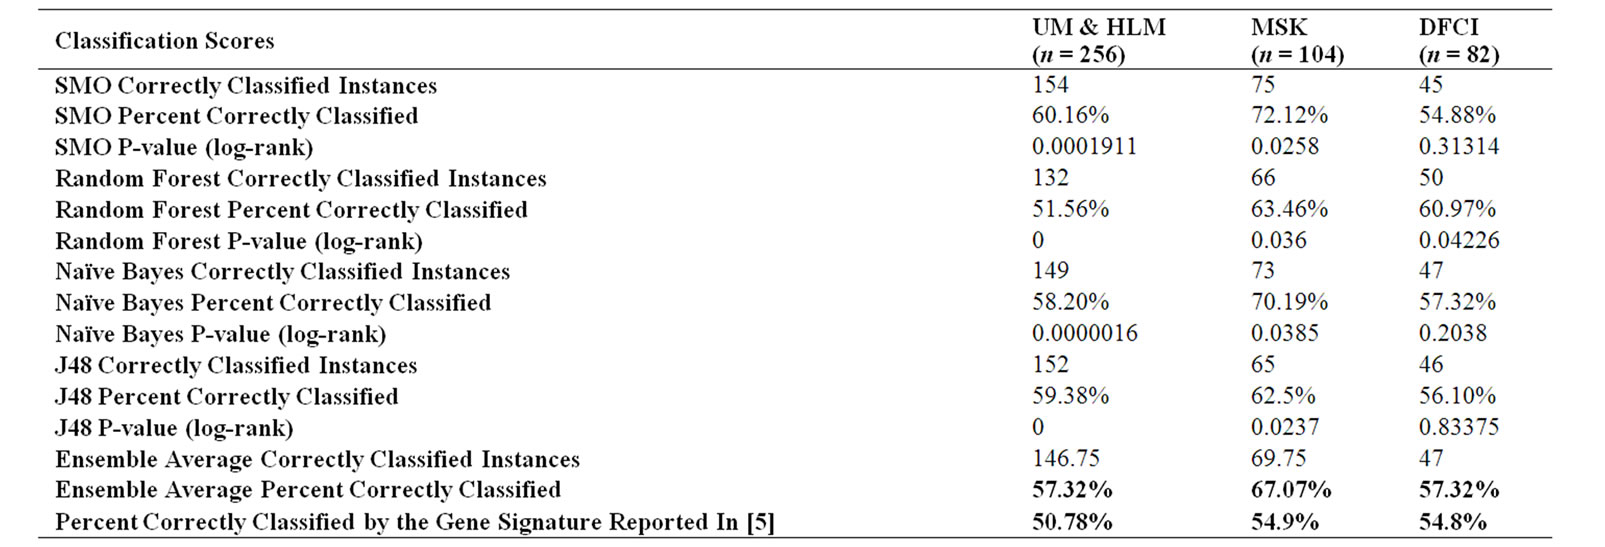
Table 2. Comparison of prediction accuracy between our 12-gene signature and the gene signature from [5].
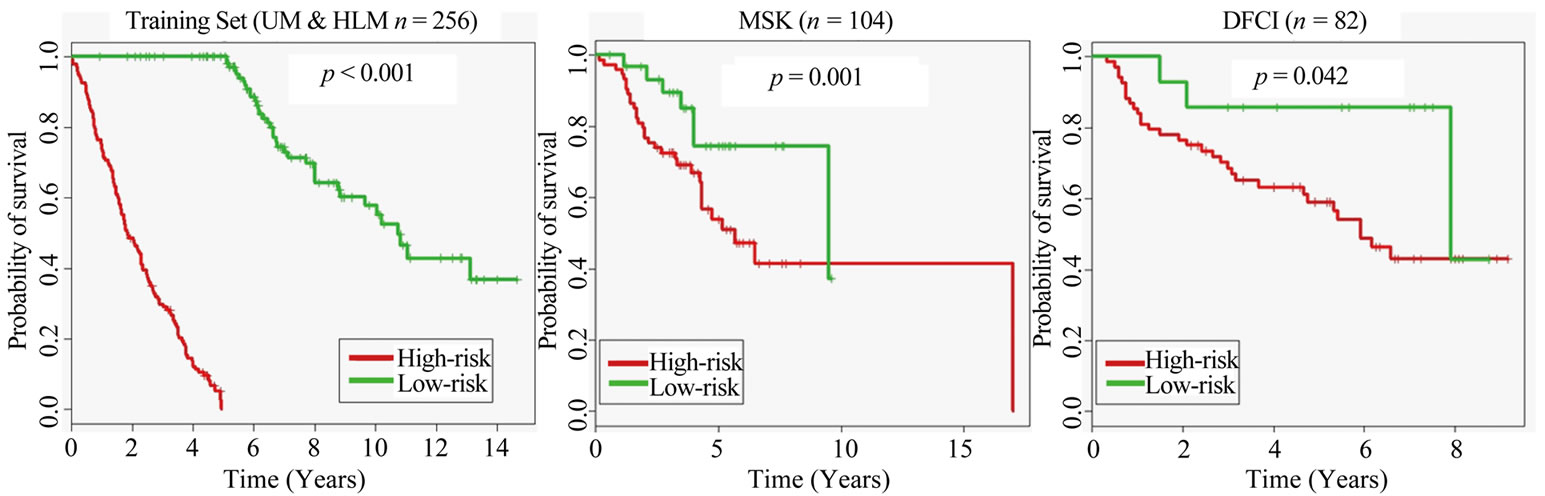
Figure 2. Kaplan-Meier survival graphs for the three datasets, created using the prediction results of the Random Forest classifier from our ensemble of classifiers.
and the lowest p-values). The differentiation between the curves yielded the (log-rank) p-values for each dataset.
The training set achieved a p-value < 0.001 and the test sets both achieved p-values < 0.05; meaning that the highand low-risk curves were very well differentiated and we rejected the null hypothesis that the risk groups were identical.
This shows that our 12-gene signature is valid for patient risk status differentiation.
3.3. Correlation of Posterior Probability with Survival
The histogram presented in Figure 3 reveals the frequency of the distribution of posterior probabilities amongst the different bins. Observe that the classifier was more likely to classify an instance as high-risk than low-risk and that the distribution slightly resembles an inverse bell-curve (except on the lowest posterior probabilities).
The graph in Figure 4 establishes the connection between the 12-gene signature posterior probabilities and the average rate of death at five years. Note that the 95%
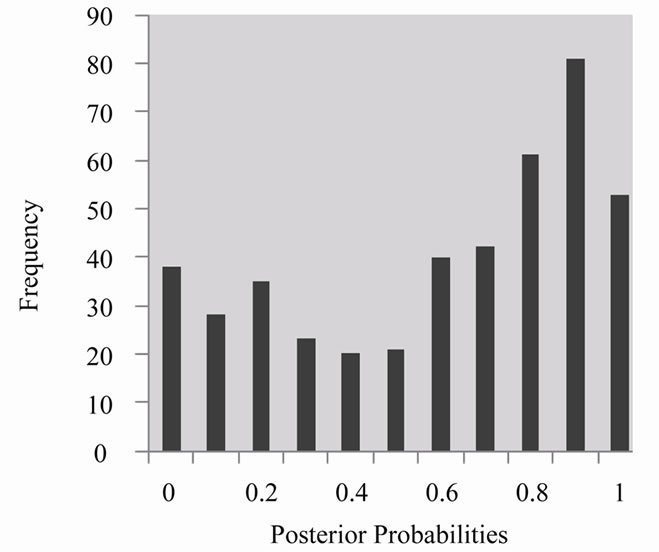
Figure 3. Posterior probabilities histogram generated from Random Forest classifier results.
confidence margin is wide for the lower posterior probabilities due to small bin sizes but is very narrow for the higher posterior probabilities, where the bin sizes increased by two or three times those of the lower posterior
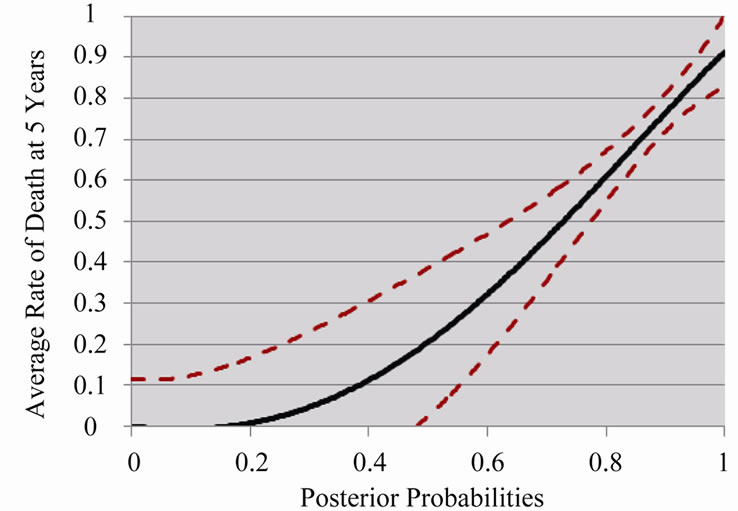
Figure 4. Average rate of death at 5 years based on posterior probabilities generated from Random Forest classifier (with 95% confidence margin).
probabilities—this is a result of the unequal frequency distribution presented in Figure 3 which favored highrisk predictions.
3.4. Functional Pathway Analysis
Using Ingenuity Pathway Analysis (IPA) [19], we found that the 12-gene signature is strongly associated with other genes responsible for cancer growth in the literature (Figure 5). In particular CDH1, Histone h3, and beta-estradiol have been linked to cancer growth and, as can be seen in Figure 5, they serve as the center nodes that our signature genes connect to in the network of gene interactions.
The functional pathway analysis also revealed signifi-
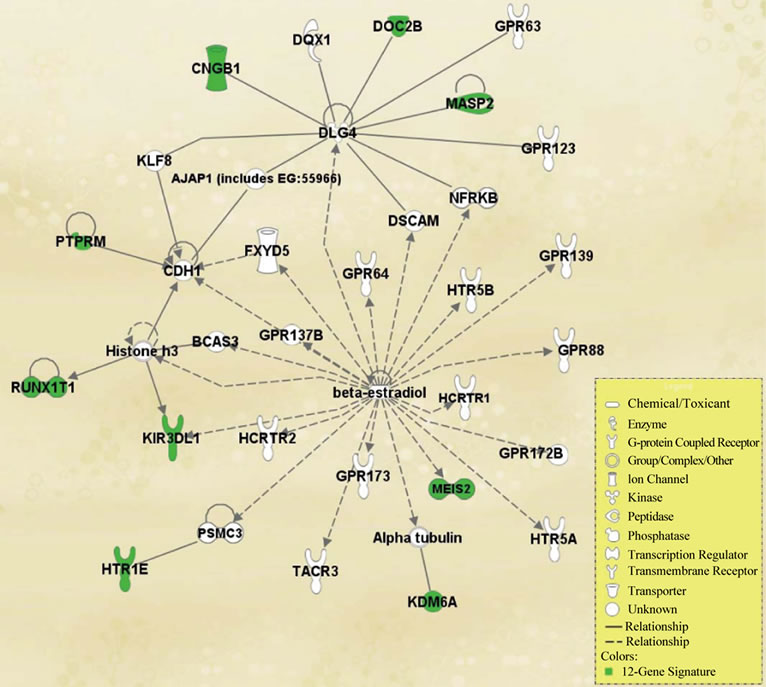
Figure 5. Functional pathway analysis of the 12-gene signature, generated through core analysis from Ingenuity Pathway Analysis. Genes present in our signature are highlighted.
cant correlation with other diseases, such as Crohn’s disease, Huntington’s disease, hypertension, diabetes, schizophrenia, and bipolar disorder. In every case, three or more genes from the 12-gene signature were associated with each of the above diseases, according to the literature available through IPA. While we do not know the significance of these results, and they lie outside the scope of this research, we feel they are worth reporting.
3.5. Survival Covariate Decision Tree
As part of this study we also sought to determine which clinical covariates had the strongest connection with patient survival and then display this information in an easy to understand graphical form. Our work was motivated by [5], where a multivariate Cox hazards analysis on the clinical variables was presented in a table format.
To this end, we evaluated the original clinical data published in [7] with the J48 decision tree algorithm. Specifically, we used the censored MSK (n = 65) and censored DFCI (n = 64) datasets; a collection of 129 patients with known survival status. As with the training set censored patients, these patients were censored because they left the study before the 5 year mark and thus we do not know their survival status at the 5 year mark.
The resultant decision tree, in Figure 6 below, indicates that the age at diagnosis and the tumor differentiation are the two most important covariate predictors for patient survival.
4. Discussion
In this paper we identified a novel gene signature for lung cancer risk prediction which has higher classification accuracy than previous research. While our results are an improvement in classification over those presented
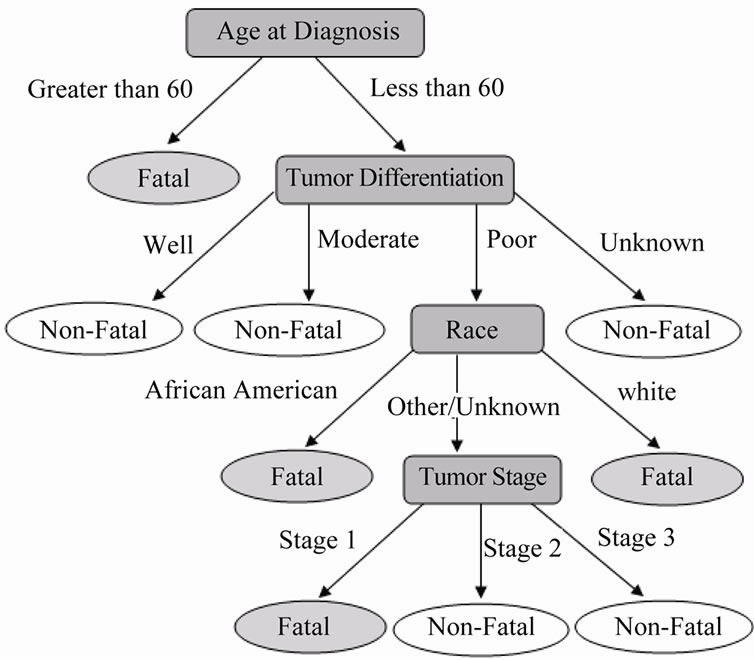
Figure 6. Survival decision tree for clinical covariates.
in [5], which was in turn an improvement over previous research, there are still several potential problems with the application of the 12-gene signature in clinical settings.
Although we were able to achieve an increase in overall classification accuracy, we still are incorrectly classifying 30% - 40% of patients. This means that while the majority of patients will receive well tailored treatment plans, there are still many patients who will receive too aggressive treatment or, worse, who won’t receive strong enough treatment to stop their cancer.
There are several possibilities for further research that could improve the accuracy of the methodology presented in this paper. One avenue for improvement would be to not re-include any of the censored patients in the test sets. Though this goes against the common practice in the literature and reduces the sizes of our test sets, it would likely lead to higher accuracy results. Another possibility for improvement would be to focus on identifying a larger gene signature, say in the range of 20 - 35 genes. While this would be on the large side of the range typically presented in the literature, it stands to reason that such a signature would be more accurate at predicting patient risk status. A third option for increasing the accuracy of our methodology would be to use genetic algorithms first, before the feature selection algorithms and the statistical tests. This could yield much more diverse sets of genes for analysis, one of which might have better accuracy.
5. Conclusions
In this study we successfully identified a novel gene signature for lung cancer risk prognosis that has greater prognostic classification accuracy than signatures reported by previous research, such as [5], and is also statistically significant at differentiating between highand low-risk patients.
In the comparison, our 12-gene signature outperformed previous research in terms of classification accuracy and is also statistically significant in differentiating between the highand low-risk groups in the UM&HLM, MSK, and DFCI datasets under Kaplan-Meier analysis. In addition, posterior probability calculations showed a direct correlation between the 12-gene signature and patient survival at 5 years. Furthermore, functional pathway analysis revealed strong connection between the signature and known cancer causing genes from the literature. The analysis also suggested that our 12-gene signature may be associated with several other well known diseases.
These results, observed during validation, imply that our 12-gene signature is appropriate for use in lung cancer patient risk determination.
5. Acknowledgements
The authors would like to thank Houghton College for financial and technical support. We also thank YingWooi Wan for correspondence regarding [5].
REFERENCES
- Centers for Disease Control and Prevention, 2011. http://www.cdc.gov/cancer/lung/index.htm
- A. Jemal, et al., “Cancer Statistics,” CA Cancer Journal for Clinicians, Vol. 56, No. 2, 2006, pp. 106-130. doi:10.3322/canjclin.56.2.106
- D. Jackman and B. Johnson, “Small-Cell Lung Cancer,” The Lancet, Vol. 366, No. 9494, 2005, pp. 1385-1396. doi:10.1016/S0140-6736(05)67569-1
- A. End, “Diagnosis and Treatment of Lung Cancer – Non-Small Cell Lung Cancer, Small Cell Lung Cancer and Carcinoids,” European Surgery: ACA Acta Chirurgica Austriaca, Vol. 38, No. 1, 2006, pp. 45-53. doi:10.1007/s10353-006-0209-0
- Y.-W. Wan, et al., “Hybrid Models Identified a 12-Gene Signature for Lung Cancer Prognosis and Chemoresponse Prediction,” PLoS ONE, Vol. 5, No. 8, 2010. doi:10.1371/journal.pone.0012222
- M. Raponi, et al., “Gene Expression Signatures for Predicting Prognosis of Squamous Cell and Adenocarcinomas of the Lung,” Cancer Research, Vol. 66, No. 15, 2006, pp. 7466-7472. doi:10.1158/0008-5472.CAN-06-1191
- K. Shedden, et al., “Gene Expression-Based Survival Prediction in Lung Adenocarcinoma: A Multi-Site, Blinded Validation Study,” Nature Medicine, Vol. 14, 2008, pp. 822-827. doi:10.1038/nm.1790
- J.-Y. Yeh, “Applying Data Mining Techniques for Cancer Classification on Gene Expression Data,” Cybernetics & Systems, Vol. 39, No. 6, 2008, pp. 583-602. doi:10.1080/01969720802188292
- B. F. De Souza, et al., “Applying Genetic Algorithms and Support Vector Machines to the Gene Selection Problem,” Journal of Intelligent & Fuzzy Systems, Vol. 18, No. 5, 2007, pp. 435-444.
- J. Yu, et al., “Feature Selection and Molecular Classification of Cancer Using Genetic Programming,” Neolpasia, Vol. 9, No. 4, 2007, pp. 292-303.
- J. Hongying, et al., “Joint Analysis of Two Microarray Gene-Expression Data Sets to Select Lung Adenocarcinoma Marker Genes,” BMC Bioinformatics, Vol. 5, 2004, p. 81. doi:10.1186/1471-2105-5-81
- A. Bhattacharjee, et al., “Classification of Human Lung Carcinomas by mRNA Expression Profiling Reveals Distinct Adenocarcinoma Subclasses,” Proceedings of the National Academy of Sciences, Vol. 98, No. 24, 2001, pp. 13790-13795. doi:10.1073/pnas.191502998
- P. Larrañaga, et al., “Machine Learning in Bioinformatics,” Briefings in Bioinformatics, Vol. 7, No. 1, 2006, pp. 86-112. doi:10.1093/bib/bbk007
- D. E. Goldberg, “Genetic and Evolutionary Algorithms Come of Age,” Communications of the ACM, Vol. 37, No. 3, 1994, pp. 113-119. doi:10.1145/175247.175259
- B. Mallick, et al., “Bayesian Classification of Tumors by Using Gene Expression Data,” Journal of the Royal Statistical Society, Series B (Statistical Methodology), Vol. 67, No. 2, 2005, pp. 219-234. doi:10.1111/j.1467-9868.2005.00498.x
- D. E. Goldberg, “Genetic Algorithms in Search, Optimization and Machine Learning,” Kluwer Academic Publishers, Boston, 1989.
- Waikato Environment for Knowledge Analysis, 2011. http://www.cs.waikato.ac.nz/ml/weka/
- The R Project for Statistical Computing, 2011. http://www.r-project.org/
- Ingenuity Pathway Analysis, 2011. http://www.ingenuity.com/products/pathways_analysis.html
- Significance Analysis of Microarrays, 2011. http://www-stat.stanford.edu/~tibs/SAM/