Intelligent Information Management
Vol.6 No.3(2014), Article ID:46415,14 pages DOI:10.4236/iim.2014.63017
A Petri Net Pareto ISO 31000 Workflow Process Decision Making Approach for Supply Chain Risk Trigger Inventory Decisions in Government Organizations
James A. Rodger, Pankaj Pankaj, Ata Nahouraii
MIS and Decision Sciences, Eberly College of Business & Information Technology, Indiana University of Pennsylvania, Indiana, USA
Email: jrodger@iup.edu
Copyright © 2014 by authors and Scientific Research Publishing Inc.
This work is licensed under the Creative Commons Attribution International License (CC BY).
http://creativecommons.org/licenses/by/4.0/


Received 14 April 2014; revised 3 May 2014; accepted 20 May 2014
ABSTRACT
The Petri Net Pareto method proposed in this study has the advantages of acting directly on computing results by assessment of workflow process information. Our study contributes to the literature because it has investigated an ISO 31000 workflow process approach to group decision making for reducing backorders in the supply chain, from an integrated perspective utilizing Pareto charts and Petri nets. The contribution to the literature is also enhanced by the L-Project illustrative example that presents an evaluation hierarchy of supply chain risk. The proposed method is appropriate for use in situations in which assessment information may be qualitative or precise quantitative information is either unavailable or too costly to compute.
Keywords:Supply Chain Management, Backorder, Risk, Triggers, ISO, Inventory, Petri Nets, Pareto Charts

1. Introduction
The Defense Logistics Agency (DLA), in doing its job, it manages over 5.2 million items of supply. Daily, the DLA responds to over 54,000 requisitions and lets over 8,200 contracts, and contract actions including delivery orders and modifications [1] . There are two types of applications in a Supply Chain Management (SCM) system: planning and execution [2] [3] . Planning applications use statistics and advanced algorithms to determine the best way to fill an order. Analysis of overhead times obtained from each of the suppliers can be used to find the fastest resource for their needs. On the other hand, execution applications implement the day to day activities of the supply chain flows. They track the physical status of goods, the management of materials, and financial information involving all parties.
Many researchers have used empirical studies and algorithms to unravel the different distribution, planning and control aspects of SCM [4] . These approaches include stochastic [5] multi-agent models [6] , and subsystem models [7] [8] . Optimal inventory modeling of systems using multi-echelon techniques have also been employed to study backorders [9] . These studies have provided useful insights with different sensitivity and reliability [10] . Intelligent multi-agent systems, using distributed artificial intelligence, could be built into the planning application to provide an intuitive and exploratory tool that can be enhanced as needed. Decision makers can also use it for a quick overview of the supply chain process and to investigate supply chain issues through independently constructed modules and scenarios.
Ideally, the topology of a supply chain is defined by nodes and arcs [3] . The nodes or entities interact with each other through the arcs or connectors as an order is fulfilled in a supply chain. Each node performs five main actions with regard to the order life cycle: creation, placement, processing, shipping and receiving [3] . The order has to be created by an inventory policy or customer request. This creation is made known to the supply chain by placement. There may be processing delays with the order transport. The order has to be shipped to the origination node, and when it is received, the order is consummated. Statistical analysis can help to model inventory and demand management. It will integrate such actions by investigating the inventory and demand processes owned by the nodes that stock items. This design will provide much flexibility in understanding component stocking through the supply chain. The ultimate planning system may be run on a server or a PC, since web-based planning applications have become a prominent source of software deployments [11] . The planning application domain is shown in Figure 1.
This study reports on a customizable, automated decision support tool that uses triggers and subsequent analysis of those triggers to produce a range of outputs for a given scenario or data input. ISO 31000 workflow processes were examined utilizing both Petri Nets and Pareto Charts to plan and manage system programs to maximize their operational availability and performance. The value and benefits of this decision support tool prototype can be extended to other systems. Future efforts will refine and enhance the risk analysis methodology, develop a pro-
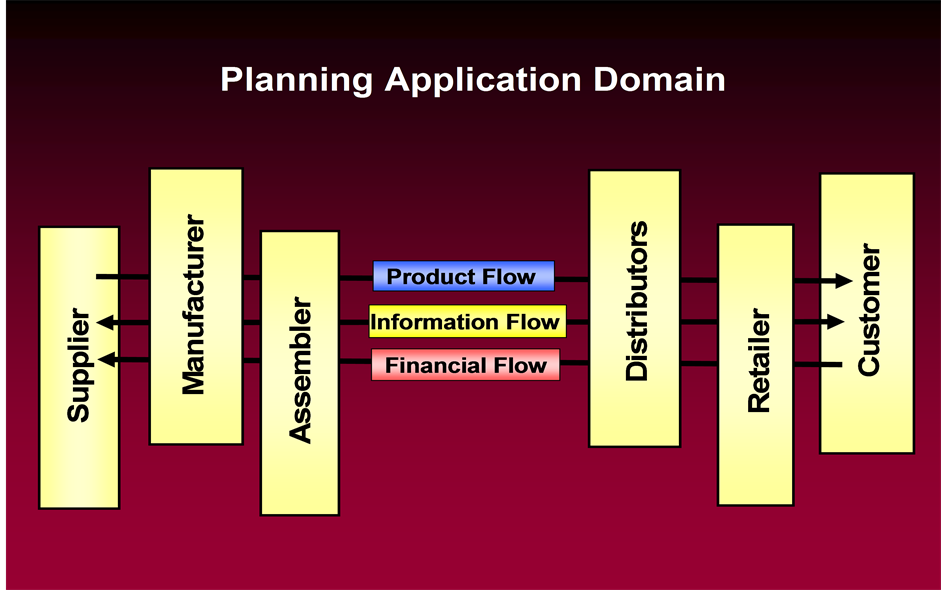
Figure 1. The planning application domain.
totype decision support tool, and apply it to other systems that are operating beyond their original service lives. The resulting ability to proactively predict and address problems with parts availability before they occur will help avoid backorders, reduce the costs associated with meeting unexpected shortfalls, and increase supply chain readiness and effectiveness in the planning application domain.
Triggers were chosen for analysis from the various supply items listed by National Stock Number (NSN). The criteria used to determine high risk levels for these items and the groupings of the items were determined following an initial assessment of the triggers. ISO 31000 process methods were used to evaluate the triggers for parts backorders and to assess future sustainment, risks, and benefits of using new technology to address logistics readiness factors that affect equipment service life. The analysis included a review of the data on past maintenance history, stock-on-hand reports, Federal Logistics Information System procurement and technical data, casting and forging data, U.S. Marine Corps 339 lists, and the Warstopper Surge & Sustainment list. The process resulted in the creation of a trigger methodology for risk identification and prioritization, problem identification, and further analysis of alternatives to mitigate risk and to recommend a path forward.
The rest of the paper is organized as follows. In Section 2, we provide an overview of an ISO 31000 workflow process approach to reducing backorders in the supply chain and reviewing the supply chain risk management literature. In Section 3, we propose L-Project, Pareto charts and Petri nets to present an evaluation hierarchy of supply chain risk. In Section 4, we propose an approach for evaluating the supply chain trigger risks. In Section 5, we present an illustrative example. In Section 6, we conclude the paper with a summary.
2. Approaches to Reducing Backorders in the Supply Chain
Supply Chain Management
Backorders, risk, and supply chain delays have all been studied extensively [12] . However, no study has utilized Pareto charts and Petri nets to present an evaluation hierarchy of supply chain risk. The contribution to the literature is also enhanced by the L-Project illustrative example that presents an evaluation hierarchy of supply chain risk For example, Shin et al. [13] noted that because of the rapid changes in globalization, technical innovation, and competition, interdependence among operators in the supply chain has intensified. When one operator is exposed to even a small amount of risk, it is capable of disrupting the balance of the entire supply chain. Shin et al. used a Bayesian belief network to develop a framework of alternative backorder replenishment and to minimize the total replenishment cost and expected risk cost. Blackhurstra et al. [14] demonstrated that coordinating and managing distributed entities in a supply chain challenging in part because of the conflicts present in such systems. They extended the concept of basic Petri nets to discover supply chain conflict before it occurs and has detrimental effects on system performance. Brijesh and Chandrasekharan [15] determined the best installation inventory control policy or order policy parameters in a static divergent two-stage supply chain with one distributor and many retailers. They did this by using a genetic algorithm-based heuristic methodology to optimally solve problems over a large finite time horizon.
Huang et al. [16] used compound Poisson demand to study the inventory system of an online retailer. Using real-time data on outstanding orders and customer wait times, they produced a decision rule for emergency orders that minimized expected costs under the assumption that no further emergency orders would occur. Liu et al. [17] argued that as supply chains become more dynamic, there is a need for a sense-and-respond capability to react to events in real time. They proposed using Petri nets extended with time and color (to represent case data) to manage events, thus making very complex problems tractable. Chan and Chan [18] argued that supply chains need to be flexible because they are subject to a variety of uncertainties, such as customer demand and supplier capacity. This is particularly true for make-to-order supply chains, whose material flow is only triggered by customer orders. These researchers used simulation to study how flexibility and adaptability in delivery quantity and due date can improve performance in a network of two-level multi-product make-to-order supply chains. Olsson and Tydesj [19] developed a model with Poisson demand for a single-product and single-stock location in which the replenishment lead time from the external supplier was fixed, the lifetime of the product was also fixed, and aging was assumed to begin when the order was placed.
To show the importance of considering both dimensions of uncertainty in system modeling (i.e., stochastic variability and imprecision), Tüysüz and Kahraman [20] used stochastic Petri nets together with fuzzy sets to model and analyze time-critical, dynamic, and complex systems. Toktas-Palut and Ulengin [21] coordinated the inventory policies in a decentralized supply chain with stochastic demand by means of contracts and modeled a queuing system in which centralized and decentralized models were developed. Their comparison of the optimal solutions to these models revealed that the supply chain needs coordination. Bayındıra et al. [22] investigated the desired level of recovery under various inventory control policies when the success of recovery was probabilistic. Four inventory control policies that differed in timing and information were used in purchasing decisions with the objective of finding the recovery level and inventory control parameters that minimized the average total cost over the long run.
According to Mahadevan et al. [23] , sustainability has become a major issue in most economies, causing many leading companies to focus on product recovery and reverse logistics. Their research is focused on product recovery, in particular production control and inventory management in the remanufacturing context. They use a “push” policy that combines these two decisions. Yeh et al. [24] argued that the mobility of popular goods on the shelves has a crucial impact on store sales and that to confirm the demand for a commodity, stores traditionally use a point-of-sale system to monitor inventory. In order to prevent monetary loss due to an information gap, they proposed the use of an intelligent service-integrated platform that uses the software agent as the framework to construct the integrated information system mechanism as well as uses radio frequency identification technology to realize the smart shelf as the trigger point for the retrieval of the commodity message. Gunasekaran and Ngai [12] encouraged further research on the modeling and analysis of global outsourcing, optimization between product variants and the cost of production, the point of differentiation along the production/assembly process, the selection of suppliers, logistics costs, and customer relationship management.
Agarwal et al. [25] made the case that with the emergence of a business era that embraces change, manufacturing success and survival are becoming more and more difficult to ensure. They presented a framework that encapsulates market sensitiveness, process integration, information drivers, and flexibility measures of supply chain performance while exploring the relationship among lead time, cost, quality, and service and the leanness and agility of a case supply chain in fast-moving consumer goods business.
3. A Framework for Evaluating Supply Chain Backorder Risk Triggers (SCBORT)
This section presents a framework for evaluating SCBORT. The framework consists of two parts: a cluster analysis with Pareto charts and a colored Petri net evaluation scheme. Throughout this iterative process, triggers were identified, modified, and refined for acceptance. This task was accomplished through weekly team meetings with project stakeholders. Additional refinements to the individual triggers were made during weekly project team teleconferences. Cluster analysis was used to develop an evaluation scheme to assist managers to identify SCBORT and to identify which dimensions should be targeted for improvement.
3.1. Cluster Analysis of SCBORT
Cluster analyses involve sets of heuristic algorithms, and cluster analysis is a generic name for a variety of procedures that can be used to group data into natural groupings [26] . Factor analysis is used to form a correlation matrix of similarities among cases. Classical factor analysis is then performed on the N × N matrix, and the data are assigned to clusters based on their factor loadings [27] . A primary objective of identifying SCBORT was to group or sort the NSNs analyzed into logical groupings, or buckets. The project team was tasked with creating or determining groups of triggers for subsequent analysis. One promising statistical inference technique for grouping triggers into homogenous subsets is variable cluster analysis. This technique is used to explain the dimensionality of a set of data by creating hierarchical sets of clusters based on a matrix of distances or, alternatively, similarities. Put simply, the procedure groups triggers into increasingly similar clusters. The result is a dendrogram, which allows a user to visualize the relationship among the triggers—in other words, to see which triggers occur together most often. Using this graph, one may select an acceptable level of similarity or difference, drawing a horizontal line to indicate how many clusters or groups the triggers form.
The triggers in this study cluster into two distinct groupings; several triggers appear to function independently but can be logically placed into three clusters (see Figure 2). Both groupings are intuitively logical. One group contains Triggers 2, 6, 7, and 11. Items that have not been purchased recently (Trigger 2) will generally have an eroded supplier base (Trigger 11). This leads to the availability of insufficient technical data (Trigger 6), which increases administrative lead time and production lead time (Trigger 7). The other major group includes Triggers 8, 16, and to a lesser extent, 10a. Items that are heavy maintenance/wear NSNs (Trigger 8) will generally see an increase in demand during wartime. Some of these items will also have low peacetime demand, which qualifies
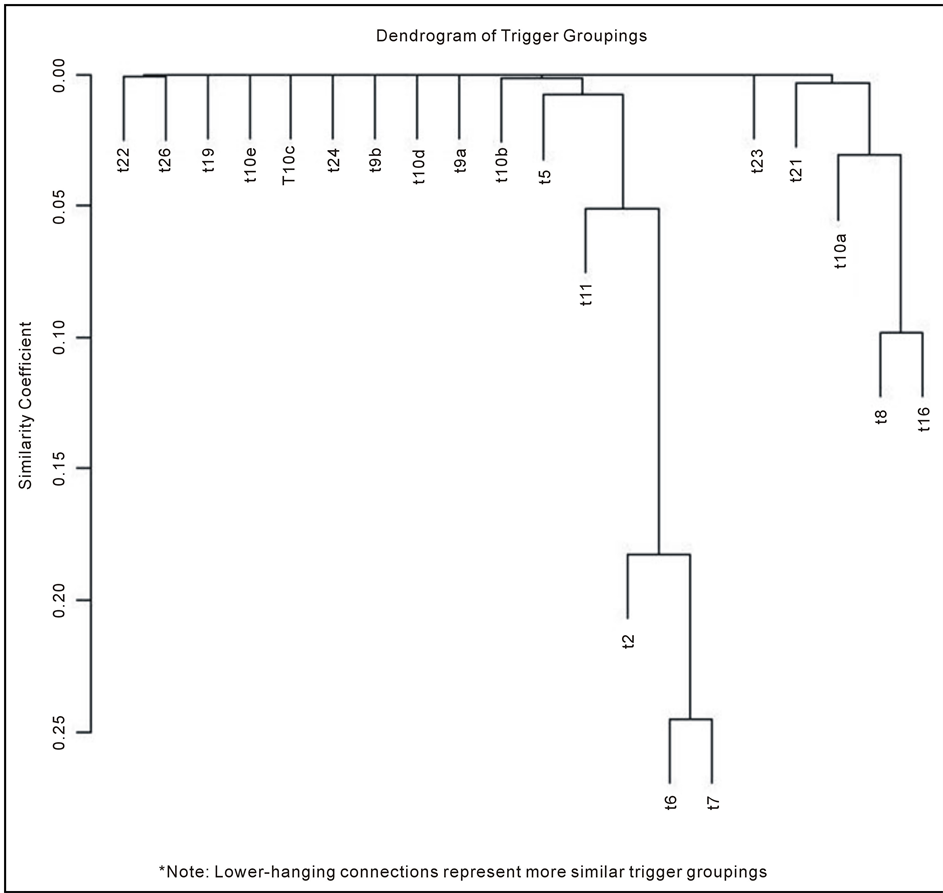
Figure 2. Dendogram of trigger groupings. Lower hanging connections represent more similar trigger groups.
them for the Warstopper Surge & Sustainment program (Trigger 16). Moreover, items with high wartime demand but low peacetime demand will naturally have some degree of pricing anomaly (Trigger 10a).
Of course, these results could change with the inclusion or exclusion of specific triggers or with the addition or removal of influential NSNs. However, this approach is beneficial insofar as it does not require any a priori knowledge of the relationship among triggers or the underlying distribution of each trigger. This technique can also be extended to more conventional hierarchical cluster analysis, in which cases (NSNs) are grouped into increasingly similar clusters based on their status for a particular set of triggers. With a large number of NSNs, this can be both computationally intensive and difficult to interpret. Therefore, nonsensical triggers are dropped from the bucket list.
Cluster analysis can also be used to find natural groupings of data. Specifically, factor analysis is used to assign multi-sensor data to clusters based on factor loadings. In accordance with the five basic steps required for a cluster algorithm, the sample data were selected, a set of variables to measure was defined, the similarities among the entities were computed, factor analysis was used to create similar groups, and the resulting cluster solution was validated. This process allowed for the separation of data into identifiable groups that fit logically with the research model. The natural groupings consisted of four impact clusters or dimensions—market sensitiveness, process integration, information drivers, and flexibility—that can be measured by the five probability metrics of lead time, cost, quality, service level, and information availability [28] . Table 1 presents a simple count of the NSNs that meet the criteria for each of the established triggers.
3.2. Pareto Chart and Colored Petri Net Evaluation Scheme for SCBORT
Chart 1 is a stacked Pareto chart that displays the results of the trigger analysis by percentage. Chart 2 is a stacked bar chart that identifies actual numbers of NSNs identified by queries against the 19 triggers. In both charts, the percentage of NSNs that match each trigger is in red; the percentage of NSNs that do not match is in green.
3.3. Petri Net and International Organization for Standardization (ISO) 31000 Evaluation Scheme for SCBORT
The evaluation scheme followed the ISO 31000. Accordingly, the context of the risk was established first, and then the following risk management steps were undertaken: identification of risk in a selected domain of interest, planning of the remainder of the process, and mapping out of the social scope of risk management. This process took into consideration identification of stakeholders and their objectives and the identification and evaluation of risk constraints within the context of this stakeholder analysis. This was followed by defining a framework for the activity and an agenda for identification and developing an analysis of risks and the mitigation of these risks using available technological, human, and organizational resources (ISO, 2013; ISO/DIS 2009). A colored Petri net was then utilized to integrate these steps and illustrate transitions [29] .
Network-centric manufacturing involves the rapid assembly and seamless coordination of dynamic supplier networks to accelerate production and reduce costs. These supplier networks have three key traits:
• Agility: the ability to quickly change form and structure.
• Connectivity: the ability to coordinate and collaborate regardless of disparate computer systems.
• Visibility: the ability to view individual processes throughout the network.
Requirements for successful network-centric manufacturing include a common connecting technology, the skills to orchestrate a wide variety of participants, and a managing organization that is accepted as a trusted third party.Figure 3 illustrates the overall workflow of the network-centric manufacturing enterprise procurement process.
A group of unique NSNs was analyzed and reviewed by investigating past maintenance history, stock-on-hand reports, and market impact. Then a trigger methodology was created to identify and prioritize risk, identify problems, and analyze alternatives to mitigate risk. Triggers were applied to the complete NSN list; NSNs were then sorted to develop a short list of high-risk NSNs using the process illustrated in Figure 4.
The NSN new technology insert process involved sorting the list by NSNs that have historically required heavy maintenance and then performing a root-cause analysis on the NSNs identified to determine which new technology could be inserted into the platform. New technologies could include electronics, new materials, and so on. The next step was to design, source, and prototype new NSNs with the new technology and then create and capture metrics to document benefits and savings and to identify families of parts or NSNs with similar nomenclature that could also benefit from new technology (see Figure 5).
The NSN technical review process involved locating all available technical data packages (TDPs) associated with an NSN by searching and sorting for technical data across multiple government databases. Each TDP was then reviewed for completeness. In many cases, additional technical information was referenced within the TDP, which then needed to be located in order to complete the package. Potential suppliers with the capabilities to manufacture the NSN could then be selected. The NSN request for proposal process could then be initiated when the TDP was complete, as shown in Figure 6.
The Electronic Mall (EMALL) on-demand manufacturing thread process utilized the Department of Defense EMALL program. This program, which is operated by the Defense Logistics Information Service, allows military personnel and other authorized government customers to search for and order items online from government and commercial sources. Before EMALL can be used, NSNs and suppliers must be loaded into the program and customers for these NSNs identified and qualified. The customer logs into EMALL, selects an NSN, and adds it to the cart; adds the quote details and quantity, delivery, and contract information; attaches the applicable files (TDP); and releases the request for quote (RFQ). The supplier receives notification of the RFQ via email, reviews the
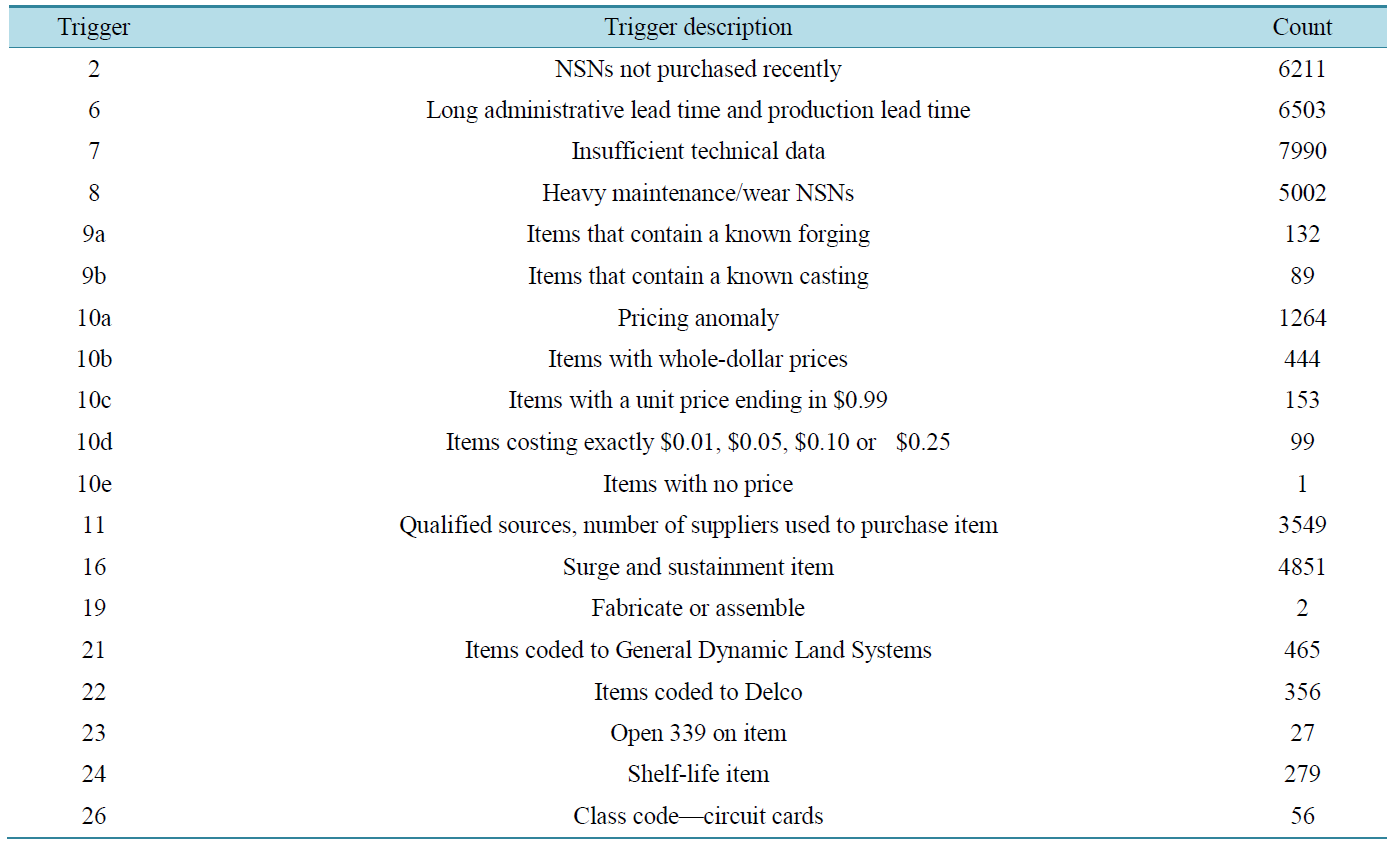
Table 1. Count of national stock numbers (NSNs) by trigger.
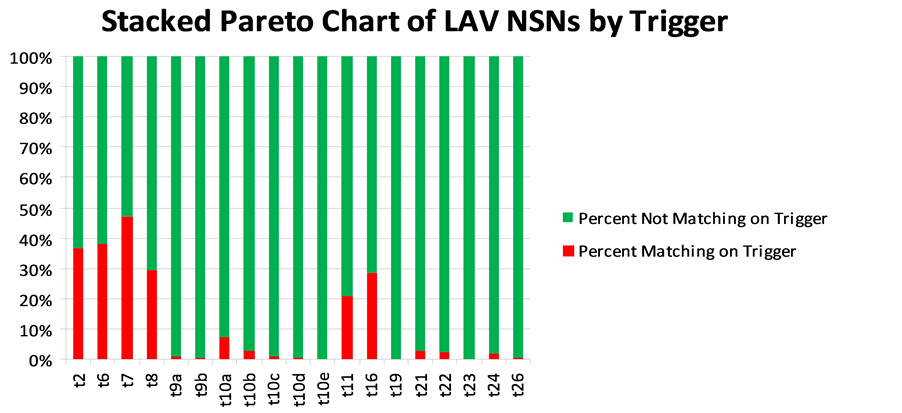
Chart 1. Stacked Pareto chart of light armored vehicle (LAV) National Stock Numbers (NSNs) by trigger.
RFQ, and responds to the customer via email with either a quote or “no bid”. The customer receives and reviews the quote and either accepts the quote, checks out, and releases the order or rejects the quote and notifies the supplier. This workflow process is shown in Figure 7.
The NSN request for proposal process requires a secure TDP and verification of the existence of potential suppliers within the supplier database with the capability to manufacture the NSN. If suppliers do not exist, then new vendors with the required capabilities must be located and brought on board to create a sourcing event. The next step is to receive and review proposals from the suppliers or, in the event that no bids are received or the TDP has insufficient or incomplete data, to determine what is preventing suppliers from responding. The creation of an advanced TDP is then required to provide the necessary information to encourage bidding, as shown in Figure 8.
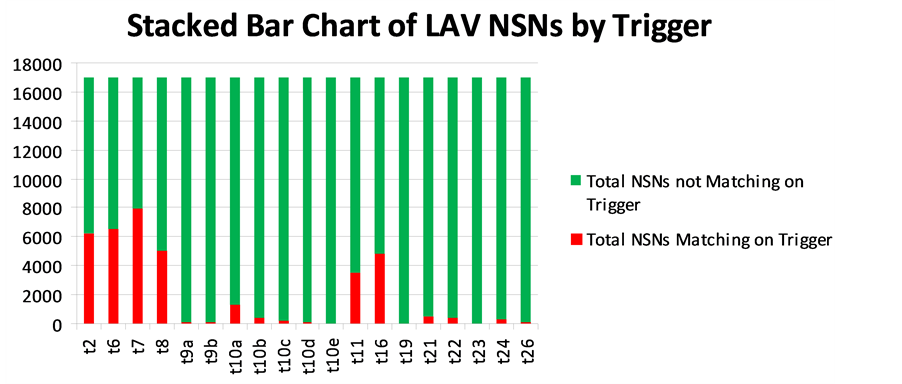
Chart 2. Stacked bar chart of light armored vehicle (LAV) National Stock Numbers (NSNs) by trigger.
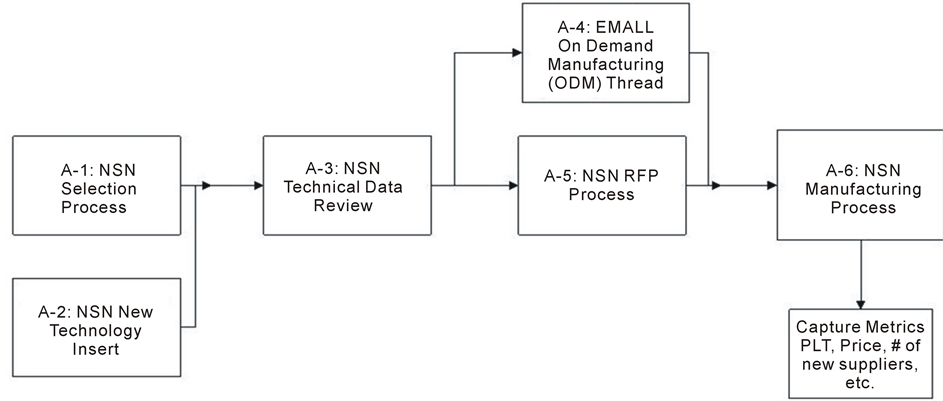
Figure 3. Overall workflow of the network-centric manufacturing enterprise procurement process. EMALL, Electronic Mall; NSN, National Stock Number; RFP = request for proposal; PLT, production lead time.
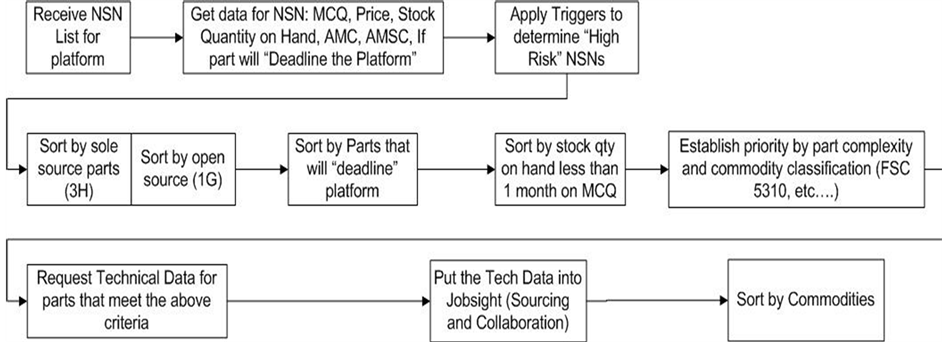
Figure 4. NSN selection process. NSN, National Stock Number; MCQ, monthly consumption quantity; AMC, acquisition method code; AMSC, acquisition method suffix code; qty, quantity; FSC, federal supply classification.
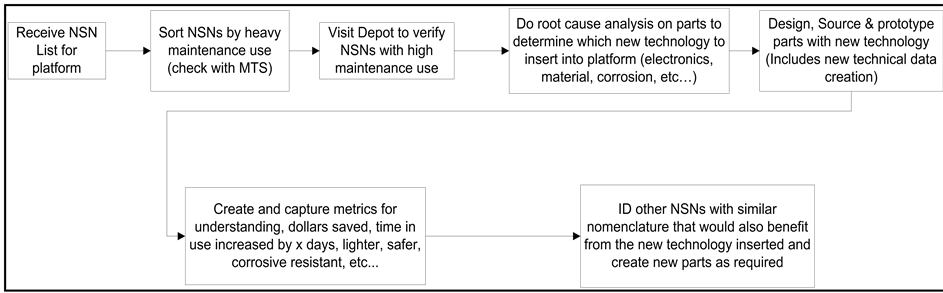
Figure 5. NSN new technology insert process. NSN, National Stock Number; MTS, member of technical staff; ID, identify.
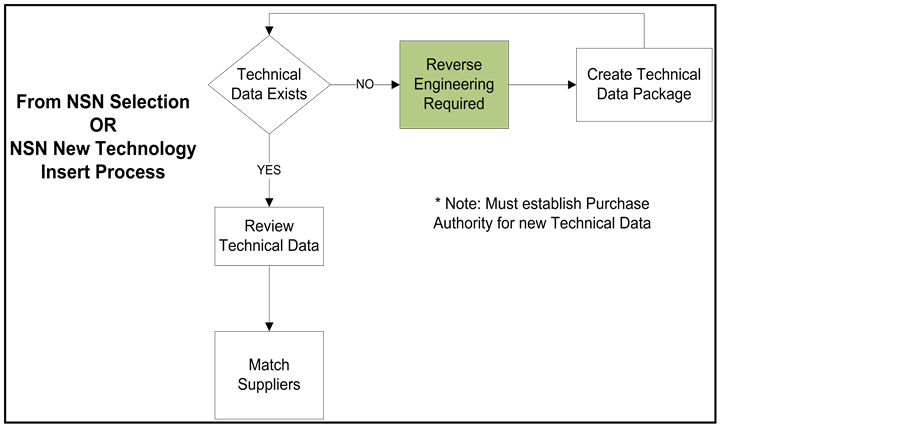
Figure 6. NSN technical review process. Must establish purchase authority for new technical data. NSN, National Stock Number.
The NSN manufacturing process is represented in Figure 9. The process involves selecting the supplier to manufacture the part, creating a schedule module, and finally commencing part manufacture.
Figure 10 shows two substitution transitions, customer-b and select-NSN. The former substitution transition models the connection of the stocking point to the customer, and the latter models the selection of an NSN to replenish the stocking point. Place stock represents the stock physically on hand; for simplicity, only two products are considered, A and B. However, the model is generic, and when the initial marking is changed, the stock may contain any set of products. This dynamic process is captured by the Petri net outlined in Figure 10.
Utilizing this procedure, project team members discussed grouping trigger outputs, resulting in the development of a set of priorities for the establishment of trigger output buckets. This set of priorities reflects the problem part workflow. The group then developed a list of five trigger probability metric performance dimension groupings:
• Engineering issues;
• Obsolescence issues;
• Demand planning issues;
• NSN-specific unique sustainment problems;
• Cataloging issues.
The above clearly shows that the flexibility of SCBORT depends on the five probability metric dimensions of lead time, cost, quality, service level, and information availability. All five are essential to supply chain performance. These dimensions must be balanced and improved depending on the industry to which the supply chain
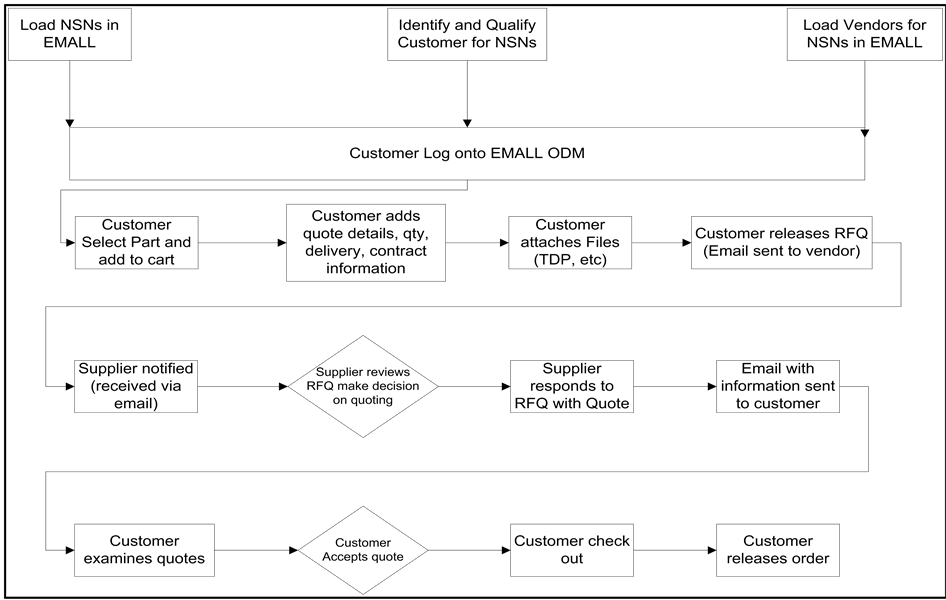
Figure 7. EMALL ODM thread process. NSN, National Stock Number; EMALL, Electronic Mall; ODM, on-demand manufacturing; qty, quantity; TDP, technical data package; RFQ, request for quote.
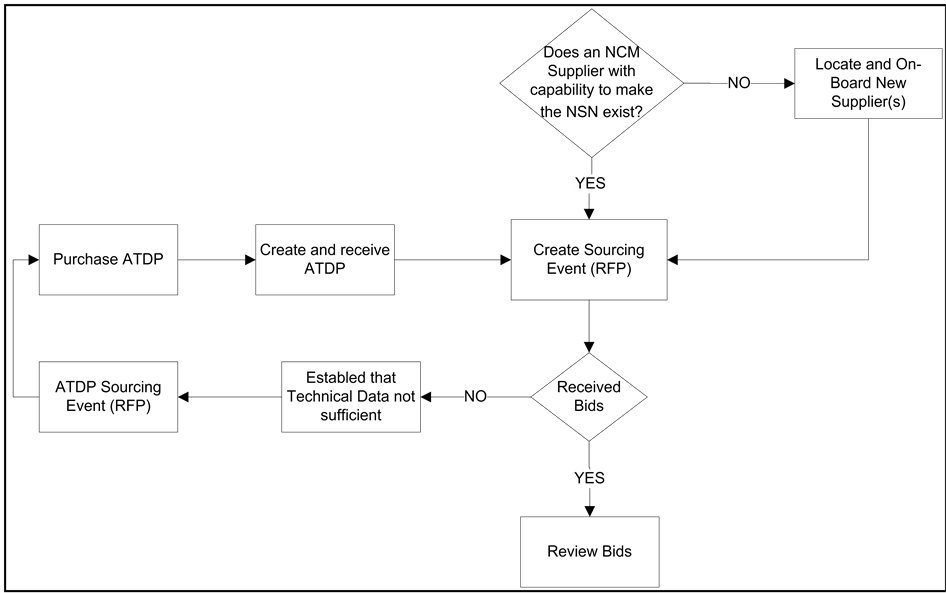
Figure 8. NSN RFP process. NCM, network-centric manufacturing; NSN, National Stock Number; ATDP, advanced technical data package; RFP, request for proposal.

Figure 9. National Stock Number manufacturing process.
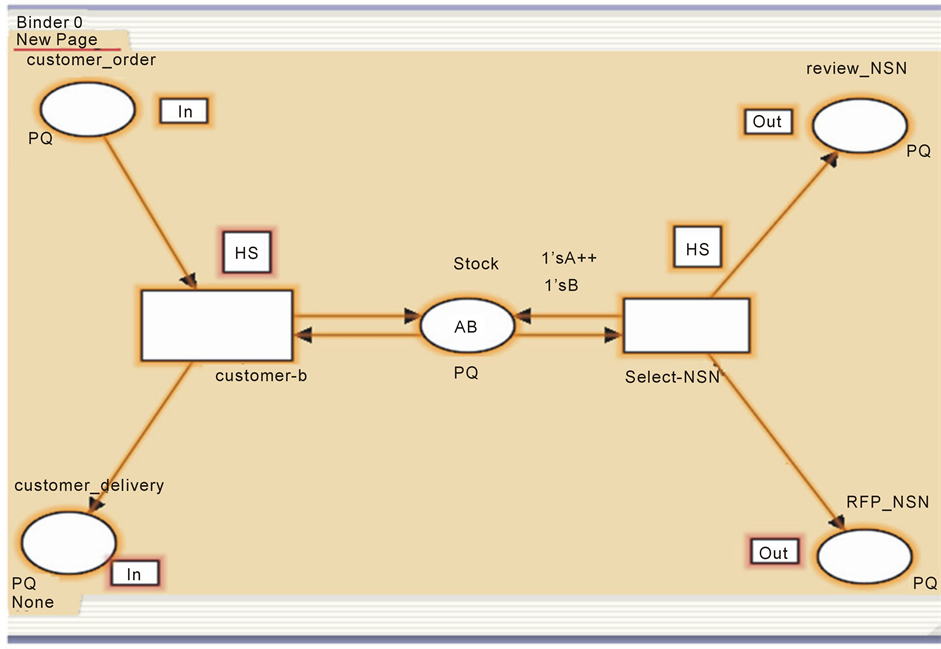
Figure 10. Petri Net solution.
belongs and the strategy that it implements. When only the collective evaluation result of SCBORT is considered, information from one dimension may submerge that of another. The present study thus proposes an evaluation scheme for evaluating the degree of SCBORT, thus enabling decision makers to judge the need to improve SCBORT and determine the dimension of SCBORT that most urgently requires improvement. Furthermore, SCBORT can be evaluated using the evaluation schematics discussed previously. The assessment scheme comprises three main stages. The first stage evaluates the degree of improvement with respect to each backorder risk trigger dimension metric. The second stage evaluates the degree of improvement with respect to SCBORT clusters. Finally, the third stage involves the use of interactive consensus analysis to make a consistent decision.
Table 2 provides more formal definitions of each of the five trigger probability metric performance dimensions. Table 3 describes the four SCBORT impact clusters.
4. An Approach for Evaluating the Degree of Probability Metrics and SCBORT Impact Clusters
This section uses the evaluation hierarchy of SCBORT details in Table 1 and Table 2 for evaluating the degree of probability metrics and SCBORT impact. The process involves three stages. The first stage evaluates the degree of improvement with respect to each backorder trigger metric. This in turn helps determine probabilities for each of the experts. The second stage assesses the degree of improvement in the SCBORT dimensions. This helps identify impact ratings for the experts. The last stage involves the use of an interactive analysis to make consistent deci

Table 2. Dimensions of supply chain backorder risk triggers (SCBORT).
Table 3 . Four metrics of supply chain backorder risk triggers (SCBORT).
sions.
5. Illustrative Example
The L-Project (a pseudonym) is an exploratory proof-of-concept research effort that has included the effective application of analytic processes and risk assessment procedures. The L-Project provides information about the process by which supply items were analyzed to establish a relative risk level for each. Results and lessons learned from this project will establish the analytical process for similar risk assessment efforts on other weapons systems.
This example reviews the triggers established for the analysis of supply items listed by NSN, the criteria to be used in determining high risk levels for supply items, and the groupings of those items following an initial assessment against the triggers. There are eight variants of the L-Project with a total of 878 vehicles. The L-Project entered the market in 1983 with an expected service life up to 2005. It has been in service for more than 25 years and is expected to be in service until at least 2025. Because of the age of the L-Project fleet, several technical and logistical risks persist.
The goal of the L-Project is to analyze data to assess future sustainment, risks, and benefits of using new technology to address logistics readiness factors that affect the extension of service life. The process creates a trigger methodology for risk identification and prioritization, problem identification, and further analysis of alternatives to mitigate risk and to recommend a path forward. The L-Project is applicable to risk analysis, sustainment, technology insertion, reengineering, and spare parts modernization to improve operational readiness and life cycle management.
6. Conclusions
Since supply chains are complex systems prone to uncertainty, mathematical analysis and artificial intelligence methods are useful tools that can be employed to capture their dynamics. Parts backorder reduction has become increasingly important in supply chain management. When it is difficult or time consuming to acquire parts, the operational availability of a system is reduced. This study describes a technique that helps planners proactively identify potential problem of spare parts to better manage spare parts acquisition in military weapon systems. The paper reports on the results of ISO 3100 workflow processes and analysis utilizing Petri Nets and Pareto Charts for group decision support evaluation of backorder risk triggers to ensure that equipment is available and fully operational when needed. Risk factors were identified, and the impact importance and probability metric performance ratings were determined via a risk mitigation strategy to identify and predict supply chain backorder risk triggers. L-Project is an illustrative example that utilizes Petri nets and Pareto charts to present the evaluation hierarchy of supply chain risk. Cluster analysis is utilized to determine that there are five triggers of engineering, obsolescence, demand, NSN unique sustainment and cataloging in light of the five SCBORT: probability performance metric dimensions of quality, cost, lead time, service level and information availability. There are also four aggregated SCBORT: impact clusters of market sensitiveness, process integration, information drivers and flexibility.
However, the method is limited in which it uses approximate reasoning, and experts must perfectly distinguish the set of terms under a similar conception. This method of risk evaluation and group decision making in the presence of multiple dimensions and related multiple metrics is very useful in understanding and developing supply chain risk events.
The importance grades or impact ratings must be improved until acceptable when evaluating the degree of SCBORT risk triggers. If the risk trigger degree is too high, it may have to be improved. The assessment scheme should be used to determine the best improvements for the SCBORT dimensions. The model described in this study to evaluate the degree of SCBORT involves a group of experts and interactive consensus analysis. Therefore, the evaluation results are more objective and unbiased than individual assessments.
A case study of SCBORT evaluation was conducted to examine the feasibility of the proposed method. The L-Project risk mitigation process is a rigorous and accepted methodology. The ISO 31000 process management approach was used in conjunction with this process to improve on this methodology and to provide further insight and simplicity for decision makers. In addition, Petri nets and workflow processes were documented following ISO 31000 “Risk Management: Principles and Guidelines on Implementation” [30] [31] . According to ISO 31000, the context of the risk must first be established, and then the following risk management steps must be undertaken: identification of risk in a selected domain of interest, planning of the remainder of the process, and mapping out of the social scope of risk management. This process takes into consideration the identification of stakeholders and their objectives and the identification and evaluation of risk constraints within the context of this stakeholder analysis. This is followed by defining a framework for the activity and an agenda for identification, and developing an analysis of risks involved in the process and mitigation of risks using available technological, human, and organizational resources.
The project team in the illustrative example identified triggers as risk events that needed to be mitigated. Once the high-risk items were identified, they were sorted by established criteria. Next constraints were mapped out and combinations of triggers were evaluated. After establishing the context, the next step in the process of managing risk was to identify potential risks. Risks are events that, when triggered, cause problems [32] . Hence, risk identification can start with the source of problems or with the problem itself.
Sources of risk may be internal or external to the system that is the target of risk management. Examples of sources of risk are project stakeholders, employees of a company, or the weather over an airport. Risks are also related to identified threats. Examples include the threat of losing money or the threat of backorders, accidents, or casualties if the proper part is not available in a timely manner. Threats may exist with various entities, such as shareholders, suppliers, customers, and the government. When either the source or problem is known, the events that a source may trigger or the events that can lead to a problem can be investigated. The method of identifying risks chosen by the L-Project team was dependent on culture, industry practice, and compliance. Templates were developed to identify the source, problem, or event. Common risk identification methods were used.
References
- Defense Logistics Agency Website (2013) http://www.dla.mil/dla_pubsite/about_dla.aspx
- Gerald, B., King, N. and Natchek. D. (2001) Oracle E-Business Suite Manufacturing and Supply Chain Management. McGraw-Hill/Osborne, Berkeley.
- Shapiro, J.F. (2000) Modeling the Supply Chain. Duxbury Press, Pacific Grove.
- Ross, D.F. (2004) Distribution Planning and Control: Managing in the Era of Supply Chain Management. 2nd Edition, Springer, New York. http://dx.doi.org/10.1007/978-1-4419-8939-0
- Petrovic, D., Roy, R. and Petrovic, R. (1998) Modeling and Simulation of a Supply Chain in an Uncertain Environment. European Journal of Operational Research, 109, 299-309. http://dx.doi.org/10.1016/S0377-2217(98)00058-7
- Swaminathan, J.M., Smith, S.F. and Sadeh, N.M. (1998) Modeling Supply Chain Dynamics: A Multiagent Approach. Decision Sciences, 29, 607-632. http://dx.doi.org/10.1111/j.1540-5915.1998.tb01356.x
- Apaiah, R.K. and Hendrix, E.M.T. (2005) Design of a Supply Chain Network for Pea-Based Novel Protein Foods. Journal of Food Engineering, 70, 383-391. http://dx.doi.org/10.1016/j.jfoodeng.2004.02.043
- Hung, W.Y., Samsatli, N.J. and Shah, N. (2006) Object-Oriented Dynamic Supply Chain Modeling Incorporated with Production Scheduling. European Journal of Operation Research, 169, 1064-1076. http://dx.doi.org/10.1016/j.ejor.2005.02.009
- Sherbrooke, C.C. (2004) Optimal Inventory Modeling of Systems: Multi-Echelon Techniques. 2nd Edition, Springer, New York.
- Chopra, S. and Meindl, P. (2000) Supply Chain Management: Strategy, Planning and Operations. Prentice Hall, Upper Saddle River.
- Kumar, K. (2001) Technology for Supporting Supply Chain Management: Introduction. Communications of the ACM, 44, 58-61. http://dx.doi.org/10.1145/376134.376165
- Gunasekaran, A. and Ngai, E.W.T (2009) Modeling and Analysis of Build-to-Order Supply Chains. European Journal of Operational Research, 195, 319-334. http://dx.doi.org/10.1016/j.ejor.2008.03.026
- Shin, K.S., Shin, Y.W., Kwon, J.H. and Kang, S.H. (2011) Development of Risk Based Dynamic Backorder Replenishment Planning Framework Using Bayesian Belief Network. Computers & Industrial Engineering, 62, 716-725. http://dx.doi.org/10.1016/j.cie.2011.11.015
- Blackhursta, J., Wub, T. and Craighead, C.W. (2008) A Systematic Approach for Supply Chain Conflict Detection with a Hierarchical Petri Net Extension. Omega, 36, 680-696. http://dx.doi.org/10.1016/j.omega.2006.02.001
- Brijesh, P. and Chandrasekharan, R. (2011) Rationing Mechanisms and Inventory Control-Policy Parameters for a Divergent Supply Chain Operating with Lost Sales and Costs of Review. Computers & Operations Research, 38, 1117-1130. http://dx.doi.org/10.1016/j.cor.2010.11.002
- Huang, S., Axsäter, S., Dou, Y.F. and Chen, J. (2011) A Real-Time Decision Rule for an Inventory System with Committed Service Time and Emergency Orders. European Journal of Operational Research, 215, 70-79. http://dx.doi.org/10.1016/j.ejor.2011.05.029
- Liu, R., Kumar, A. and van der Aalst, W. (2007) A Formal Modeling Approach for Supply Chain Event Management. Decision Support Systems, 43, 761-778. http://dx.doi.org/10.1016/j.dss.2006.12.009
- Chan, H.K. and Chan, F.T.S. (2010) Comparative Study of Adaptability and Flexibility in Distributed Manufacturing Supply Chains. Decision Support Systems, 48, 331-341. http://dx.doi.org/10.1016/j.dss.2009.09.001
- Olsson, F. and Tydesjo, P. (2010) Inventory Problems with Perishable Items: Fixed Lifetimes and Backlogging. European Journal of Operational Research, 202, 131-137. http://dx.doi.org/10.1016/j.ejor.2009.05.010
- Tüysüz, F. and Kahraman, C. (2010) Modeling a Flexible Manufacturing Cell Using Stochastic Petri Nets with Fuzzy Parameters. Expert Systems with Applications, 37, 3910-3920. http://dx.doi.org/10.1016/j.eswa.2009.11.026
- Toktas-Palut, P. and Ulengin, F. (2011) Coordination in a Two-Stage Capacitated Supply Chain with Multiple Suppliers. European Journal of Operational Research, 212, 43-53. http://dx.doi.org/10.1016/j.ejor.2011.01.018
- Bayındıra, Z.P., Dekker, R. and Porras, E. (2006) Determination of Recovery Effort for a Probabilistic Recovery System under Various Inventory Control Policies. Omega, 34, 571-584. http://dx.doi.org/10.1016/j.omega.2005.01.015
- Mahadevan, B., Pyke, D.F. and Fleischmann, M. (2003) Periodic Review, Push Inventory Policies for Remanufacturing. European Journal of Operational Research, 151, 536-551. http://dx.doi.org/10.1016/S0377-2217(02)00627-6
- Yeh, K.C., Chen, R.S. and Chen, C.C. (2011) Intelligent Service-Integrated Platform Based on the RFID Technology, and Software Agent System. Expert Systems with Applications, 38, 3058-3068. http://dx.doi.org/10.1016/j.eswa.2010.08.096
- Agarwal, A., Shankar, R. and Tiwari, M.K. (2006) Modeling the Metrics of Lean, Agile and Leagile Supply Chain: An ANP-Based Approach. European Journal of Operational Research, 173, 211-225. http://dx.doi.org/10.1016/j.ejor.2004.12.005
- Hall, D.L. (1992) Mathematical Techniques in Multisensor Data Fusion. Artech House, Norwood.
- Skinner, H.A. (1979) Dimensions and Clusters: A Hybrid Approach to Classification. Applied Psychological Measurement, 3, 327-341. http://dx.doi.org/10.1177/014662167900300305
- Zhou, L.G., Chen, H.Y. and Liu, J.P. (2011) Generalized Weighted Exponential Proportional Aggregation Operators and Their Applications to Group Decision Making. Applied Mathematical Modelling, 36, 4365-4384. http://dx.doi.org/10.1016/j.apm.2011.11.063
- http://en.wikipedia.org/wiki/Petri_net
- http://www.iso.org/iso/iso_catalogue/catalogue_tc/catalogue_detail.htm?csnumber=43170
- ISO (2009) ISO/DIS 31000 Risk Management: Principles and Guidelines on Implementation. International Organization for Standardization, New York.
- Luckham, D. (2002) The Power of Events. Addison-Wesley, Boston.