Positioning
Vol.4 No.2(2013), Article ID:31530,5 pages DOI:10.4236/pos.2013.42021
The Correction of Commercial IMU Data for Single Image Registration
![]()
1Department of Civil Engineering, Universiti Teknologi Malaysia, Kuala Lumpur, Malaysia; 2Department of Engineering & Applied Science, Aston University, Birmingham, UK.
Email: shuibrambat@utm.my
Copyright © 2013 Shuib Rambat et al. This is an open access article distributed under the Creative Commons Attribution License, which permits unrestricted use, distribution, and reproduction in any medium, provided the original work is properly cited.
Received March 1st, 2013; revised April 2nd, 2013; accepted April 16th, 2013
Keywords: Commercial IMU; Epoch Analysis; Image Rectification
ABSTRACT
This study aims to enhance the accuracy of the commercial Inertial Measurement Unit (IMU) developed using the advanced Micro-Electro-Mechanical System (MEMS) by using the epoch analysis technique. The epoch analysis approach has been established to quantify the observation data from static measurement stations. A statistical approach is used to: 1) eliminate gross errors; 2) determine the appropriate data (filter); 3) estimate future values; and 4) for data evaluation. The main attribute of epoch analysis is its treatment of redundancy in the observed data by taking into account the frequencies that are found within it. In a dynamic application, epoch analysis is used by examining the instantaneous position. In this paper, the competency of epoch analysis in reducing the commercial IMU data for geometrical image correction is presented.
1. Introduction
The off-the-shelf commercial IMU has been popularly embedded in autonomous projects involving robotics, Unmanned Aerial Vehicles (UAV) and the determination of body movements [1]. This device is preferable because it is fast, essentially driftfree and the dynamic errors due to force and angular rate are reduced to small values [2]. Secondly, this device is far cheaper than a tactical grade IMU and its small size enables it to be attached to the imaging device whilst minimising the operation cost. Using advanced MEMS (Mechanical Electrical Manufacturing System) technology, the portable sensor device has been preferred to allocate position not only in navigating a vehicle but also in positioning an image into its orientation. [3-5] have demonstrated the competency of the positioning device for the use of image orientation in various test fields and achieved significant accuracy. Devices that are being used alone or in combination for positioning an image into its orientation are the handheld global navigation satellite systems (GNSS), Inertial Measurement Units, altimeters, laser scanners and compasses.
The positioning accuracy obtained from these devices may differ, depending on the brand, capability and location factors. Normally, low-cost positioning devices confer low accuracy while the expensive devices promise better accuracy. In order to enhance the accuracy of the image orientation for the different devices used to measure the manoeuvre and the position, various processing techniques have been introduced such as Kalman Filtering [6], Neural Networks [7] and Rigorous Modelling [8]. Some of the processing techniques work only with high-accuracy devices and are rarely applied to low-cost navigation devices [9] whilst others perform adequately only under certain predefined dynamic models [10]. The main problem of the low-accuracy positioning device is the fluctuation of the data obtained which can be uncontrollable. For instance, the commercial IMU data values can fluctuate from negative to positive in seconds whilst lower-cost GPS units may be unable to receive consistent signals during dynamic applications.
In this paper, an epoch analysis technique is used to enhance the accuracy of the commercial IMU positioning devices to yield a good image orientation. The epoch analysis approach is commonly used to quantify the observation data from the static measurement station. The quantifying process used a statistical approached to 1) eliminate gross errors; 2) determine the appropriate data (filter); 3) estimate future values; and 4) for data evaluation. At the end of this process, the “True” or most possible value to be assumed as accurate for that particular static station can be determined.
2. Material
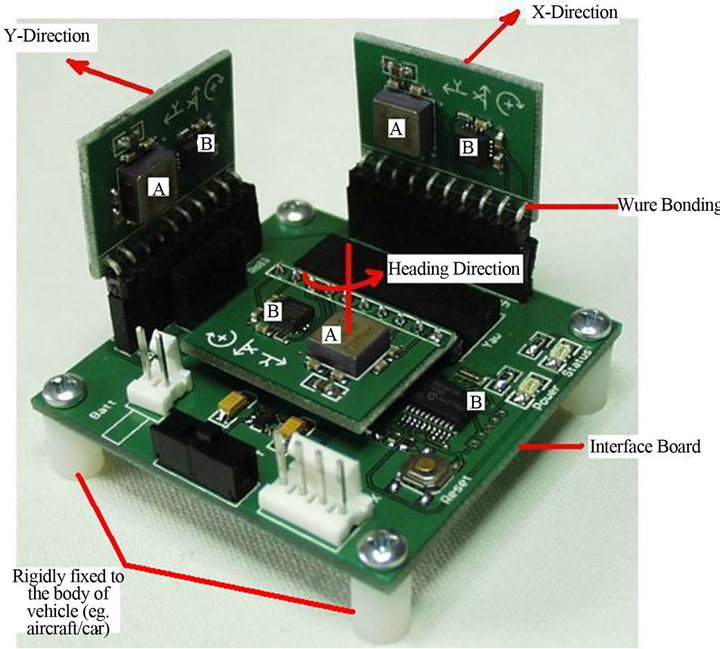
This study has been carried out with the use of a commercial IMU, which is an adequate device embedded with a digital camera in order to determine its position. Specifically, the eGyro-XP (PCFlightsystems) IMU for aviation practice has been selected to be embedded on the digital camera during the image acquisition. The IMU contains three solid-state electronic gyroscope equivalents, three solid-state accelerometers and a micro-controller. The “gyroscopes” sense the rate of rotation of the moving body of the digital camera around the roll, pitch and yaw axes. The accelerometers also sense the acceleration along these axes together with the orientation relative to the earth. The micro-controller converts the gyroscope and accelerometer outputs into digital signals. Figure 1(a) shows the commercial IMU components and Figure 1(b) shows the commercial IMU attached to the imaging device.
However, commercial IMUs such as the eGyro-XP device usually come with some limitations that the user cannot simply fix or repair. For instance, the IMU presented its data in ARINC 075 format with a considerable amount of processing already carried out. This made further processing difficult, other than employing digital techniques to smooth and filter the data to remove noise and bias. In some cases, mixed-mode data occurred during the data acquisition. In this study, an epoch analysis has been used to reduce the IMU data.
3. Methodology
An epoch signifies a significant time as delimiting factor for the IMU measurements. Although each second is deemed to be one epoch, each epoch contains more than one data measurement. These data are used to calculate the mean and the standard deviation. The mean and standard deviation in each epoch are analysed to eliminate the errors and determine the scale factor (in IMU). The epoch analysis for GPS data is quite straight forward. Conversely, the IMU data may contain mixed data whereby data inconsistency occurs in the epoch which can be detected through the standard deviation value. In this case, a dynamic epoch analysis has to be employed. Dynamic epoch analysis is a technique to aggregate the data sample in the current epoch. The aggregation then has to be valued by comparing the means. Table 1 shows an example of a mixed data problem.
Filtering is the most suitable tool for isolating an error from the data stream. In filtering, a cut-off value is set and any data beyond this cut-off value will be isolated
 (a)
(a)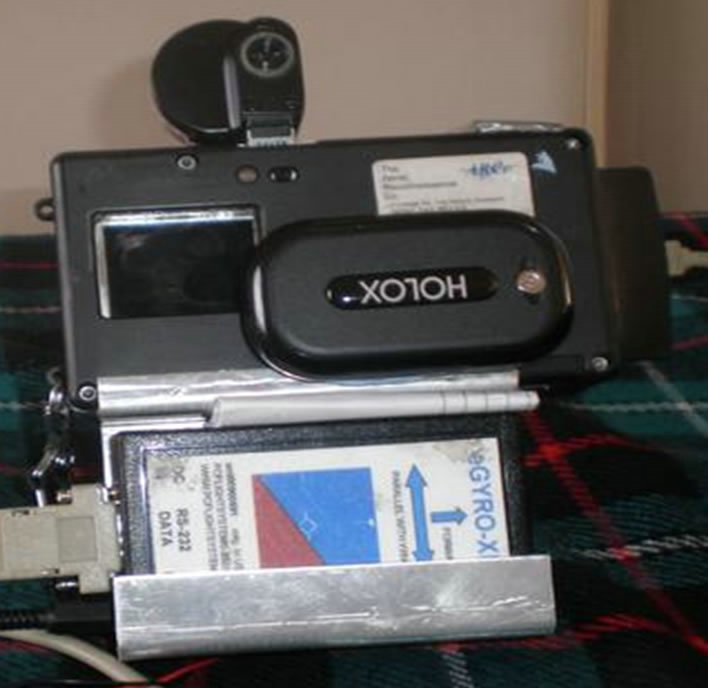 (b)
(b)
Figure 1. IMU data acquisition problem.

Table 1. IMU data acquisition problem.
from the data stream. For instance, in mean filtering, the mean value plus a selected interval is used as a cut-off value so that any observation data outside this range will be eliminated and replaced with a new value.
[11] has set the cut-off value as the mean +σ, hereby IMU data 10% higher than this cut-off value was given a new value (the mean value). [12] used the bandwidth as the cut-off value, whereby the bandwidth is the difference between the high frequencies and the low frequentcies, and any signal exceeding this value was given a new value. Moreover, the filter can be designed to suit the IMU device, for instance [13] designed a federated filter to minimise error in the Honeywell IMU device.
In this study, the main constraint of the IMU data was the fluctuation of the IMU signals, which resulted in a “yo-yo” pattern in one-second data. To overcome this problem, the IMU data have been segmented into groups. Ideally, each of the groups should contain values which are within ±2% of the original data. For example, if the data is 100 then the group would not contain any value which exceeds the maximum value of 102 or falls below a minimum value of 98. However, if a data value did not fall within the bounds set for a group then it would be considered as missing data and an interpolation procedure applied to determine an appropriate value for it. Figure 2 shows the flowchart of the working procedure to minimise the biases in the IMU data. Figure 3 illustrates the implementation of the minimising procedure using a spreadsheet.
An interval of ±2% was used to ensure that each of the
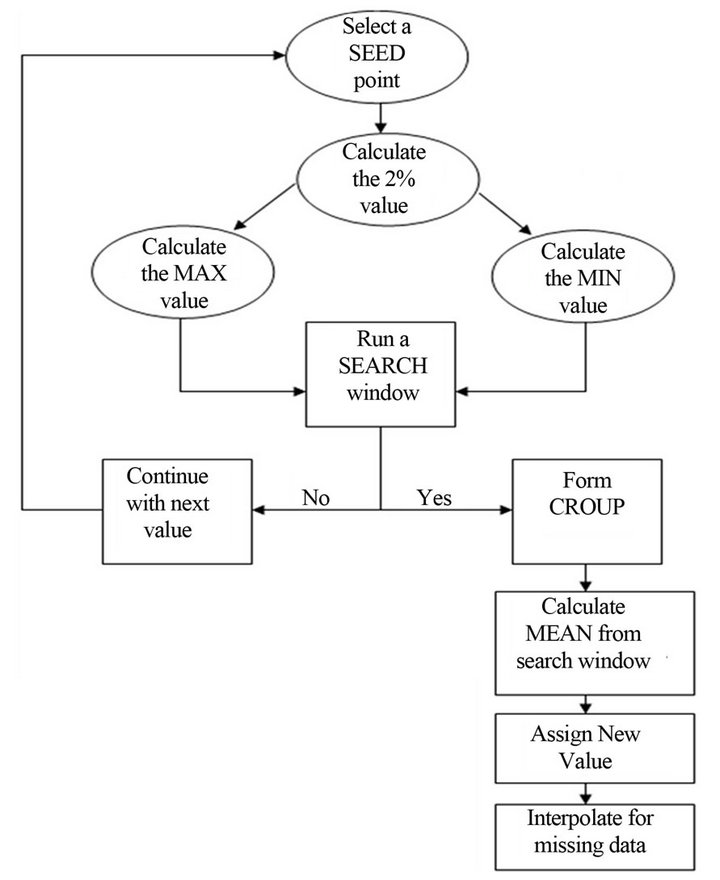
Figure 2. Flowchart of the filter working procedure.

Figure 3. Spreadsheet showing the process of filtering.
groups contains a low dispersion, which means that the IMU data has been tightly clustered and high dispersion means that the IMU data is widely scattered. The dispersion can be expressed as:
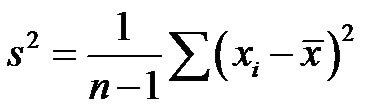 (1)
(1)
where;
 sample variance;
n = sample size;
xi = current IMU data;
 mean of IMU data;
The rectification process for a single image is done by reconstructing the image geometry via intrinsic and extrinsic parameters. Later, a mathematical equation can be generated based on the collinearity condition. To relate the acquired image with the collinearity condition, it is assumed that one end of the image coincides with the orthoplane. From the reconstruction graphic shown in Figure 4, the exposure station (L), which is at a distance OL from the image centre, can be determined. The position P in the image can be traced by projecting the line of nP to the horizontal-plane (P') using the collinearity conditions. Based on the collinearity condition, the image of P should be somewhere on line LP'. To compute the coordinates of P in the ortho-plane (P"), a trigonometric triangulation has to be established. According to this condition a mathematical equation described below can be used to rectify the single image.
From the above diagram, let P" be the position P in the ortho-plane, then:
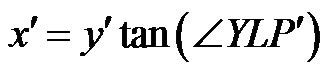 (2)
(2)
 (3)
(3)
It is also known that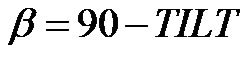 , therefore nO is
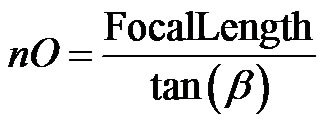 (4)
(4)
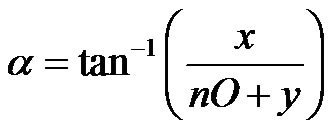 (5)
(5)
Equations (2)-(7) have been used to compute the new
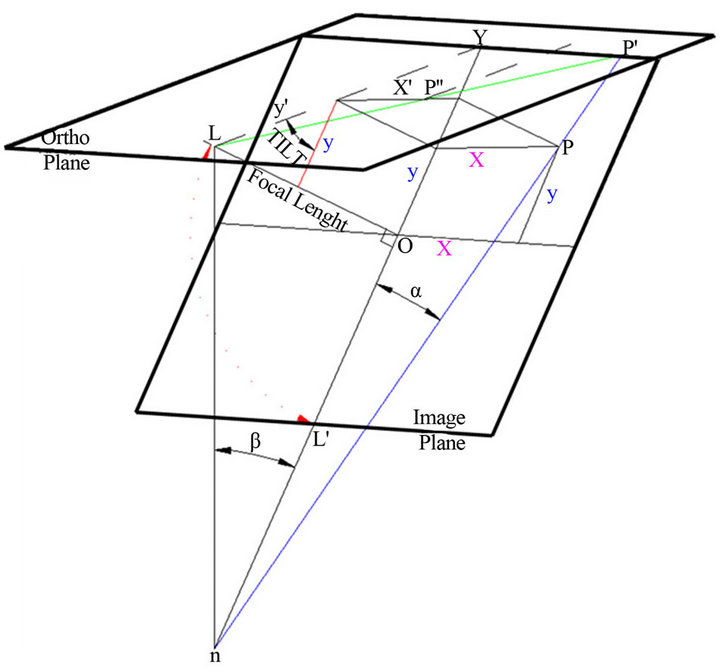
Figure 4. Establishment of trigonometric triangulation.
 (6)
(6)
 (7)
(7)
 (8)
(8)
position of all pixels in the image on the horizontalplane. Please note that all computations are done in pixel units. The conversion between metric and pixel units is based on pixels per cm, determined by counting the number of dots scanned in one inch. For example, if an image has been scanned with 28 pixels per cm, then a 1024 × 1024 pixels resolution image can be transformed to 36 × 36 cm. If the image scale is 1:1000, then 1 inch (in photo) = 1000 inches (on ground) and the image covered an area of 36000 × 36000 cm square. Later, each pixel in an image can be mapped into the user coordinate system.
4. Result and Discussion
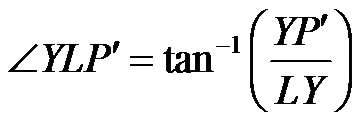
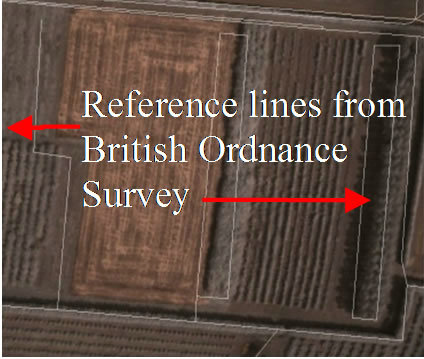
The epoch analysis approach has been compared with alternative methods for smoothing dynamic data, such as the moving average and the polynomial methods as in Figure 5. It is found that the polynomial technique tries to average the IMU data in order to create a smooth curve. The moving average has created a wide-gap between the original data and the adjusted data, while in the ±2% method the “yo-yo” has been removed and replaced by new values because it does not belong to any of the nearest members in that particular epoch. The collinearity condition shows good results in rectifying the single image compared to a simple rotation matrix. Figure 6 illustrates the results of single image rectification using both techniques. Meanwhile, Figure 7 depicts the results from the field test conducted in Kent, UK.
5. Conclusions
The study has shown the capability of the epoch analysis technique in reducing the commercial IMU data for single image rectification purposes. The epoch analysis approach has been proved to be significant technique for determining the orientation angles for the single image rectification whilst the use of the 2% filtering technique on the commercial IMU data improved rectification product and readily showed the correct camera position at the moment the image was captured. However, a drawback to this technique is that it is only applicable to small and flat areas.
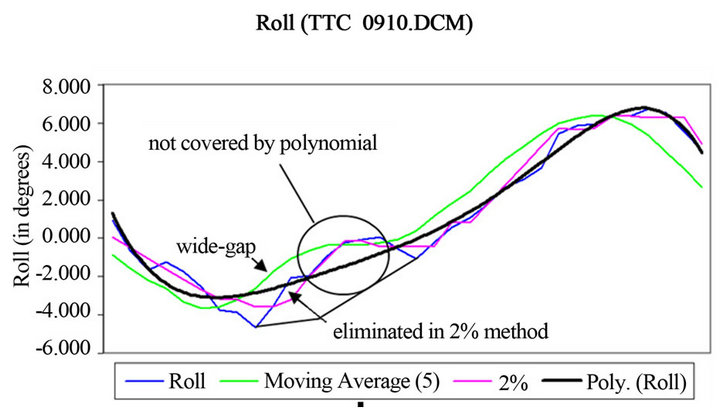
Figure 5. Difference between filtering methods.
 (a)
(a) (b)
(b)
Figure 6. (a) Projected image using simple rotation matrix; (b) Projected image using collinearity condition.
 (a)
(a)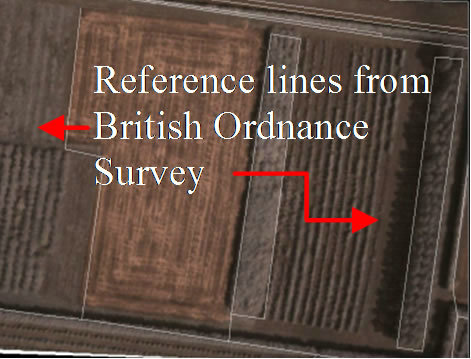 (b)
(b)
Figure 7. (a) Uncorrected image; (b) Corrected image.
6. Acknowledgements
We thank the following for financial support or assistance enabling this research: Research Grant for Real Estate Research and Development Grant Scheme (NAPREC) with a UTM Vot No: 4B086, Institut Penilaian Negara (INSPEN), Ministry of Higher Education and the Government of Malaysia.
REFERENCES
- L. Robin and M. Perlmutter, “IMU & High Performance Inertial MEMS 2011: Complete Review of Inertial Sensors Market 2009-2015,” 2010. http://www.imicronews.com/upload/Rapports/Yole_IMU&High_Performance_Inertial_MEMS_Report_sample.pdf
- S. J. Merhav, “A Nongyroscopic Inertial Measurement Unit,” Journal of Guidance, Control and Dynamics, Vol. 5, No. 3, 1982, pp. 227-235. doi:10.2514/3.19768
- M. Cramer, “Performance of GPS/Inertial Solution in Photogrammetery,” In: D. Fritsh and R. Spiller, Eds., Photogrammetry Week’01, Wichmann Verlag, Heidelberg, 2001, pp. 49-62.
- C. K. Toth, “Sensor Integration in Airborne Mapping,” IEEE Transactions on Instrumentation and Measurement, Vol. 51, No. 6, 2002, pp. 1367-1373. doi:10.1109/TIM.2002.808027
- K. P. Schwarz, M. A. Chapman, M. E. Cannon and P. Gong, “An Integrated INS/GPS Approach to the Georeferencing of Remotely Sensed Data,” PE&RS, Vol. 59, No. 11, 1993, pp. 1667-1674.
- M. Ding and Q. Wang, “An Integrated Navigation System of NGIMU/ GPS Using a Fuzzy Logic Adaptive Kalman Filter,” Fuzzy Systems and Knowledge Discovery, Vol. 3613, 2005, pp. 812-821.
- N. El-Sheimy, K. W. Chiang and A. Noureldin, “The Utilization of Artificial Neural Networks for Multisensor System Integration in Navigation and Positioning Instruments,” IEEE Transactions on Instrumentation and Measurement, Vol. 55, No. 5, 2006, pp. 16606-1615. doi:10.1109/TIM.2006.881033
- M. Schmitz, G. Wübbena, A. Bagge and E. Kruck, “Benefit of Rigorous Modelling of GPS in Combined AT/ GPS/IMU-Bundle Block Adjustment,” OEEPE Workshop, Hannover, 17-18 September 2001.
- C. Hide and T. Moore, “GPS and Low Cost INS Integration for Positioning in the Urban Environment,” Proceedings of ION GNSS, Long Beach, 13-16 September 2005. http://www.grcnz.com
- K.-W. Chiang, A. Noureldin and N. El-Sheimy, “Multisensor Integration Using Neuron Computing for LandVehicle Navigation,” Journal of GPS Solution, Vol. 6, No. 4, 2003, pp. 209-218.
- J. Skaloud, “Optimizing Georeferencing of Airborne Survey Systems by INS/DGPS,” Ph.D. Thesis, UCGE Report 20216, University of Calgary, Calgary, 1999. http://www.geomatics.ucalgary.ca/research/publications/ GradTheses.html
- J. Q. Zhou, “Simplified Analysis of IMU Sensor Corruptions on Existing Pendulation Control System for ShipMounted Crane,” M.S. Thesis, Virginia Polytechnic Institute and State University, Blacksburg, 2006. http://homepage.mac.com/hanspeterschaub/work/masters. html
- N. El-Sheimy, S. Nassar and A. Noureldin, “Wavelet DeNoising for IMU Alignment,” IEEE Aerospace and Electronic Systems, Vol. 19, No. 10, 2004, pp. 32-39. doi:10.1109/MAES.2004.1365016