Journal of Geographic Information System
Vol.06 No.05(2014), Article ID:50656,14 pages
10.4236/jgis.2014.65044
Mashing up Geographic Information for Emergency Response—An Earthquake Prototype
Shawn Dias, Chaowei Yang, Anthony Stefanidis, Mathew Rice
Department of Geography and GeoInformation Science, George Mason University, Fairfax, VA, USA
Email: sdias@gmu.edu, cyang3@gmu.edu, astefani@gmu.edu, rice@gmu.edu
Copyright © 2014 by authors and Scientific Research Publishing Inc.
This work is licensed under the Creative Commons Attribution International License (CC BY).
http://creativecommons.org/licenses/by/4.0/


Received 14 August 2014; revised 10 September 2014; accepted 5 October 2014
ABSTRACT
Important information pertaining to emergencies and responses to the emergencies is often distributed across numerous Internet sites. In the event of a disaster like an earthquake, rapid access to such information is critical. At such moments the general public usually has a hard time navigating through numerous sites to retrieve and integrate information, and this may severely affect our capability to make critical decisions in a timely manner. Common earthquake mashups often lack relevant information like locations of first responders and routing to important facilities (e.g. hospitals and fire stations) which could save important time and lives. To address the challenges, we developed an Earthquake Information Mashup prototype. This prototype demonstrates a mashup approach to providing a Web visualization of real-time earthquake monitoring and complementary information, such as traffic conditions, the location of important facilities and routing to them. It also offers users the ability to communicate local condition. Users are thus able to better integrate information from various near real-time sources, obtain better situational awareness, and make smarter informed critical decisions.
Keywords:
CyberGIS, Natural Hazards, Social Media, Performance, CloudGIS

1. Introduction
Natural disasters like earthquakes often strike unexpectedly and leave the public incapable of dealing with the situation. Most earthquake studies [1] [2] have shown that people often panic in the direct aftermath of the event. It is during this time that quick and informed decisions need to be made. At that time information fragments become available across multiple Internet sites [3] . For the public, coming to grips with the situation and making an effort to compose all this information are equivalent to putting together an extremely complex jigsaw puzzle with pieces scattered all over a room, and some of them even missing. Issues like format variation, differences in projections, outdated content and lack of synchronization present often insurmountable challenges for the general public.
On August 2011, an earthquake struck Northern Virginia with a magnitude of 5.8 and an epicenter five miles southwest of Mineral Springs and left its footprints all across the east coast. Given the rarity of earthquakes in the US east coast, this one generates high levels of anxiety, and the general public rushed to the Internet for information. While most were downloading information, many also contributed by posting event-related narrative to a variety of platforms. Most notable, twitter was used heavily by social media users who acted as hybrid seismographs to report the event [4] [5] . This represents an alternate type of volunteered content, also referred to as ambient geographical information (AGI) [6] , which complements and expands volunteered geographical information (VGI). This crowd-contributed content has been proven very valuable during natural disasters such as the Haitian Earthquake [7] , the Red River Floods [8] and the Santa Barbara Wild Fires [9] .
When faced with disasters like earthquakes which affect large geographical areas, real time sensors can be incorporated in a GIS environment to raise situation awareness. With the evolution of Web 2.0 there has been an increase in the number of sensors connected to the Web providing real time data that feed the Internet with vast volumes of information. Government agencies like USGS and NOAA map disasters and distribute real time wildfire and earthquake data to the general public [10] . For emergency management, GIS technologies can be used in mitigation, preparedness, response and recovery [11] .
Earthquakes occur due to the sudden release of energy in the earth’s crust. They are evidence of tectonic activity and occur when tectonic stress is released by movement of rocks along a fault [12] . Observers and scientists gather information about earthquakes such as intensity levels by noting the damage and residents experiences during the earthquake. People’s Web postings have also been used to assess the earthquake impact [13] . A GIS is particularly appropriate for emergency response as it communicates a better view of the event impact, and the distribution of the resources that are available to respond to the post-event conditions. It allows end-users to select data necessary to analyze, to identify spatial patterns, to solve resource allocation problems, and to make good spatial decisions [14] . For example after a 7.0 magnitude earthquake, GIS was used to answer questions like where to search for victims and where rescue teams should be assigned [15] .
In order to integrate distributed Web content we make use of WebGIS solutions that employ languages such as JavaEE (Java Enterprise Edition), Servlet, JSP technologies for developing applications, and operate on a Web server such as a Tomcat server. Data between the client and server can be exchanged using different formats, popular ones include XML (Extensible Markup Language) and JSON (JavaScript Object Notation). Web services which allow other programs to call are usually responded in XML or JSON format which allows programs to parse. Two popular Web services include SOAP and REST: 1) SOAP (Simple Object Access Protocol) uses a structured or encapsulated XML for exchanging information. It is difficult to construct and parse hence HTTP is preferred; 2) REST (Representational State Transfer) was introduced and can be implemented based on HTTP where the client sends all parameters in the request URL. Clients usually consume Web services like geo browsers such as Google Maps, Bing Maps to build customized application [16] .
With the evolution of Web 2.0 there has been an increase in the number of sensors connected to the Web providing real time data sets. WebGIS offers functionalities like visualization of large amounts of GIS data, and analysis of this is possible [17] . A WebGIS tool could be used to visualize and analyze complex variables and models such as climate data [18] [19] . Web based mapping projects such as Wikimapia and Open Street Map allow users to collect geospatial Information [20] . WebGIS also provides a platform for distributing geospatial information, Websites such as ArcGIS.com allow users to download data and use its Web services. The availability of information through WebGIS and open data format enables us to integrate multiple data sources to provide comprehensive spatial decision support information through mashups. A mashup in Web applications refers to a practical approach that brings together existing elements to create refined functionalities in a seamless interoperable fashion [21] . Just as a music DJ mixes more than one song similarly users can mix data from more than one Website [22] [23] .
Mashups can be done at either server side or browser side: [21] Server-side mashups were used in all mashups prior to 2005. They have powerful software and hardware, and involve complex server side programming. They are also labor intensive due to the time required for development and deployment. Browser-side mashups function through processing on the client computer. They use relevant Web services and technologies such as JavaScript, AJAX and XML. Some sites provide data via JavaScript, which is used by the browser side mashups. Other mapping companies provide maps and services via a JavaScript API. These APIs are easy to use and do not involve complex programming. Browsers can make use of Web services in the form of RESTful and SOAP services.
Making use of the vast amount of unstructured content on the Internet can be difficult [17] . Content sent to mashups may be of two types: with or without an API. Mashups which make use of API, REST and SOAP services are relatively simple to construct and are often created by amateurs [17] [23] . The ease with which they can be created has prompted the development of a large variety of mashups from simple mashups involving simple dynamic data to large mashups using big data. There has been a lot of interest in crisis mashups as it is often used to describe neogeographic practices [24] . During crises, timely decisions are essential. An automated visualization system can provide enhanced situational awareness to decision makers after or during a disaster and could help them make better spatial decisions [25] [26] . Visualizing this combined information from a mashup not only enables decision makers to see things they never could see before, but also helps them make quick intelligent decisions. Therefore, we investigated how a mashup could be used to integrate spatial information for earthquake emergency response.
2. Related Work
2.1. Rich Internet Application
Since the 1990s, Web interfaces have been developed with features such as multimedia and animation, improving user satisfaction and resulting in a user experience similar to desktop application [27] . Ajax applications make use of asynchronous communication behind the scenes to provide smooth interactions while the graphical user interfaces are being used. Browser side APIs make the Web application fast, fun and easy to use. Rich Internet Application technologies can be used to help users obtain required geospatial resources easily [28] . They allow users to choose different options, all in one page. Tasks are accomplished on demand thus eliminating the need for going through multiple steps and reloading of pages. Rich Internet technologies are also beneficial to developers as they are easy to build thus reducing developing time and costs.
2.2. Mashup
Each mashup is unique in its own way, however, most current earthquake mashups focus on communicating the location, magnitude and time of the earthquake. There are many mashups present with relevant functionalities like
· The AEGIS, Advanced Emergency GIS, monitors and maps the location and status of emergencies, locates victims and emergency-response personnel, and tracks other factors that can impact emergency response [21] .
· The USGS [29] has the Earthquake Hazard Program to reduce earthquake losses in the US [30] . The USGS mashup offers viewing and monitoring of earthquakes that have occurred in the past 24 hours and are greater than 2.5 in magnitude.
· The Hungarian National Association of Radio Distress Signaling and Info communications [31] runs an Emergency and Disaster Information Service (EDIS) as an important resource for travelers to get information about hazards like forest fires, earthquakes, tropical storms, and disease outbreaks.
· IRIS Earthquake Browser [32] enables the public to find earthquakes in any region of the globe and then import this information into the GEON Integrated Data Viewer (IDV) where the hypocenters may be visualized in three dimensions.
· Rapid Earthquake View [33] allows views and monitoring of recent earthquakes and access to seismograms from seismograph stations around the world.
· The Live Earthquake Map [5] shows earthquakes in the last 24 hours. This mashup uses a Google Map geographic frame for the base map and its feed Web services are obtained from three different sources.
· ESRI has a similar Public Information Map for Earthquakes [34] which shows the earthquakes for the last 90 days, population in the affected area and a shake map.
2.3. Grid Clustering
Plotting thousands of markers on the map is computationally challenging and thus may lead to a degraded experience. Grid-based clustering [35] was used to restrict the markers rendered on the map. It worked by dividing the map into squares of a certain size and then grouping the markers into each grid square. This type of rich and engaging user experiences can not only increase the performance but can also give better user satisfaction.
Witnessing the need for integrating information for decision making after an earthquake and the maturity of relevant technologies, we propose a mashup mechanism and present a prototype to demonstrate its potential. Section 3 introduces the design architecture. Section 4 discusses the implementation. Section 5 demonstrates the system through several scenarios. Section 6 concludes and discusses future research.
3. System Design and Architecture
3.1. Framework
The system is designed with an architecture (Figure 1) includes application server, database, client, live feeds, VGI input and leveraging google maps.
· Client side: The application was developed within Web client, integrating CSS, JavaScript, and additional toolkits like Dojo for providing a better user experience. It makes use of Browser-side API such as Google Maps API which provides a geographic frame for the basemap, Google Traffic API which is used to obtain live traffic conditions, and Google Directions API which is used to provide routing to essential facilities within a twenty mile buffer. Google Maps consumes the RESTful Web services from USGS in GeoJSON Format (Figure 2). The user can also provide input by filling out a form describing the earthquake and reporting nearby events. When the user sends a URL request to the local Tomcat server it connects to Web services, receives a response and displays HTML. The browser interprets this HTML markup and displays it in a form the client can understand. The user can also select the first responder facilities like emergency operation centers, fire stations, police stations and medical care facilities he would like to view and routing to facilities within a 20 mile buffer. He can select the option to view the live traffic conditions around him. The user can also provide VGI inputs by means of a form describing the earthquake and reporting the events around him.
· Server side: Operations such as reading or writing to a database, parsing of data or Web scrapping need to be performed on the Tomcat server. These operations are complex and done on the server side through powerful server side programming languages such as Java. The live feeds are obtained from the USGS server.

Figure 1. System overview.
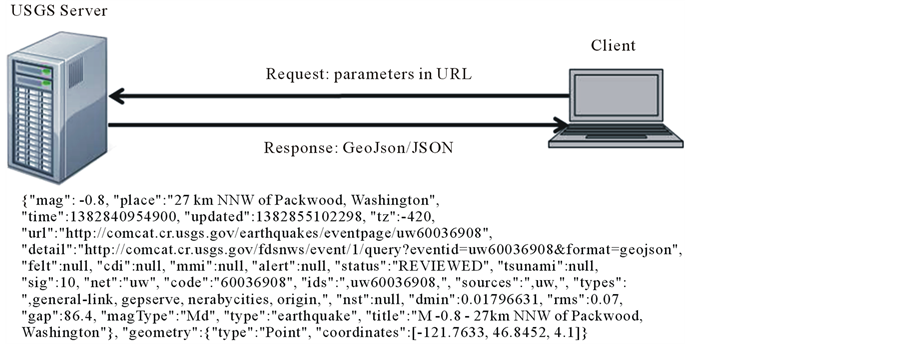
Figure 2. REST-style Web service, request in the form of a URL and response in JSON.
· Database: Data such as the VGI input and essential facilities information (e.g. emergency operation centers, fire station, police station, and medical care facilities) are stored in a MySQL database, and can be added and retrieved as desired.
3.2. Methodologies
Thick client architecture was employed, relying on the client rather than the server to perform most of the functions. This was made possible by using the Dojo toolkit [36] which is a rich Internet application allowing asynchronous communication between the browser and the server. There is fast interaction with the user since information on the page is updated without the need to reload the whole page [37] . The Dojo toolkit supports a rich user experience. There is also less pressure on the server since there are fewer round trips to the server. However it is critical to reduce the volume of data that have to be processed on the client to reduce delays.
RESTful Services are used for the Web application so that the client can send the request in the form of URL and receive the response in the form of JSON.
Model Viewer Controller (MVC) Architecture was used since it is the most currently used architecture to build Web based enterprise systems. MVC Architecture (Figure 3) was used to separate each module into three parts-the model, controller, and viewer for promoting the maintenance and separation of tasks to each component. It allows the division of work onto separate modules.
Marker Cluster: Many Web applications have latency problems, described commonly by end-users as “sluggishness”. Various techniques (such as pyramids and hash indices, multithreading and caching) have been employed to improve the experience [38] . The Web application developed in this research project requires the display of the locations of a large number of essential facilities. Grid based clustering was used to reduce the location markers displayed on the map by iterating though the markers in the list that needs to be clustered and adding each one into the closest cluster if it is within a minimum square pixel bounds (Figure 4). This increased the performance of the application and caused less visual overload.
4. Prototype Implementation
4.1. Data Types and Sources
4.1.1. Google Maps
Google Maps [39] was used as a geographic framework of reference because of its powerful Traffic and Directions API makes available live traffic conditions. The only restriction is that Google Maps API allows 25,000 requests per day and charges users when the request number exceeds 25,000.
4.1.2. Earthquake Feeds
The live earthquake feeds were obtained from USGS (United States Geological Survey). GeoJSON Format was chosen from many formats [29] as it was smaller in size and easier to parse compared to XML. USGS provides

Figure 3. MVC Architecture.

Figure 4. Grid based clustering.
information of all earthquakes greater than 2.5 magnitudes for the past week: http://earthquake.usgs.gov/earthquakes/feed/geojsonp/2.5/week. The European Mediterranean Seismological Centre (EMSC) distributes data on earthquakes in the last 24 hours. Big earthquakes events from around the world are shown, but EMSC focuses on European countries with smaller events from across Europe, especially the Mediterranean Sea (Greece, Aegean Sea and Turkey) region. The Geo Forschungs Zentrum (GFZ) Potsdam provides data for large earthquakes in the last twenty four hours, and has global coverage.
4.1.3. Essential Facilities Data
Essential facilities are those that provide services to the community and should be functional after an earthquake. They include fire stations, police stations, emergency operation centers and medical care centers (which include hospitals and medical clinics).
Data for essential facilities at the national level is difficult to obtain. Local governments, such as US counties typically have a rich library of information. However, combining county level data for the entire United States is a large, complex, and difficult task. The data for the emergency operation centers, hospitals, fire stations and police stations for the entire United States can be obtained from the software HAZUS-MH [11] (Figure 5). HAZUS-MH is a GIS based natural disaster (earthquake, hurricane and flood) modeling tool developed by Federal Emergency Management Agency (FEMA) to provide data to strengthen preparedness and response capabilities by assessing risk and forecasting losses.

Figure 5. Screen shot of data obtained from HAZUS-MH for the state of Alabama.
The essential facilities are extremely important, because after a disaster these sites provide the public with assistance and are critical in dealing with emergencies and supporting the public. The medical care facilities data within the HAZUS-MH software come from the American Hospital Association (AHA) 2000 data, the emergency response, fire stations and police stations data come from Info USA Inc. 2001 data. The HAZUS-MH software has a tool called Comprehensive Data Management System (CDMS) which allows the inbuilt inventory to be exported.
This data exported from CDMS is by state. Each state excel file contained sheets which holds the different facilities information.
4.1.4. Live Traffic
Live traffic conditions, and routing to facilities can be obtained from Google Traffic API Web services [40] (Figure 6), providing a user with live traffic conditions to find the best route to his destination. The color codes indicate the speed of traffic compared to free flowing traffic conditions. The Google Traffic API is supported primarily in urban areas, and the data is not always highly accurate, from temporal and qualitative perspective, but can add useful information during a crisis. Cell phone companies are constantly monitoring location of smartphone users based on the strength of signal received at the cell towers. When smartphone users use Google Maps and enable their location option on their smartphones, they are enabling their GPS. With the triangulation method between the cell towers and the GPS the mobile phone can be tracked and traffic information can be obtained through this technique and through several other related techniques.
4.1.5. Routing to Essential Facilities
The routing to essential facilities was obtained using the Google Directions API Web services [41] . The Google Directions API is a service that receives direction requests and returns routing results. In the request three mandatory fields need to be sent:
1) Origin, specifies the start location from which directions need to be calculated. In the Earthquake Information Mashup tool, the user’s current location is used.
2) Destination, specifies the end location to which directions need to be calculated. In the Earthquake Information Mashup tool, one of the essential facilities selected by the user will be used.
3) travelMode, this parameter specifies what mode of transportation will be used. This value can include walking, bicycling, transit and driving which is the default. In the Earthquake Information Mashup tool, driving was used.

Figure 6. Google Traffic: the color codes indicating the different traffic speeds.
4.1.6. Volunteering Geographic Information
A capability has been provided for users sensing an earthquake to report the event. A form is provided for users to report their name, zip code, telephone, description, latitude, and longitude. Coming up with the results for the Mercalli’s intensity levels in case of a severe earthquake with damage reported from survivors, reports from media and first responders. The VGI information input to the system could be used to compliment the Mercalli’s intensity levels data and serve as an early first approximation to the Mercalli’s scale. The geographic patterns of damage observed from the VGI system can be analyzed and could be used for planning and mitigation in the future.
4.2. Tools
The development environment was set up using the following software:
· Apache Tomcat7, an open source Web server was used to offer a simple, fast and stable performance. It is the most commonly used Web server software and can support programming in Java and a host of other programming languages.
· Eclipse IDE (www.eclipse.org) was used as the integrated development environment (IDE). Eclipse has many features for creating and testing the code. It is one of the most commonly used IDE due to its rich java development tools support and allows third party functional integration [42] .
· MySQL [43] was used because it’s free and a popular choice for Web application.
4.3. System
The application was implemented using browser-side mash up architecture. Several browser-side APIs (Google API for JavaScript, Google Traffic API for JavaScript and Google Directions API for JavaScript) were used. Dojo Toolkit was used to provide a good user experience. The USGS earthquake feeds were from a RESTful Web service and were in GeoJSON Format. The HTML5 Geolocation tool was used to find the users location from the browser. The Geolocation tool is supported on all the latest browsers like Internet Explorer, Firefox, Chrome, Safari and Opera.
The facilities data was stored in the MYSQL database, from where the data were retrieved using Java was used as the server side programing language and converted into JSON. The facilities within a twenty mile buffer can be calculated by first finding the distance between the user’s location and the facilities location. In this project only those facilities within a 20 mile buffer were selected.
The application was deployed on the Amazon AWS EC2 (Elastic Cloud Computing) cloud. Amazon AWS allows a one year free account to all users. A Linux Ubuntu 13.0 64 bit instance along with Tomcat 7 server and MySql database instance needs to be installed. The port settings should be configured so as to allow communication with the cloud. The project can be exported from the local machine to the cloud using FileZilla which is a free and cross platform FTP software. The EIM tool deployed using Amazon EC2 [44] , can be found at the following URL http://54.200.221.135:8080/DisasterMashup/ (as of October 5, 2014).
5. System Demonstration
Let us consider a scenario where a 6.3 magnitude earthquake has occurred in the Northern Virginia area, with its epicenter in Fairfax. Damage is reported in the Northern Virginia and DC area. This area has a dense urban environment that includes residents, commuters and visitors from other neighboring areas. The Northern Virginia, DC area, is also home and headquarters to many Federal and National institutions. Accordingly, numerous resources are available for natural disaster assistance, which includes top ranking local response teams, and national agencies with a vast network in place in the event of a natural disaster.
People need not look too far and can make use of the EIM tool as long as they have access to the Internet and consent to provide their location to the EIM tool. Since the EIM tool makes use of the Geolocation API in HTML5, the application asks permission from the user whether they would like to share their location details. Once the user approves to share their location, the application will be able to track their browser’s location and their position will be displayed on the map with a marker showing their coordinates. By default, every time the map is loaded, the map displays the current earthquakes in the US for the past week with a magnitude higher than 2.5. The EIM tool displays properties about the earthquake such as the location of the focus of the earthquake along with other properties such as the latitude and longitude, its magnitude, and time at which it occurred.
The application also integrates live traffic conditions for the entire US. If after the Fairfax earthquake a user would like to visit loved ones, she/he could take a look at the EIM tool which provides the current traffic conditions. It would give the user an idea of which roads are currently congested where the traffic is moving very slowly, and they could avoid these roads.
The user can select the VGI option and get a feel of the current situation in Fairfax area provided other users have been reporting events using this tool. The user can also be a citizen reporter and describe the situation and damage in their area. The user of this application will have to provide their Name, Zip code, Telephone number, Description of the event and their latitude and longitude (Figure 7). Once the user’s entry is approved by the

Figure 7. VGI report of events and a description of the scenario.
administrator, the user’s entry will be displayed. To protect the identity of the user, only their location and description of event entries are displayed.
The following demonstrates the usage of the system with a few scenarios: 1) finding a hospital close by, 2) finding fire station for emergency, 3) finding police station for public safety, 4) getting help for maintenance.
5.1. Finding a Nearby Hospital for Medical Emergency
Sample challenge: There have been numerous casualties, remaining unattended in the community where the user lives and need to be transported to the nearest hospital.
Analysis: The tool can be used to find out where the medical care facilities in the area are (Figure 8). The user can see the medical facilities within a twenty mile radius and choose any one of them. When a user clicks the information window of the medical facilities, contact information is displayed.
Solution: The user could use the telephone number to contact the medical care facility or they could drive directly to the medical care center. The application provides a routing tool to all the medical care facilities within the twenty mile buffer while giving directions and taking into consideration the live traffic conditions.
5.2. Finding a Fire Station
Sample challenge: Houses have collapsed and trees have been uprooted in the vicinity of the user. The roof of the neighboring house has collapsed. Since there is no sign of the neighbors they could be trapped in the debris.
Analysis: The user can use the tool to find local fire stations (Figure 9). The user could also see ones within a broader buffer zone, and choose any one of them.
Solution: On clicking the desired fire station, the user is able to obtain the address and contact information. They could call the selected fire station or they could even drive to the fire station and file a complaint. The application provides a routing tool to all the fire station facilities within a twenty mile buffer while taking into consideration live traffic conditions.
5.3. Finding Police Station for Public Safety
Sample challenge: There has also been a lot of widespread looting in the aftermath of the event. The roof of the nearby ABC supermarket has collapsed. Taking advantage of the situation, people are helping themselves to the goods.

Figure 8. Routing from current location to medical care facilities.

Figure 9. Routing from current location to fire station.
Analysis: The user can use the tool to find out the police stations in the area (Figure 10). They could locate the ones within a twenty mile buffer and choose any one of them which they feel would be the best one.
Solution: On clicking the police station the user could obtain the address and contact information. They could either call or drive to the police station to file a complaint. The EIM tool provides a routing tool to all the police station facilities within the twenty mile buffer while taking into consideration the live traffic condition.
5.4. Getting Help for Maintenance
Sample challenge: It has been days since the earthquake occurred. There have been uprooted trees hanging dangerously close to electrical wires wires. There has been a power outage power for the past week. The local fire station has not been responding to repeated calls and there has not been help from the county services either.
Analysis: The user can use the EIM tool to find out the emergency operation centers in the area (Figure 11). They could also see the ones within the twenty mile buffer and choose any one of them which they feel would be the best one or the closest closest.
Solution: On clicking the information window of the emergency operation center they could obtain the address and contact information. They could either call or drive to the emergency operation center to file a complaint and obtain emergency food supplies for themselves.
6. Conclusions and Discussion
This paper reports a Web-based situational awareness earthquake information mashup tool. A prototype was developed to demonstrate the potential efficiency of the system to produce an automated visualization and routing tool for the general public. The system includes a Web based situation awareness GIS that could monitor and map earthquakes and location of emergency facilities, provide live traffic conditions and route path to the emergency facilities. The project shows how a variety of Web technologies and services can be integrated into a scalable visualization model to provide better situation awareness to the user.
Some individuals do not have a good spatial sense and need directions when driving or moving. Even for getting from point A to point B, we require a GPS to guide us there. Similar systems have been used in the past even to provide an accessibility tool to the blind and the visually impaired [45] . A mashup tool can offer a platform which merges data from different sources and has different characteristics. By creating a layer stack of information the tool can create a visualization platform for discerning patterns that exist in the data [46] . It provides the user better situation awareness and the user is able to understand how events around him will impact or

Figure 10. Routing from current location to police station.

Figure 11. Routing from current location to emergency operation center.
play a role in the near future.
The EIM tool could provide buffer analysis for finding all emergency facilities within a twenty mile buffer and provide a routing tool from the user’s current position to these facilities. The EIM tool demonstrated how the Google Maps API, Google Traffic API and Google Directions API for JavaScript could be leveraged through mashup. The Google Maps API for JavaScript provided programmable access to live traffic and directions to facilitate routing to emergency facilities from the users location in live traffic conditions which other map API services like Bing Maps and Open Layers is not able to provide.
During the government shutdown from October 1st through 16th 2013, there was no access to the live earthquake feeds from USGS. At that time other sources for the earthquake feeds were considered. However, we decided to continue using USGS earthquake feeds since the USGS operates more sensors and have better coverage of local areas of interest.
Data used in this application was from Governmental sources like USGS and FEMA, which provides authoritative content; data from Google which provides semi authoritative commercial content; and VGI input, which is asserted content. A quality assessment of the various data sources should be performed in the future research.
The EIM tool demonstrated how VGI can be used to report destruction and damage from a natural disaster. The time when an entry is made should be incorporated so that user can determine what information provided by the system is temporally relevant. Checking the quality of VGI input can be difficult, especially when there is a flood of VGI input messages after an earthquake, but quality assessment is important and there are many methods that can be used, as discussed by Many researchers [47] -[50] . Checking for the accuracy, error and quality of VGI input is therefore a good topic to consider for future research.
Cartographic research should be conducted to take care of overlapping markers in case of earthquakes, and best practices from other cartographic interfaces will be considered, and where appropriate, adopted.
After an earthquake, there could be a flood of users accessing the application. Future research should be undertaken so that the application is able to support a large number of users and still give good performance [51] . Scalability should be considered and techniques such as load balancing, compression, caching and indexing techniques [7] for the database could be investigated to improve the performance utilizing the latest geocomputing technologies, such as spatial cloud computing [52] .
The application could be designed for a mobile interface. The HTML5 Geolocation tool could be used to more effect by making use of the other functions which would enable the platform to behave like a GPS and return the updated position of the user as they move or point of interest input by the end user.
Natural disasters such as wildfires, tornadoes could also be incorporated to make it a disaster information mashup system. Other near real time data which also play an important role in the situation like weather and demographic information could be incorporated to show new relationships and perform various analyses like population affected.
Acknowledgements
Zhenlong Li, Kai Liu and Zhipeng Gui helped with the development and deployment of the applications onto cloud servers. Manzhu Yu helped format the paper.
References
- Cutter, S.L. (2003) GI Science, Disasters, and Emergency Management. Transactions in GIS, 7, 439-446. http://dx.doi.org/10.1111/1467-9671.00157
- Nolen-Hoeksema, S. and Morrow, J. (1991) A Prospective Study of Depression and Posttraumatic Stress Symptoms after a Natural Disaster: The 1989 Loma Prieta Earthquake. Journal of Personality and Social Psychology, 61, 115-121. http://dx.doi.org/10.1037/0022-3514.61.1.115
- Hafner, K. and Lyon, M. (1999) Where Wizards Stay up Late: The Origins of The Internet. Simon and Schuster.
- Crooks, A., Croitoru, A., Stefanidis, A. and Radzikowski, J. (2013) #Earthquake: Twitter as a Distributed Sensor System. Transactions in GIS, 17, 124-147. http://dx.doi.org/10.1111/j.1467-9671.2012.01359.x
- Live Earthquake (2013) Live Earthquake Mashup. http://www.oe-files.de/gmaps/eqmashup.html
- Stefanidis, A., Crooks, A. and Radzikowski, J. (2013) Harvesting Ambient Geospatial Information from Social Media Feeds. GeoJournal, 78, 319-338. http://dx.doi.org/10.1007/s10708-011-9438-2
- Zook, M., Graham, M., Shelton, T. and Gorman, S. (2010) Volunteered Geographic Information and Crowdsourcing Disaster Relief: A Case Study of the Haitian Earthquake. World Medical & Health Policy, 2, 7-33. http://dx.doi.org/10.2202/1948-4682.1069
- Vieweg, S., Hughes, A.L., Starbird, K. and Palen, L. (2010) Microblogging during Two Natural Hazards Events: What Twitter May Contribute to Situational Awareness. Proceedings of the SIGCHI Conference on Human Factors in Com- puting Systems, CHI’10, Atlanta, 10-15 April 2010, 1079-1088. http://doi.acm.org/10.1145/1753326.1753486
- Goodchild, M.F. and Glennon, J.A. (2010) Crowdsourcing Geographic Information for Disaster Response: A Research Frontier. International Journal of Digital Earth, 3, 231-241. http://dx.doi.org/10.1080/17538941003759255
- Slocum, T.A. (2009) Thematic Cartography and Geovisualization. Pearson Prentice Hall, Upper Saddle River.
- FEMA, H.-M. (2013) Hazus | FEMA.gov. http://www.fema.gov/hazus
- Petersen, J.F., Sack, D.I. and Gabler, R.E. (2011) Physical Geography. 10th Edition, Cengage Learning.
- Wald, D.J., Quitoriano, V., Dengler, L.A. and Dewey, J.W. (1999) Utilization of the Internet for Rapid Community Intensity Maps. Seismological Research Letters, 70, 680-697. http://dx.doi.org/10.1785/gssrl.70.6.680
- Longley, P. (2005) Geographic Information Systems and Science. John Wiley & Sons, Hoboken.
- Johnson, R. (2011) Russ Johnson Talks Esri and All Things GIS. http://www.emergencymgmt.com/disaster/Russ-Johnson-Talks-Esri-GIS.html?page=2&
- O’Reilly, T. (2005) What Is Web 2.0: O’Reilly Media. http://oreilly.com/pub/a/Web2/archive/what-is-Web-20.html?page=1
- Kraak, M.J. (2007) Geovisualization and Visual Analytics. Cartographica: The International Journal for Geographic Information and Geovisualization, 42, 115-116. http://dx.doi.org/10.3138/carto.42.2.115
- Sun, M., Li, J., Yang, C., Schmidt, G.A., Bambacus, M., Cahalan, R., Huang, Q., Xu, C., Noble, E.U. and Li, Z. (2012) A Web-Based Geovisual Analytical System for Climate Studies. Future Internet, 4, 1069-1085. http://dx.doi.org/10.3390/fi4041069
- Fu, P. and Sun, J. (2011) WebGIS: Principles and Applications. ESRI Press, Redlands.
- Goodchild, M.F. (2007) Citizens as Sensors: The World of Volunteered Geography. GeoJournal, 69, 211-221. http://dx.doi.org/10.1007/s10708-007-9111-y
- Yang, C., Fu, P., Goodchild, M.F. and Xu, C. (2014) Integrating GIScience Applications through Mashup. CyberGIS, in press.
- Batty, M., Hudson-Smith, A., Milton, R. and Crooks, A. (2010) Map Mashups, Web 2.0 and the GIS Revolution. Annals of GIS, 16, 1-13. http://dx.doi.org/10.1080/19475681003700831
- Butler, D. (2006) Mashups Mix Data into Global Service. Nature, 439, 6-7. http://dx.doi.org/10.1038/439006a
- Liu, S.B., Palen, L., Sutton, J., Hughes, A.L. and Vieweg, S. (2008) In Search of the Bigger Picture: The Emergent Role of On-Line Photo Sharing in Times of Disaster. Proceedings of the Information Systems for Crisis Response and Management Conference (ISCRAM). http://works.bepress.com/vieweg/11
- Maceachren, A.M. and Brewer, I. (2004) Developing a Conceptual Framework for Visually-Enabled Geocollaboration. International Journal of Geographical Information Science, 18, 1-34. http://dx.doi.org/10.1080/13658810310001596094
- MacEachren, A.M., Gahegan, M., Pike, W., Brewer, I., Cai, G., Lengerich, E. and Hardistry, F. (2004) Geovisualization for Knowledge Construction and Decision Support. IEEE Computer Graphics and Applications, 24, 13-17. http://dx.doi.org/10.1109/MCG.2004.1255801
- Paulson, L.D. (2005) Building Rich Web Applications with Ajax. Computer, 38, 14-17. http://dx.doi.org/10.1109/MC.2005.330
- Gui, Z., Yang, C., Xia, J., Li, J., Rezgui, A., Sun, M., Xu, Y. and Fay, D. (2013) A Visualization-Enhanced Graphical User Interface for Geospatial Resource Discovery. Annals of GIS, 19, 109-121. http://dx.doi.org/10.1080/19475683.2013.782467
- USGS Earthquake, Ha. P. (2013) 1 Day, Magnitude 2.5+ Worldwide. http://earthquake.usgs.gov/earthquakes/map/
- USGS, Live Feeds (2013) Real-Time Feeds & Notifications. http://earthquake.usgs.gov/earthquakes/feed/v1.0/
- RSOE, E. (2013) RSOE EDIS: Emergency and Disaster Information Service. http://hisz.rsoe.hu/alertmap/index2.php?area=usa
- IRIS Earthquake B. (2013) IRIS Earthquake Browser. http://www.iris.edu/ieb/
- REV, E.V. (2013) REV: Earthquake View. http://rev.seis.sc.edu/earthquakes.html?view=contig_us
- ESRI, P. I. M. (2013) Earthquakes. http://tmappsevents.esri.com/Website/earthquake-responsive/
- Google (2013) Too Many Markers! Google Maps API—Google Developers. https://developers.google.com/maps/articles/toomanymarkers
- Dojo (2013) Unbeatable JavaScript Tools—The Dojo Toolkit. http://dojotoolkit.org/
- Putz, S. (1994) Interactive Information Services Using World-Wide Web Hypertext. Computer Networks and ISDN Systems, 27, 273-280. http://dx.doi.org/10.1016/0169-7552(94)90141-4
- Yang, C., Wong, D.W., Yang, R., Kafatos, M. and Li, Q. (2005) Performance-Improving Techniques in Web-Based GIS. International Journal of Geographical Information Science, 19, 319-342. http://dx.doi.org/10.1080/13658810412331280202
- Google Maps (2013) Getting Started: Google Maps JavaScript API v3—Google Developers. https://developers.google.com/maps/documentation/javascript/tutorial
- Google Traffic API (2013) Traffic Layer—Google Maps JavaScript API v3—Google Developers. https://developers.google.com/maps/documentation/javascript/examples/layer-traffic
- Google Directions (2013) The Google Directions API: Google Maps API Web Services—Google Developers. https://developers.google.com/maps/documentation/directions/
- Murphy, G.C., Kersten, M. and Findlater, L. (2006) How Are Java Software Developers Using the Elipse IDE? IEEE Software, 23, 76-83. http://dx.doi.org/10.1109/MS.2006.105
- MYSQL (2013) MySQL : The World’s Most Popular Open Source Database. http://www.mysql.com/
- Amazon, EC2. (2013) AWS | Amazon Elastic Compute Cloud (EC2)—Scalable Cloud Servers. http://aws.amazon.com/ec2/
- Rice, M.T., Aburizaiza, A.O., Jacobson, R.D., Shore, B.M. and Paez, F.I. (2012) Supporting Accessibility for Blind and Vision-Impaired People with a Localized Gazetteer and Open Source Geotechnology. Transactions in GIS, 16, 177-190. http://dx.doi.org/10.1111/j.1467-9671.2012.01318.x
- MacEachren, A.M. (2004) How Maps Work: Representation, Visualization, and Design. Guilford Press, New York.
- Goodchild, M. and Li, L. (2012) Assuring the Quality of Volunteered Geographic Information. Spatial Statistics, 1, 110-120. http://dx.doi.org/10.1016/j.spasta.2012.03.002
- Girres, J. and Touya, G. (2010) Quality Assessment of the French OpenStreetMap Dataset. Transactions in GIS, 14, 435-459. http://dx.doi.org/10.1111/j.1467-9671.2010.01203.x
- Haklay, M. (2010) How Good Is Volunteered Geographical Information? A Comparative Study of OpenStreetMap and Ordnance Survey Datasets. Environment and Planning B: Planning & Design, 37, 682-703. http://dx.doi.org/10.1068/b35097
- Rice, M., Paez, F., Mulhollen, A., Shore, B. and Caldwell, D. (2012) Crowdsourced Geospatial Data: A Report on the Emerging Phenomena of Crowdsourced and User-Generated Geospatial Data. Annual. George Mason University, Fair- fax. http://www.dtic.mil/dtic/tr/fulltext/u2/a576607.pdf
- Li, Z., Yang, C.P., Wu, H., Li, W. and Miao, L. (2011) An Optimized Framework for Seamlessly Integrating OGC Web Services to Support Geospatial Sciences. International Journal of Geographical Information Science, 25, 595-613. http://dx.doi.org/10.1080/13658816.2010.484811
- Yang, C., Xu, Y. and Nebert, D. (2013) Redefining the Possibility of Digital Earth and Geosciences with Spatial Cloud Computing. International Journal of Digital Earth, 6, 297-312. http://dx.doi.org/10.1080/17538947.2013.769783