Journal of Geographic Information System
Vol.5 No.4(2013), Article ID:35364,9 pages DOI:10.4236/jgis.2013.54039
Modeled Surface Observations for Spatial Analysis of Landscape Dynamics
Department of Geography, Federal University of Rio de Janeiro, Rio de Janeiro, Brazil
Email: manoel.fernandes@ufrj.br, tatalacale@hotmail.com, ped.coura@gmail.com, pmenezes@acd.ufrj.br, alanjsg@gmail.com
Copyright © 2013 Manoel do Couto Fernandes et al. This is an open access article distributed under the Creative Commons Attribution License, which permits unrestricted use, distribution, and reproduction in any medium, provided the original work is properly cited.
Received April 13, 2013; revised May 12, 2013; accepted June 12, 2013
Keywords: DEM; Modeled Surface; Landscape Change
ABSTRACT
Landscape dynamics is a geoecological characteristic that defines changes in a landscape spatial structure and function during an established time scale. In this kind of analysis, geoprocessing is an essential tool, because it combines several technologies that help in this work. However, the majority of landscape dynamic investigations do not consider the dimensionality of the data and the information to be used, which is projected not measured from modeled (real) surface observations, and presents underestimated results, mainly in irregular relief landscapes. Considering that, this paper intends to assess the difference between observations on modeled and planimetric surfaces on the interpretation of landscape dynamics. The study was conducted in the massif of Tijuca, Rio de Janeiro (Brazil) using land use and soil cover maps of different times and a digital elevation models (DEM) generated based on a triangular irregular. The results show an increase of dynamic areas values when observations were carried out on modeled surface, as well as the deforestation rate (17.57% or 0.13 km2/year). This survey showed higher values in comparison with observations on planimetric surface, characterizing more realistic interpretations of how the structural elements and analyses made from these are structured in the landscape.
1. Introduction
Landscape analysis is an important geographical theme. Its dynamics can be evaluated as a geoecological characteristic that defines changes in the structure and functionality of a landscape in a particular time scale. This characteristic gains great importance as it shows the landscape as a historical product; in other words, a product of the time which regulates the occurrence of new arrangements of the biotic, non-biotic, and human elements and functions that this landscape takes in the face of new structures ([1] Huggett, 1995). The analysis of this characteristic is important because it shows, within a period of time, the behavior of the changes if the landscape, which can be used to generate predictions of the structure of that landscape and, consequently, its functionality ([2] Turner, 1989 and [3] Forman, 1995).
For the analysis of this geoecological characteristic, some authors, e.g. [4] Risser et al. (1984), [5] Navehand Lieberman (1984), [6] Forman andGodron (1986), [7] Haines-Yong et al. (1993), [8] Aspinall (1999), [9] Coelho Netto et al. (2007), [10] Guofanand Wu (2008), claim the use of geoprocessing techniques are indispensable. However, a series of questions about the use of geoprocessing techniques must be thoroughly evaluated in order to avoid problems in the results achieved. This is where the scientific research becomes so important. These questions are basically consequences of the construction of computer representations of reality, in other words, a conceptual model that seeks to portray the landscape to be studied. One of these questions is the non-consideration of the dimensionality of the data and information to be worked with, which are actually assessed by the observation of their planimetric (projected) surface and not on the modeled (real) surface, which may mask the interpretation of the structure, dynamics and functionality of the geoecological elements, especially in landscapes with a rough relief.
Even having a range of options to work with the dimensionality of the elements of a landscape, such as the use of digital elevation models (DEM) ([11] Wilson and Gallant 2000), geoprocessing has a limitation established by the non-consideration of the irregularity of the area to be examined. In this sense, even when working with 3D data, the area is not taken into account as being continuous and endowed with relief, so measurements of area and distance of the elements that make up the landscape may be underestimated, particularly in areas with a rough relief ([12] Fernandes et al., 2012, [13] Rashid 2010 and [14] Jenness 2004).
The reading of the structure of the landscape on the modeled surface unveils different values than the reading on the planimetric surface, which will certainly influence the analysis of its functionality and dynamics. Depending on the placement of the analyzed structure in the landscape, that difference can achieve very meaningful values, such as the rocky outcrops that occur in high slope areas (Figure 1).
In seeking to interpret the variation of observations on modeled and planimetric surfaces in the analysis of the dynamics of a landscape, an assessment of that variation was drawn up in two maps of land use and soil cover from two different seasons (1972 and 1996) and in the analytic-integrative outcome of the forestry dynamics derived from the combination of these two maps of structural and functional elements. The area used for the study is the massif of Tijuca (Rio de Janeiro-Brazil).
This massif belongs to the coastal range of the state of Rio de Janeiro and is located in the eastern portion of the municipality of Rio de Janeiro (Brazil). Its geomorphologic feature has a very rugged topography, where the analysis of observations on the modeled surface is quite relevant. In Figure 2 it is possible to see how the altitude and slope increases toward the edges of the central part of the massif. It is important to note that, this characteristic has a direct influence on the analysis proposed.
The massif of Tijuca is a geomorphologic unit that, along with the massif of PedraBranca and Gericino-
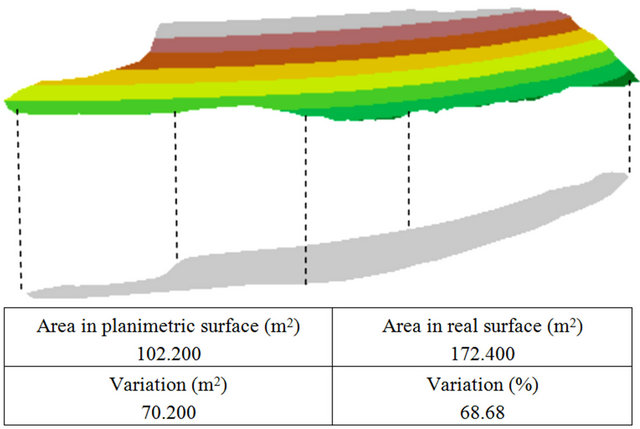
Figure 1. Rocky outcrop on real (modeled) and planimetric surface.
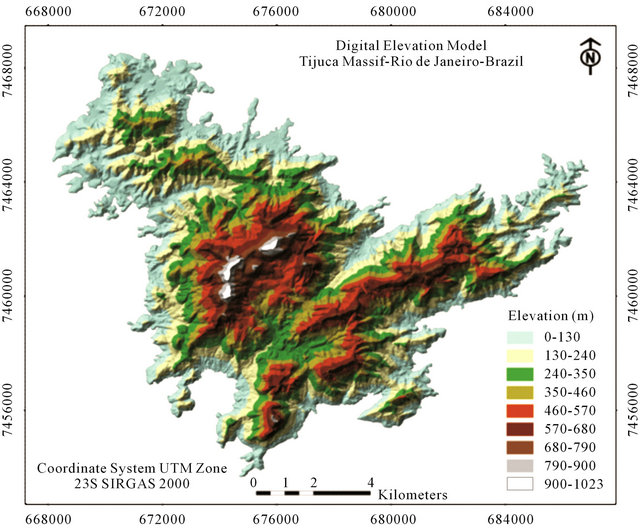
Figure 2. Digital elevation model of the massif of Tijuca in the Rio de Janeiro city.
Medanha, composes the coastal massif compartment of the city of Rio de Janeiro. This massif has an area of approximately 119.2 km2, delimited above the quota of 40 meters, occupying an eastern portion of Rio de Janeiro/ RJ, between the parallels 22˚55'S - 23˚00'S; and the meridians 43˚20' W - 43˚10'W (Figure 3).
Other characteristic of this geomorphologic unit is your importance on the process of expansion and occupation of the Rio de Janeiro city, because it is one of the large buoys, along with the sea, of this process. In general, the massif of Tijuca is found to be quite altered because of the degregadation experienced over time, through transformational inputs such as deforestation, fires and disordered urban occupation. In this sense, it is important to do an evaluation of the consideration of the tridimensionality of the elements that compose this landscape to effectively know its degree of transformation.
2. Data and Methods
The development of the work is divided into three stages: Preparation of the elements for the geoecological analyses; application of the routine to obtain observations on the modeled surface; and final evaluation (Figure 4).
2.1. Preparation of the Elements for the Geoecological Analyses
This step is the preparation of all mappings used (base mapping, maps of structural and functional elements, and maps of the analytic-integrative outcome) and the DEM used to obtain the observations on the modeled surface.
The base mapping used was that from the Pereira Passos Institute in Rio de Janeiro at scale 1:10,000 and projected coordinate system UTM zone 23S, South American 1969 datum. From this base, all maps of the structural and functional elements (land use and soil cover 1972-1996), analytic-integrative outcome (forestry dynamics) and the DEM were built. It is important to note that the area of massif of Tijuca was defined by the contour line of 40 meters from the cartographic basis used.
The maps of land use and soil cover (1972-1996) were compiled from [15] GEOHECO-SMAC-RJ (2000) and adjusted to the base mapping used. All the maps were produced through photointerpretation at scale 1:10,000. The dynamics of the forest cover is the result of the combination of maps of land use and soil cover from those two years of analysis, following the analyticalintegrative method ([15] GEOHECO-SMAC-RJ 2000). This map was classified into three categories (retraction, preservation and non-forested area within the period of analysis), which gave conditions to assess the retraction and preservation of forest areas in the massif of Tijuca.
The DEM was generated based on a triangular irregular network using Delaunay triangulation and linear adjustment interpolation. The use of this method is justified by the results obtained by [16] Fernandes and Menezes
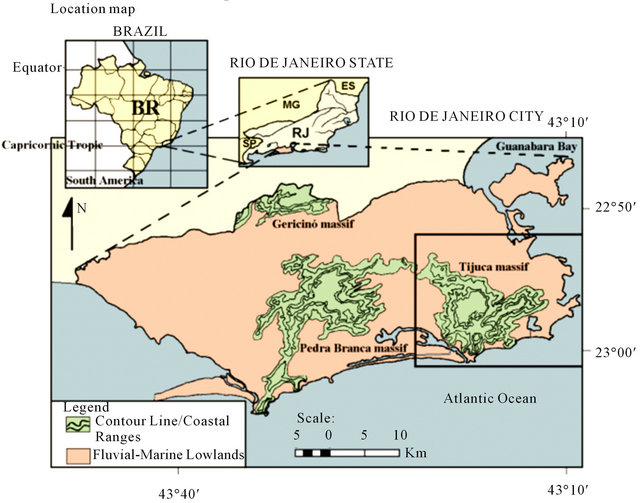
Figure 3. Location map of the massif of Tijuca in the Rio de Janeiro city.
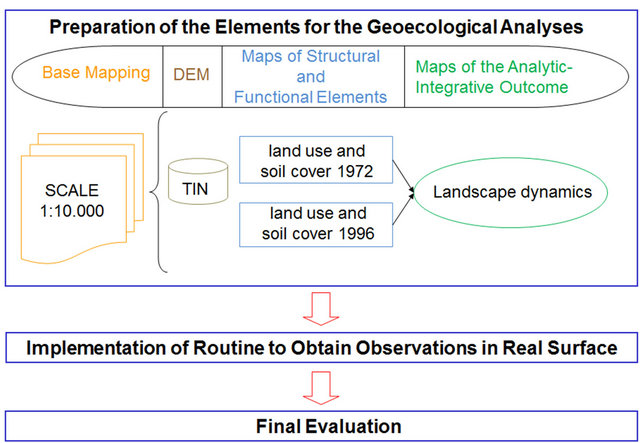
Figure 4. Methodological flowchart.
(2005) in the comparison of different methods of generating DEM to obtain observations on the modeled surface of the massif of Tijuca. The model had, as entry data, the topographic information (index and intermediates contour lines, spot heights and altitude of trig points) belonging to the generated topographic base. Other types of fundamental data seeking for better refinement, watershed and drainage were also used in the generation of the model.
2.2. Routine Implementation to Obtain Observations on Modeled Surfaces
This routine is described by [17] Fernandes (2004) and was used in the quantification of the classes of maps of land use and soil cover and the map of forestry dynamics in order to compare the values of area on modeled and planimetric surfaces of each class generated for the surveys conducted.
2.3. Final Evaluation
This step is the evaluation of all comparisons of quantification of areas on the modeled surface and projected surface on the maps generated. This evaluation was of extreme importance to ascertain to what extent the nonconsideration of modeled surface in geoecological analyses of forestry dynamics in rugged area may mask the results.
3. Land Use and Soil Cover
In this newly created file, highlight all of the contents and import your prepared text file. You are now ready to style your paper. The maps of structural and functional elements of land use and soil cover (1972 and 1996), compiled from [15]GEOHECO-SMAC-RJ (2000) and adjusted to MT_10.000_IPP cartographic basis, have suffered a generalization following the analytical-integrative method, in order to decrease the number of classes to be examined, from 13 classes to 7. It is important to note that this paper’s objective is not to make an analysis of the land use and soil cover and its dynamics in the massif of Tijuca, but rather to understand the differences of analyses undertaken when the observations are on the modeled surface. The maps of land use and soil cover from 1972 and 1996, already with the classes merged, are shown in Figures 5 and 6, respectively.
On the Figures 7 and 8 it is possible to notice that for all the classes in both periods, as was expected, the value of the surface area was larger than the planimetric surface. The class of land use and soil cover which demonstrated the biggest difference between the two periods analyzed was the forested area, with differences of 10.67 km2 in 1972 and 7.62 km2 in 1996. This characteristic is due to greater expressiveness of occurrence of such use in the two periods and the location of these areas, which are concentrated in the areas with higher and steeper massif of Tijuca slopes.
The decrease in the area of coverage of this class from one period to another also determines the decrease of the difference of observation on the modeled surface to planimetric. It is not bigger just because the process of forest retraction occurs at the edges of the large forested area fragment of the massif, which is an area of lesser slope in relation to the most preserved area of this fragment. In 1972, the greatest difference found in the individual analysis of polygons occurred in a fragment of forested area, which in 1996 already appears entirely fragmented. Still, the most considerable variation of the observations occurs precisely in one of these fragments (4 km2).
The two classes with smaller differences when comparing modeled surface and planimetric surface were those of exposed soil and crops. In the year 1972, the class of exposed soil had the smallest difference, around 0.13 km2. In 1996, the class of crops presented the smallest variation, around 0.04 km2, outnumbering the exposed soil. This behavior occurs because as one can find represented in the map of 1996, landslides had occurred that year, which, by spreading down from high areas with a steep slope to lower areas, enhanced the difference on modeled and planimetric surfaces observations.
By assessing the percentage of variation of the observations on modeled and planimetric surfaces in the two years (Figures 7 and 8), we can realize that the rock and rocky outcrop areas stand out, as one of the structures grouped in that class, rocky outcrop, often occurs in areas of steep slope. Therefore, its representation in a planimetric surface presents large losses in relation to a modeled surface, followed by forested area in 1972. In 1996, the second largest loss can be noticed in the exposed soil, in light of the mapping of landslides, which occurred in
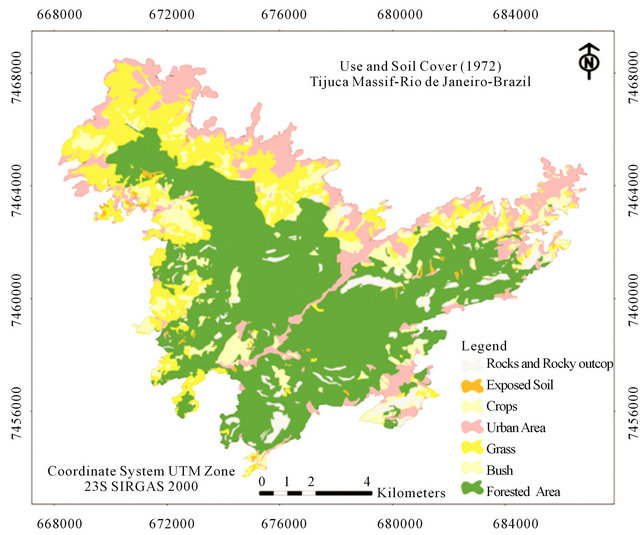
Figure 5. Map of land use and soil cover of the massif of Tijuca in 1972.
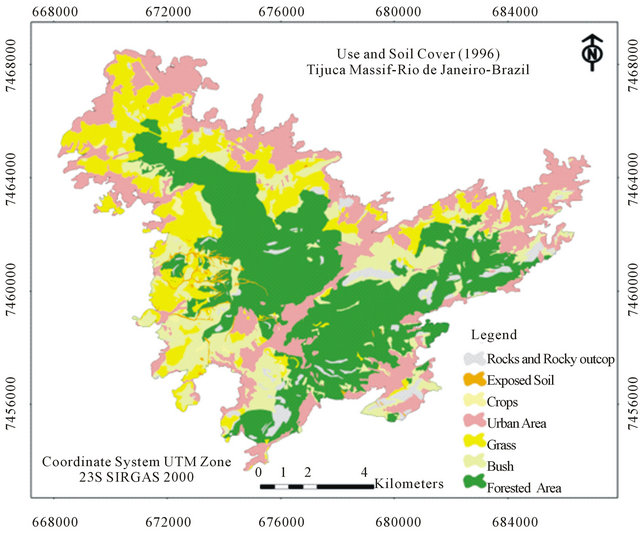
Figure 6. Map of land use and soil cover of the massif of Tijuca in 1996.
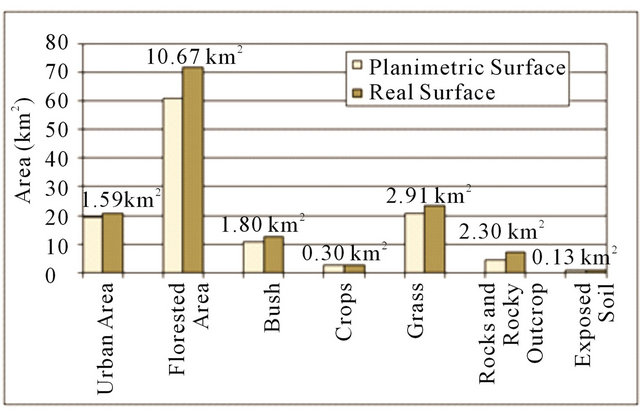
Figure 7. Chart of the classes of land use and soil cover on real (modeled) and planimetric surfaces and its differences in km2 and percentage (1972).
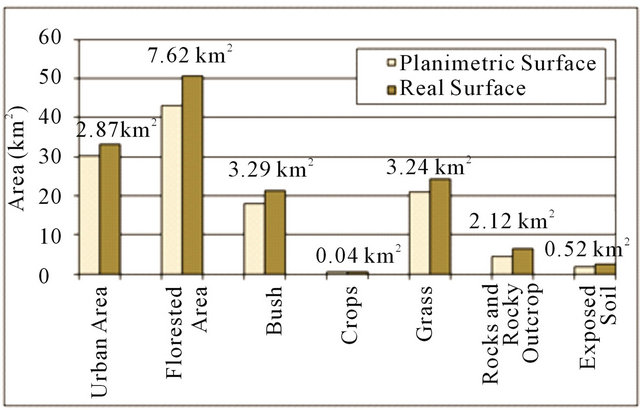
Figure 8. Chart of the classes of land use and soil cover on real (modeled) and planimetric surfaces and its differences in km2 and percentage (1996).
that year and already mentioned above.
Landscape Dynamic
The landscape dynamic, the result of the combination of land use and soil cover from 1972 to 1996, also revealed sensitive differences. Thirty-two classes of dynamics of use were generated, which total values of planimetric area, modeled surface, percentage of the difference between the two observations and area in kilometers of that difference have been reviewed.
Some of these classes showed no change, which means that some fragments remained as the same use in 1972 and 1996. Specifically, one of these classes-rocks/rocky outcrop and rocks/rocky outcrop, or in other words, the fragments that were rocky outcrop and rocks in 1972 and remained as rocky outcrop and rocks in 1996, showed a greater percentage of variation between the two observations. Again, the spatial location of rock outcrops was crucial to that result. The class forested area/forested area, or forested area in 1972 that remained with the same use in 1996, was presented as the greatest difference in area out of the two observations (7.62 km2).
Regarding the classes that showed some change, the classes of transformation of forested area to bush, grass and urban areas have been highlighted with differences in observation of 1.78 km2 (19.43%), 0.59 (16.53%) and 0.52 (12.44%) respectively. These classes represent some of what reflects the process of retraction of the massif of Tijuca. The differences found may mask an assessment of the forestry dynamics of this landscape. In order to make this assessment, an agglutination of classes was prepared, which were evaluated taking into consideration the two types of observations. The classes created were the forest retraction (wooded areas in 1972 that had another use in 1996), preservation (forest areas in 1972 that continued as forest in 1996) and non-forested area (nonwooded areas in 1972 which remained as non-wooded in 1996) (Figure 9).
By assessing Figure 10, which shows the differences in kilometers and percentage of observations on modeled and planimetric surfaces for the classes of forestry dynamics it is possible to point out the increase in the areas of classes observed on the modeled surface. The differences range from 3.05 km2 at the class retraction to 9.02 km2 of the class of non-forested area. In percentage terms, differences were more significant in the classes of preservation (17.69%) and retraction (17.10%).
These differences are linked to spatial distribution of these classes, because the areas of preservation are located at the higher and rugged parts of the massif, followed by the retraction areas that are in the intermediate zones and non-forested area, which are located in zones of lower altitude and are less rugged. This framework characterizes the process of forestry dynamics of the massif of Tijuca, which is directed from the lowest to the highest areas. Lowest areas have smaller slope values than the highest areas, and this slope behavior has a strong relationship with the mean difference of observations on modeled and planimetric surfaces, as can be seen in Figure 11.
Based on the values of forest retraction, a rate of forest retraction on modeled and planimetric surfaces was created, which was obtained from the relationship of the area of forest retraction on modeled and planimetric surfaces by the number of years of analysis. These rates also had different values when taken from different views thus increasing the forest retraction rate of 0.74 km2 per year on the planimetric surface to the forest retraction rate of 0.87 km2 per year on the modeled surface, which means a difference of 17.57% (Figure 12). This difference tends to be greater over time because the retraction is heading towards higher parts, where the difference of observation on the modeled surface is greater in relation to planimetric surface.
Given the above, it is clear that there is a need for in-
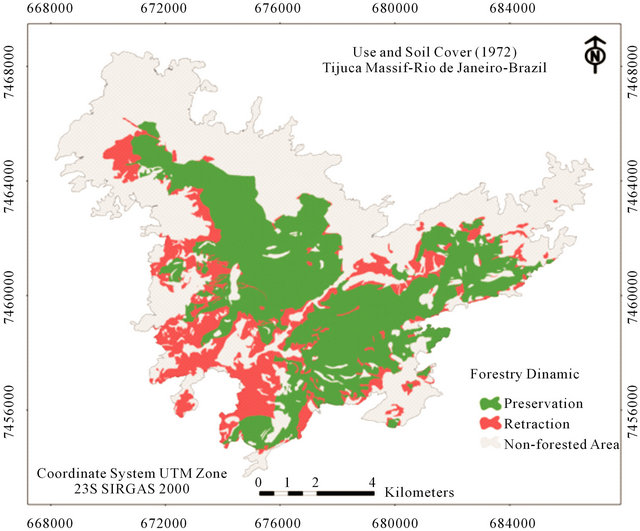
Figure 9. Map of forestry dynamics of massif of Tijuca.
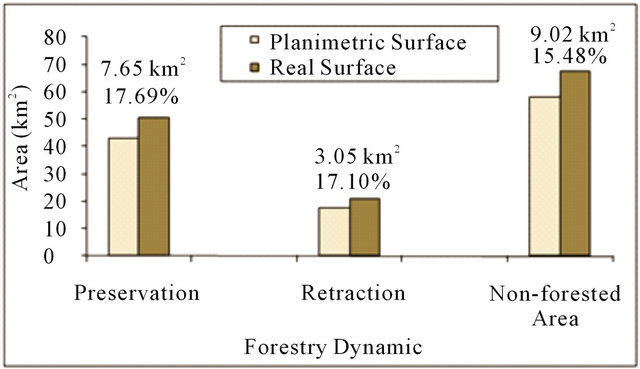
Figure 10. Distribution chart of the classes of forestry dynamics on real (modeled) and planimetric surfaces and its differences in km2 and percentage.
terpretation of the observations on the modeled surface, which brings a more accurate reading of the structure and landscape dynamic in question. So it may be noted that, for example, the rate of forest loss in the massif of Tijuca is more pronounced than when the adoption of the planimetric surface is analyzed.
It is important to note that the methodology to obtain observations on the modeled surface must still undergo further scientific research, seeking further to improve remarks proposals. One of these is the discussion about the type of digital elevation model to be used, which should be evaluated according to the area, available data
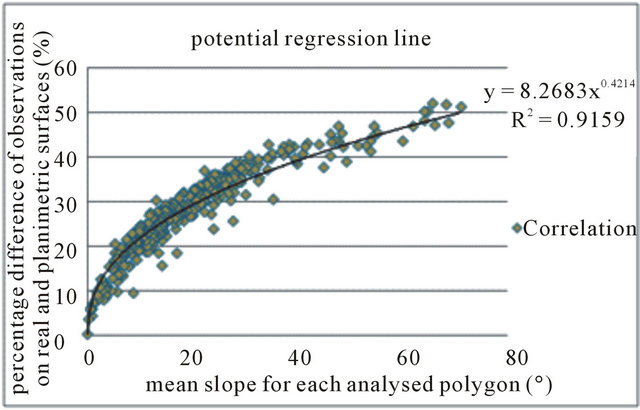
Figure 11. Potencial regression line from percentage difference of observation on real (modeled) and planimetric surface and mean slope for each forestry dynamics polygon.
and scale of analysis assumed.
4. Conclusions
In the geoecological evaluation that was performed in this work, a significant difference in the use of observations on the modeled surface was found. This type of survey showed higher values in comparison with observations on the planimetric surface, thus characterizing closer interpretations of how the structural and functional elements and analyses made from these are structured in
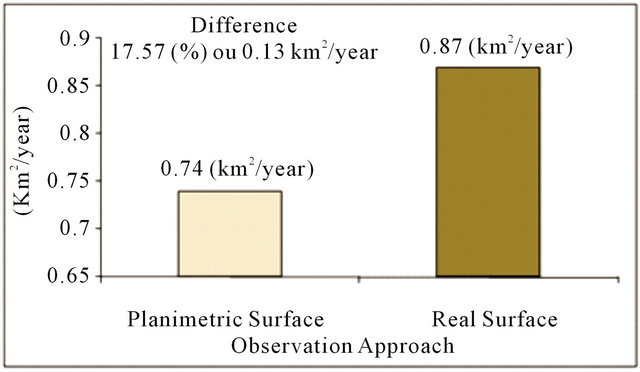
Figure 12. Retraction tax of the massif of Tijuca on real (modeled) and planimetric surfaces.
the landscape. Thus, taking into consideration the irregularities raised by the morphology of surface, the observations of a landscape can no longer be underestimated when considering the modeled surface observation and can show a different reality if compared with the most usual measurements on the planimetric surface. However, it is important to underline that the use of observations on the modeled surface is very relevant in areas of rugged topography, which do not occur in areas with a nonrugged relief. It also emphasized that the use of observations on the modeled surface is not exclusive to geoecological analyses and should also be applied in other areas of knowledge. Therefore, the search to provide subsidies in order to improve the representation of the general conceptual models in geoprocessing reflects the discreet and limited capacity of this representation in computer systems.
The main focus of this article was to show the importance of observation on the modeled surface for geoecological analysis. However, it is important that the work of landscape dynamics in the massif of Tijuca is being continued with more recent maps of land use and soil cover, such as mapping the years 1999, 2004 and 2010.
5. Acknowledgements
This research was supported by a grant from the CNPq (National Council for Developing Science and Technology) and FAPERJ (Carlos ChagasFilho Foundation for Research Development of the Rio de Janeiro State).
This paper was reviewed by Brian Ackerman. He is geographer and native English teacher who checked the manuscript and refined the language.
REFERENCES
- R. J. Huggett, “Geoecology: An Evaluation Approach,” Routledge, London, 1995. doi:10.4324/9780203307373
- M. G. Turner, “Landscape Ecology: Effect of Pattern on Process,” Annual Review of Ecology and Systematics, Vol. 20, 1989, pp. 171-197. doi:10.1146/annurev.es.20.110189.001131
- R. T. T. Forman, “Land Mosaics: The Ecology of Landscapes and Regions,” 1st Edition, Cambridge University Press, London, 1995.
- R. J. Risser, J. R. Karr and R. T. T. Forman, “Landscape Ecology: Directions and Approaches,” Natural History Survey Special Publications 2, Illions, 1984.
- Z. Naveh and A. S. Lieberman, “Landscape Ecology: Theory and Application,” Springer-Verlag, New York, 1984.
- R. T. T. Forman and M. Godron, “Landscape Ecology,” 1st Edition, John Wiley & Sons, New York, 1986.
- R. Haines-Yong, D. R. Green and S. H. Cousins, “Landscape Ecology and GIS,” Taylor & Francis, London, 1993.
- R. J. Aspinall, “GIS and Landscape Conservation,” In: M. F. Goodchild, D. J. Maguire and D. W. Rhind, Eds., Geographical Information System, 2nd Edition, John Wiley & Sons, New York, 1999, pp. 967-980.
- A. L. Coelho Netto, A. S. Avelar, M. C. Fernandes and W. A. Lacerda, “Landslide Susceptibility in a Mountainous Geoecosystem, Tijuca Massif, Rio de Janeiro: The Role of Morphometric Subdivision of the Terrain,” Geomorphology, Vol. 87, No. 3, 2007, pp. 120-131. doi:10.1016/j.geomorph.2006.03.041
- S. Guofan and J. Wu, “On the Accuracy of Landscape Pattern Analysis Using Remote Sensing Data,” Landscape Ecology, Vol. 23, No. 5, 2008, pp. 505-511. doi:10.1007/s10980-008-9215-x
- J. P. Wilson and J. C. Gallant, “Terrain Analysis: Principles and Applications,” John Wiley & Sons, New York, 2000.
- M. C. Fernandes, C. S. Vieira, P. H. F. Coura and R. R. Silva, “Real Surface Observations in the Analysis of Slums Situated on Hilly Terrain,” American International Journal of Contemporary Research, Vol. 2, No. 8, 2012, pp. 20-28. http://www.aijcrnet.com/journals/Vol_2_No_8_August_2012/2.pdf
- H. Rashid, “3-D Surface-Area Computation of the State of Jammu & Kashmir Using Shuttle Radar Topographic Mission (SRTM) Data in Geographical Information System (GIS),” Journal of Geomatics, Vol. 4, No. 2, 2010, pp. 77-82. http://www.isgindia.org/JOG/abstracts/oct-2010/5120121.pdf
- J. S. Jenness, “Calculating Landscape Surface Area from Digital Elevation Models,” Wildlife Society Bulletin, Vol. 31, No. 3, 2004, pp. 829-839. doi:10.2193/0091-7648(2004)032[0829:CLSAFD]2.0.CO;2
- GEOHECO-SMAC-RJ, “Estudos de Qualidade Ambiental do Geoecossistema do Maciço da Tijuca: Subsídios à Regulamentação da APARU do Alto da Boa Vista,” Technical Report, Vol. 2, 2000.
- M. C. Fernandes and P. M. L. Menezes, “Evaluation of Methods for DEM Generating for Real Surface Observation: A Case Study in Massif of Tijuca—RJ,” Brazilian Journal of Cartography, Vol. 57, No. 2, 2005, pp. 154- 161. http://www.rbc.ufrj.br/_2005/57_2_10.htm
- M. C. Fernandes, “Desenvolvimento de Rotina de Obten- ção de Observações em Superfície Real: Uma Aplicação em Análises Geoecológicas,” Ph.D. Thesis, Federal Universityof Rio de Janeiro, Rio de Janeiro, 2004.