Engineering
Vol. 5 No. 9 (2013) , Article ID: 36387 , 5 pages DOI:10.4236/eng.2013.59090
Computation of Impact Factor of High-Speed Railway Bridge by KTX Train Riding Test
1Structural Engineering Research Division, Korea Institute of Construction Technology, Goyang, South Korea
2Department of Civil Engineering, Kyung Hee University, Goyang, South Korea
Email: hiyoon@kict.re.kr
Copyright © 2013 Hyejin Yoon et al. This is an open access article distributed under the Creative Commons Attribution License, which permits unrestricted use, distribution, and reproduction in any medium, provided the original work is properly cited.
Received July 6, 2013; revised August 6, 2013; accepted August 13, 2013
Keywords: High-Speed Railway; Dynamic Response; Impact Factor; Moving Average Method
ABSTRACT
The design live load of railway is divided into common railway and high-speed railway separately in Korea. Accordingly, the Korean design specification of railway specifies the impact factor for common railway and high-speed railway respectively. The impact factor for high-speed railway is based on Eurocode. Since the impact factor criteria in Korea were established by adopting those of the Eurocode and without dedicated investigation relying on research results reflecting the domestic circumstances, thorough examination should be implemented on these criteria. Therefore the evaluation of impact factor based on field tests is required. Both dynamic and static vertical displacements are necessary to compute the impact factor. The dynamic response can be obtained from the measurement of deflection of the bridge slab crossed by the first Korea high-speed train (KTX, Korea Train eXpress) running at high-speed. The main difficulties encountered are in obtaining static response because static response corresponds to the response of the bridge when the train remains immobile on the bridge or crosses the bridge at speed slower than 5 km/hr. This study introduces the static response derived by applying the moving average method on the dynamic response signal. To that goal, field measurements was conducted under train speeds of 5 km/hr and ranging from 100 km/hr to 300 km/hr on Yeonjae Bridge located in the trial section of the Gyeonbu High-Speed Railway Line before its opening. The validity of the application of the moving average method is verified from comparison of measured static response and derived static response by moving average method. Moreover, evaluation is conducted on the impact factor computed for a bridge crossed by the KTX train running at operational speed.
1. Introduction
The design live load of railway is divided into common railway and high-speed railway separately in Korea. Accordingly Korean design specification of railway specifies the impact factor for common railway and highspeed railway respectively [1]. Korea implemented active research on the dynamic behavior and dynamic characteristics of bridges together with the introduction of the Gyeongbu High-Speed Railway Line. However, studies focused essentially on the dynamic behavior of the bridges, which was problematic at the time, but were not conducted to provide bases for the establishment of criteria. While the D214 Project conducted by the European Rail Research Institute (ERRI) Committee provide the fundamental data that served as basis for the preparation of the specifications related to the dynamic behavior of high-speed railway bridges in the Eurocode and UIC [2].
The high-speed railway bridge is designed by selecting the worst case by comparing the responses of the bridge under application of the HL load, the design live load, multiplied by the impact factor and the responses under application of the real train load considering the dynamic amplification factor. Here, the impact factor is adopted to consider the increase of the static load caused by the bridge-train interaction occurring during the crossing of the train. In Korea, the impact factor currently applied for the high-speed railway magnifies the design live load by 0% to 15%. Equations (1) and (2) present the formulae for the impact factor applied for the high-speed railway in Korea. The impact factor is calculated with respect to the length of the structure,  (m), and identical values are used indifferently for reinforced concrete, prestressed concrete, steel and composite structures.
Impact factor by moment:
 (1)
(1)
Impact factor by shear:
 (2)
(2)
Since these formulae adopt the criteria of the Eurocode [3] without dedicated investigation relying on research results reflecting the domestic circumstances, thorough examination should be implemented on these criteria. To that goal, the impact factor of the high-speed railway bridge in Korea should be evaluated based on field tests. In this study, the impact factor is investigated after computation based on the dynamic displacement response measured on a high-speed railway bridge crossed by the first Korea high-speed train (KTX, Korea Train eXpress). The moving average method is applied to compute the impact factor using the measured dynamic response.
2. Application of Moving Average Method for the Computation of the Static Response
The impact factor is a factor multiplying the design live load so as to consider the dynamic impact effect during the static design and is obtained by Equation (3).
 (3)
(3)
where  = dynamic deflection of the bridge; and,
  = static deflection of the bridge.
Following, both static and dynamic deflections are necessary to evaluate the impact factor of the bridge. The static deflection corresponds to the response of the bridge when the train remains immobile on the bridge or crosses the bridge at speed slower than 5 km/hr. This means that the static response can practically not be obtained on a high-speed railway bridge in operation.
In this study, the static response is extracted from the dynamic response by the moving average method (Equation (4)).
 (4)
(4)
Figure 1(a) plots an arbitrary static response and the corresponding simulated dynamic response generated from the static response with various frequency contents. Since the vibrational amplitude of the dynamic response is generated according to time at the location of the static response, the static response can be approximated by removing the vibrational modulation from the average of the dynamic response obtained by the moving average method. In order to apply the moving average method, the number of dynamic signals required for extracting the static deflection shall be determined. Figures 1(b) and (c) show the static response extracted by the moving average method according to the change in the number of dynamic signals and the eventual agreement of this static response with the original one.
3. Field Riding Test on Yeonjae Bridge
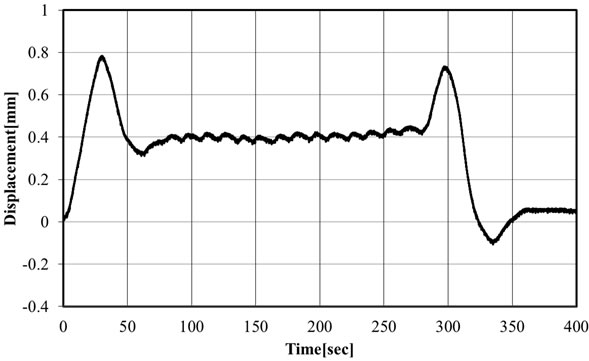
Since the train shall remain immobile or cross the bridge at speed slower than 5 km/hr to obtain the static deflection, measuring the static deflection on a bridge in service is practically unfeasible. This study used the static and dynamic data on a high-speed railway bridge subjected to KTX test run in other studies [4]. Static and dynamic deflection signals were measured under train speeds of 5 km/hr and ranging from 100 to 300 km/hr on Yeonjae Bridge located in the trial section of the Gyeongbu High-Speed Railway Line before its opening. The validity of the application of the moving average method is verified from comparison of measured static response and derived static response by moving average method. Yeonjae Bridge is 2-span continuous (2@40 m) PSC box bridge as shown in Figure 2. Since the maximum speed of the KTX train was 300 km/hr at the time of the test, monitoring was conducted for 8 different speeds ranging from 5 km/hr to 300 km/hr. The riding test was performed at identical speeds on the up and down lines. The bridge responses were measured using displacement gages and accelerometers installed according to the layout of Figure 3. The dynamic response used to compute the impact factor is the deflection of the slab at the center of the rails in the riding direction of the train. Figure 4 plots the time histories of the deflection measured on the Yeonjae Bridge under the crossing of the KTX train riding at speed of 5 km/hr and 200 km/hr on the down lines.
Table 1 lists the peak deflection of the slab per speed of the train. The deflection measured for the KTX train running at 5 km/hr is assumed as the static deflection of the bridge. In view of these data, the peak deflection was observed for the speed of 300 km/hr corresponding to the resonance speed of the KTX train. The static response is extracted by applying the moving average method on the dynamic signals measured for the KTX train riding at speeds from 100 to 300 km/hr. The number of data, N, is determined so that this extracted static response coincides with the static deflection measured at train speed of 5 km/hr. For the extraction, the responses corresponding to the cases where the dynamic displacement is smaller than the static displacement and the resonance speed are discarded.
Figure 5 compares the static response measured at train speed of 5 km/hr and the extracted static response per riding speed obtained by performing moving average while varying the number of data (N) sampled from the
 (a)
(a)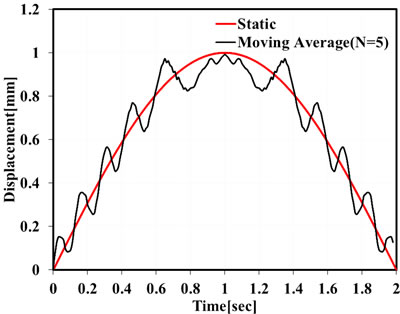 (b)
(b)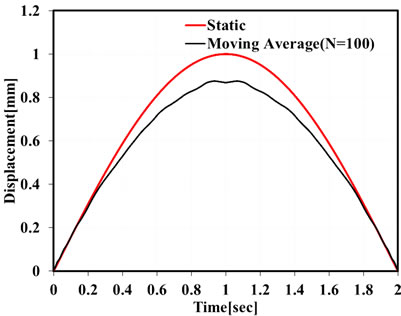 (c)
(c)
Figure 1. Moving average method: (a) Static and dynamic responses; (b) Computation of static response (N = 5); (c) Computation of static response (N = 100).
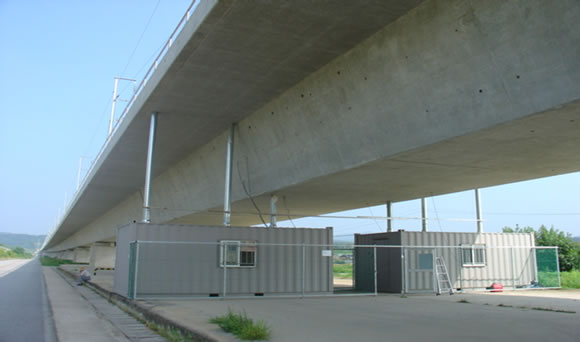
Figure 2. View of Yeonjae Bridge.

Figure 3. Sensor layout in Yeonjae Bridge.
dynamic response signals. The estimated static displacement appears to decrease with larger number N of data. The number of data necessary to estimate the static response from the dynamic data measured on Yeonjae Bridge should be determined so as to approximate the original static response. This number depends on the traveling direction and riding speed. For the down line, the minimum error is obtained for N = 50 at 175 km/hr and N = 20 at 250 and 275 km/hr. For the up line, the
 (a)
(a) (b)
(b)
Figure 4. Time histories of displacement of Yeonjae Bridge crossed by down KTX trains. (a) Down line (speed = 5 km/hr); (b) Down line (speed = 200 km/hr).
minimum error is achieved for N = 10 at 200 km/hr and N = 40 at 250 km/hr. This discrepancy according to the speed and direction of the train can be seen as limiting the applicability of the moving average method. Accordingly, this study determines the value of N so that identical number of data is necessary for the moving average calculation even when the speed varies and that the minimum error with the measured static response is achieved within the range of 10 to 50.
Table 2 arranges the error between the measured static deflection and the static deflection estimated by moving

Table 1. Maximum displacement in the test section of Yeonjae Bridge.
 (a)
(a) (b)
(b)
Figure 5. Moving average results for the dynamic responses of Yeonjae Bridge. (a) Up train; (b) Down train.
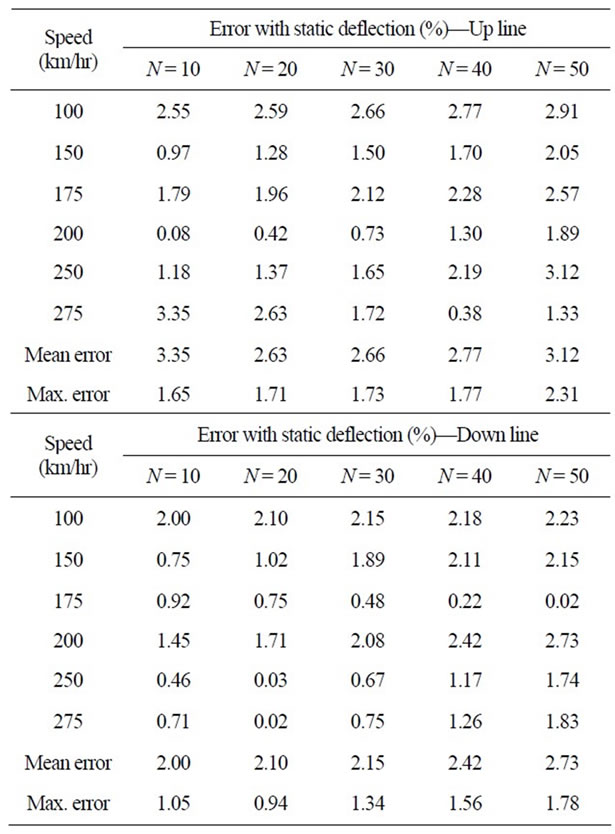
Table 2. Error with the static deflection according to varying number of data.
average while varying the number of data (N) as 10, 20, 30, 40 and 50. The smallest mean error of 2.63% is achieved for N = 20 in the up line. In the down line, the smallest mean error is 2.00% for N = 10 and the mean error reaches merely 2.10% even when N = 20. Consequently, N = 20 appears to be appropriate to extract the static response from the dynamic response by the moving average method so as to accommodate various types and riding speeds.
4. Computation of Impact Factor of Yeonjae Bridge Using Riding Trains
The evaluation of the impact factor of Yeonjae Bridge operating was conducted from field measurements. This study used the dynamic data on a Yeonjae Bridge in operating in other studies [5]. Train riding tests were performed in 2006 and 2007 and the corresponding data were analyzed. Figures 6 and 7 plot the values of the impact factor with respect to the static deflection. It can be observed that the impact factor decreases with larger static deflection. The analysis of the results of the riding test performed in 2006 reveals that μ = 0.0509 and COV = 0.707, for the results of 2007, μ = 0.0302 and COV = 0.6652. However, the average runs between 0.01 and 0.02 in case of large static deflection.
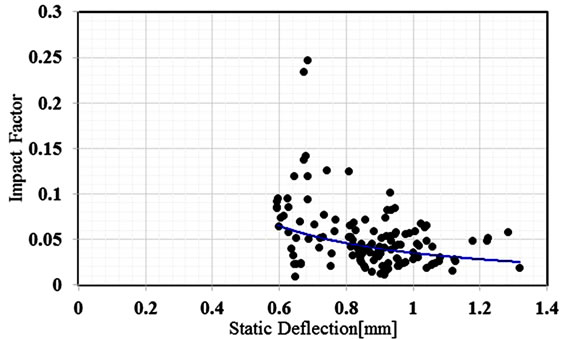
Figure 6. Riding test results of Yeonjae Bridge in 2006.
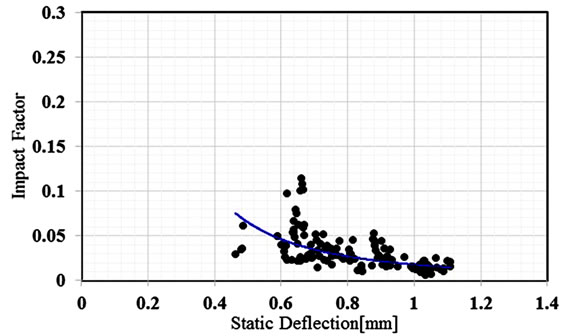
Figure 7. Riding test results of Yeonjae Bridge in 2007.
5. Conclusion
The high-speed railway bridge design code specifies to introduce the impact factor during the static design stage so as to account for the increment of the dynamic response caused by the crossing of the high-speed train through the increase of the static load. This study evaluated the impact factor criterion based on the Eurocode by estimating the impact factor from field monitoring. The validity of the estimation of the static response by applying moving average on the dynamic response was examined to secure the static load required for the computation of the impact factor. The examination revealed that 20 data would be appropriate for the extraction of the static response by the moving average method using the bridge signals obtained during the trial riding tests performed on Yeonjae Bridge prior to the opening of the Gyeongbu High-Speed Railway Line. Based on this result, the impact factor was computed by acquiring the dynamic response of Yeonjae Bridge crossed by actually operating trains. The impact factor was seen to decrease with heavier train that is larger static deflection. Moreover, the computed impact factor appeared to be extremely varying. The impact factor measured during the crossing of Yeonjae Bridge by the KTX train running at speed of 300 km/hr exceeded most of the limiting values. Since this study evaluated the impact factor for a single bridge, further studies should consider various bridge types to achieve valid and rational evaluation of the impact factor.
6. Acknowledgements
This research was supported by a grant from a Strategic Research Project (The Development of Design Core Technology on the Girder and Tethering System for Submerged Floating Bridge Construction) funded by the Korea Institute of Construction Technology and from Research Project (Research for the Improvement of Global Competitiveness in Railway Construction) funded by Korea Rail Network Authority.
REFERENCES
- Korea Railway Network Authority, “Design Specification of Railway,” Ministry of Construction Transportation, 2011.
- ERRI Specialists’ Committee D214, “Rail Bridges for Speeds > 2000 km/h, Final Report: Part B Proposed UIC Leaflet,” European Rail Research Institute, 1999.
- EUROCODE 1 Part 2, “Actions on Structures: General Actions—Traffic Loads on Bridges,” European Committee for Standardization.
- Korea Institute of Construction Technology, “Development of Safety Techniques for High Speed Railway Structures,” Ministry of Construction Transportation, 2002.
- Korea Institute of Construction Technology, “Development of Stabilization Techniques for Track Construction System of the High-Speed Railway,” Ministry of Construction Transportation, 2007.

