Engineering
Vol. 3 No. 11 (2011) , Article ID: 8664 , 8 pages DOI:10.4236/eng.2011.311140
Productivity Improvement Model without Increasing Operation’s Risk and Fatigue
1Industrial Engineering Department, College of Engineering, King Saud University, Riyadh, Kingdom of Saudi Arabia
2Al-Babtain Tower Factory, Riyadh, Kingdom of Saudi Arabia
E-mail: alshayea@ksu.edu, {atamimi, kalsaleh}@ksu.edu.sa, kaha-yami@al-babtain.com.sa
Received October 5, 2011; revised October 28, 2011; accepted November 5, 2011
Keywords: Risks, Productivity improvement, Optimization, Relaxation allowance, Fatigue, Standard productivity, Costs
ABSTRACT
Productivity improvement of an operation without increasing operation risk and operation fatigue that increase the needed relaxation allowance is an important subject in process design. This research subject stimulates researchers to focus on improving the productivity of the whole production process by changing the technique of performing significant operations in the process. However, two important issues that affect the implementation of any new technique were not considered in the pervious research works. These are the risk magnitude of the new technique on the workplace environment and the fatigue level that affect human's health. In this paper, a model was developed that maximize the productivity of the production process by selecting the best technique to perform significant process operations among proper candidate techniques that improve these operations productivity while minimizing these operations risk and fatigue.
1. Introduction
At the workplace, improvement of significant operations by changing the techniques of performing these operations improves the productivity of the whole production process. However, changing the techniques of performing process operations without considering the magnitude of the risk and the fatigue associated with the implementation of the new techniques could cause a danger to the inside and outside workplace environments and injuries or death to the workers.
In industry, each technique of performing process operation is accompanied with certain measurable magnitude of risk. This risk should be within acceptable limits set by the organization in order to accept the technique as a possible candidate to perform the operation. In addition, each technique is accompanied with certain level of fatigue that needs the necessary relaxation allowance in order to keep workers performance at stable pace. Furthermore, implementation cost and implementation time of each technique represent two important factors that complicate the process of selecting the best technique for performing the operation and that in turn will increase the productivity of the whole production process.
Management bodies in most organization realized the importance of increasing the work productivity as well as the importance of decreasing the risk and the fatigue associated with performing the work. Also, they understand that workers need a proper workplace with suitable environmental conditions to complete their tasks without any fatigue or risk. In addition, they realized that they need to do all of this with minimum cost acquired and minimum implementation time. Therefore, they search for a method to achieve all of the above needs.
This paper represents a contribution to this area of research. It concerns with developing a mathematical decision model that aims at improving the productivity of the production process by selecting the best techniques to perform significant operations without increasing the risk, the fatigue, cost and time associated with the implementation of the selected techniques.
2. Productivity Improvement
Productivity improvement stimulates researchers to search for methods that can achieve the increase in the productivity which in turn supports business main objectives. In this field of research, many researchers focused on improving process rather than employee performance in order to get more gains in productivity [1-4]. One of these researchers was Yung [5] who developed a new method to improve the manufacturing process productivity based on rearranging the sequence of tools and techniques by considering the coordination of information flow and selecting only the suitable tools for the specialized problems. The goal of the method was achieved but still there are some factors affecting the workers performance. Radharamanan et al. [6] and Huang et al. [7], also, did not consider the factors affecting the workers performance. Radharamanan et al. [6] applied Kaizen philosophy for continuous improvement and to develop the products with higher quality, lower cost, and higher productivity that meet the customer requirements whereas Huang et al. [7] applied effectiveness metric and simulation analysis for improving manufacturing productivity.
In addition to these efforts, Andris and Benjamin [8] used the intimate relationship between four techniques and they proposed an integrated model that shows significant improvement on both quality and productivity of the product and process. The techniques used are Statistical Process Control (SPC), the seven basic tools (histogram, check sheet, cause-and-effect diagram, control chart, Pareto Chart, flow process chart, scatter diagram), KAIZEN (Japanese term of continuous improvement), and Total Quality Management (TQM) principles. However, the main drawback of their model is that SPC, KAIZEN and TQM are very time-consuming and bulky methods.
In the same respect, Mefford [9] developed a new paradigm of production which provides a solution to the productivity challenge. The new paradigm is both a philosophy of management and a set of methods that draw upon the experiences of firms employing quality management and lean production. However, there is no consideration for employee performance in their paradigm. Kuhlang et al. [10], also, focused only on improving production process when they introduced methodical approach connects Value Stream Mapping (VSM) and Methods-Time Measurement (MTM) and offers new distinct advantages to reduce lead time and increase productivity based on lean principles and standardized processes.
Seidel and Arndt [11], also, introduced a new methodology for productivity improvement based on systems engineering principles. The core of their approach is a systems model that is based on matrices of productivity factors and organizational maturity factors that are derived from which individual levels of productivity may be determined and strategies for productivity improvement identified. In the same track, Gunasekaran et al. [12] found out that most firms are interested in a strategic approach for improving productivity and quality in their organizations. Therefore, they attempted to provide a strategic framework for such efforts. The main focus of their paper is on integrating various functional groups of a manufacturing organization and highlighting the role of new manufacturing concepts and technologies in such integrations.
Maruta [13], in his paper, deals with the productivity improvement of knowledge work. He points out that knowledge is created through the knowledge worker’s mental activity involving the interaction of three important factors, i.e., information, knowledge and insight. He claimed that knowledge workers can augment their capability to exploit knowledge and information through their personal learning efforts and/or through access to appropriate external knowledge and information sources. He conferred that insight is the key for knowledge creation and it has a special nature different from the other two. He stated that the special nature of insight is that it cannot be acquired through learning, but can become usable by activating undeveloped portions of native capabilities. In order to substitute for inefficient conventional on-the-job trainings to nurture innovation workers, a Timed-PDCA concept is proposed in Maruta’s paper. Maruta [13] claimed that the use of the Timed-PDCA concept makes it possible to visualize the progressive status of knowledge work as well as on-going thoughts of workers, and also periodically to enforce the worker for seriously evaluating the current situation and revising the action plan towards the final goal. Maruta [13] concluded his paper by stating that the use of the TimedPDCA concept makes it possible to pursue productivity improvement in the current works including nurturing innovation workers concurrently.
This paper is a contribution in this field of research. It focuses on improving process productivity as well as worker performance. It proposes mathematical model that improves the productivity without increasing the risk and the fatigue that affects the worker performance by enabling the user to select the best technique that achieves this aim among set of candidate techniques.
3. Productivity Improvement Model (PIM) Formulation
The productivity improvement model formulation is based on considering all the necessary aspects for selecting the best techniques to perform significant operations that improve the productivity of the production process without increasing the risk, the fatigue, cost and time associated with the implementation of the selected techniques. The formulation of the model is arranged in such a way that selection process of productivity improvement techniques is performed while verifying the following:
1) Needed relaxation allowances are less than those of the current used techniques.
2) Associated risks are less than those of the current used techniques.
3) Funds required for implementing selected techniques are less than available fund.
4) Installation time for the selected techniques is less than the maximum allowable installation time.
5) Allowable payback period for selected techniques is less than maximum allowable payback period as per organization policy.
6) Savings from using selected techniques (or cost reduction) are in high level.
In the following subsections, the detailed formulation of the model and its aspects are described.
3.1. Indices
 Operation type
 Technique type
where:
 Number of operations
 Number of candidate techniques
3.2. Parameters
 Fund requirement for technique
 , at operation,
 Standard productivity at operation,
  (for the current technique)
 Standard productivity after using technique
 , at operation,
 Relaxation allowance at operation,
  (for the current technique)
 Relaxation allowance after using technique
 , at operation,
 Risk measured at operation,
  (total severity points for the current technique)
 Risk measured (total severity points) after using technique
  at operation,
 Annual savings after using technique
 , at operation,
 Minimum annual savings for operation,
 Minimum annual savings for the whole operations at the workplace
 Maximum available funds (or maximum budget) for operation,
 Maximum available funds (or maximum budget) for the whole operations at the workplace
 Payback period after using technique,
  at operation,
 Maximum allowable payback period as per organization policy at operation,
 Maximum allowable payback period as per organization policy for the whole operations at the workplace
 Time required to install technique
 , at operation,
 Maximum allowable installation time at operation,
 Maximum allowable installation time for all selected techniques
3.3. Variables
 Technique
  that is used to improve productivity at operation,
 .
.
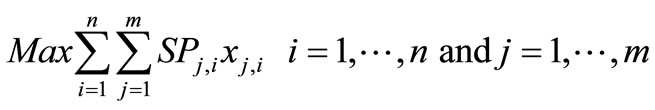
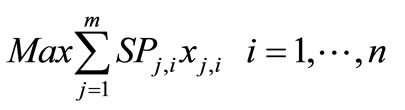
3.4. Model Objective Function
The model objective function is influenced by the aim of the model which is the improvement of the production process productivity without increasing the risk, the fatigue, cost and time associated with the implementation of the selected techniques. It deals with finding the best techniques that maximizing the productivity of the production operations and the whole production process.
 (1)
(1)
3.5. Model Constraints
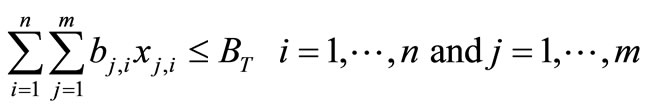
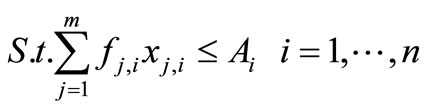
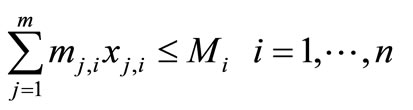
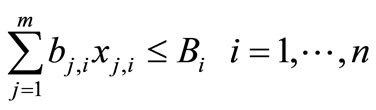
The model constraints represent the conditions that should be satisfied in order to achieve the model aim. The first constraint deals with the fund requirements for implementing the proposed techniques in order to obtain the maximum gains in the productivity at each operation. This fund should be within the maximum available fund provided by the production organization as illustrated in equation (2).
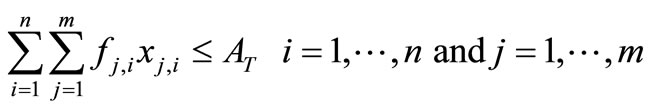 (2)
(2)
The second constraint deals with the installation time of the proposed techniques. This time should be less than or equal to the maximum available installation time allocated by production organization.
 (3)
(3)
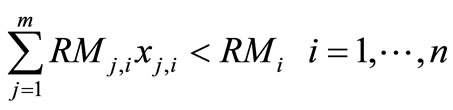
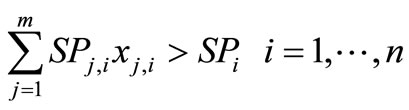
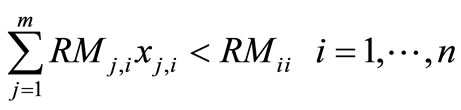
The third, fourth and fifth constraints deal with verifying that relaxation allowance of the proposed technique is less than the relaxation allowance of the current technique, the total productivity gains after installing the proposed technique should be more than the current total productivity, and the risks measured (total severity points) of the proposed technique are less than risks measured of the current technique. These constraints are represented by equations (4)-(6), respectively.
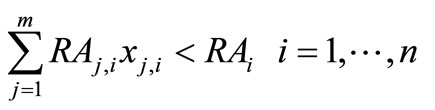 (4)
(4)
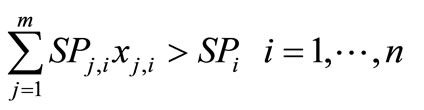 (5)
(5)
 (6)
(6)
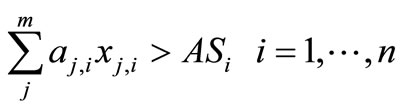
The sixth and seventh constraints deal with the average annual savings attributable to the proposed technique and the average payback period. The average annual savings attributable to the proposed technique should be greater than the required minimum annual savings and the average payback period should be less than or equal to the maximum budget and these conditions are represented by equations (7) and (8), respectively.
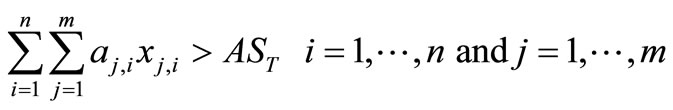 (7)
(7)
 (8)
(8)
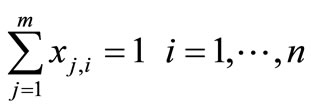
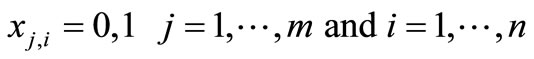
The last two constraints are incorporated in the model to verify that only one technique is selected and that the variable ( ) representing the proposed technique will have a discrete value of (1), if the technique, j, is selected and a discrete value, 0, otherwise.
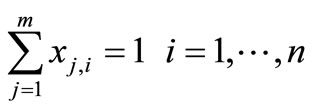 (9)
(9)
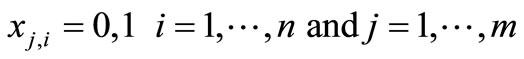 (10)
(10)
It is important to note that the aim of this model is to determine which technique should be selected so that the objective function is reached. Therefore, it does not matter if the technique is selected more than once. Moreover, such model is applicable for many applications (manufacturing, medicine, agriculture …etc). It can be run by several programs. One of those programs is AIMMS (Advanced Integrated Multidimensional Modeling, Version 8).
3.6. Productivity Improvement Model Formulation for Single Operation
Regardless of the number of operations, the proposed model will select the best technique for improving the productivity of a single operation as well as multi operations. The above model with some changes could be applied to improve the productivity of a single operation. The necessary changes in the model are on the objective function as well as on the first, second, sixth and seventh constraints. The model formulation is as follows:
 (1')
(1')
The objective function is subject to some constraints, which are as follows:
 (2')
(2')
 (3')
(3')
 (4)
(4)
 (5)
(5)
 (6)
(6)
 (7')
(7')
 (8')
(8')
 (9)
(9)
 (10)
(10)
4. PIM Model Implementation
The implementation of PIM model will help the administration in the production organization to decide which techniques should be selected to reach the maximum productivity without affecting the risk, the fatigue, cost and time associated with the implementation of the selected techniques. Implementation process of the PIM model requires data of each candidate technique and the production workplace in order to be carried out. In particular, it needs input data that is related to candidate techniques and production workplace budget, annual saving, installation time and implementation funds. This data is determined and given by the organization based on candidate techniques parameters and the organization business strategies, policies and desire. Also, the implementation process of the PIM model requires calculation of the relaxation allowance, the standard productivity, and risks for the candidate techniques. This data is considered as parameters for PIM model as described in table 1.
4.1. Calculation of Relaxation Allowance
Relaxation allowance is an addition percent to the basic operation time. It is intended to provide the worker with the opportunity to recover from the physiological and psychological effects of carrying out specified work under specified conditions and to allow attention to personal needs. The amount of allowance will depend on the nature of job [14]. Fifteen factors (variable allowances) will be evaluated for each candidate technique. However, there are two types of relaxation allowance, namely, constant allowances (e.g. personal and basic fatigue) and variable allowances (e.g. average force exerted, posture, vibration, short cycle and restrictive clothing, concentration, monotony, eye strain and noise, temperature, humidity, ventilation, fumes, dust, dirt and wet), which are endorsed by International Labor Office (ILO). Since the break time is given, the basic fatigue is only considered as the constant allowance and the value was given 4%, which is considered as adequate time for an operator who is doing light work [15]. This percentage will be added to the percentage of variable allowances to give the total relaxation allowance.
4.2. Calculation of Standard Productivity
After evaluating the relaxation allowance, the standard productivity of each candidate technique is ready to be calculated. The calculation process needs conducting performance rating of the worker who performs the operation and collecting observation time for all activities in the operation. Then, the following formulas are applied to find the standard productivity of the technique.
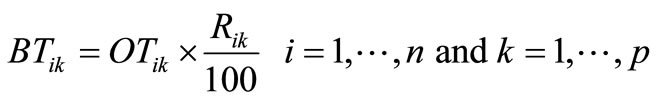 (11)
(11)
 (12)
(12)
 (13)
(13)
 (14)
(14)
where:
 peration type,
 ctivity type,
 umber of operations
 umber of activities
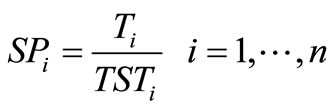
 Time available for operation,
 Observation time for activity,
  , in operation,
 Rating of worker on activity,
  , in operation,
 Basic time for activity,
  , within operation,
 Relaxation allowance for operation,
 Frequency for activity,
  , within operation,
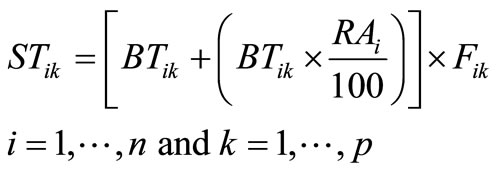
 Standard time for activity,
  , within operation,
 Number of parts per cycle in operation,
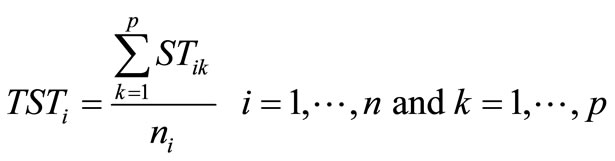
 Total standard time for operation,
 Standard productivity for operation,
This calculation is carried out for different operations in a single workplace. The same sequence is used for calculating relaxation allowance and evaluating productivity that will be gained from each candidate technique.
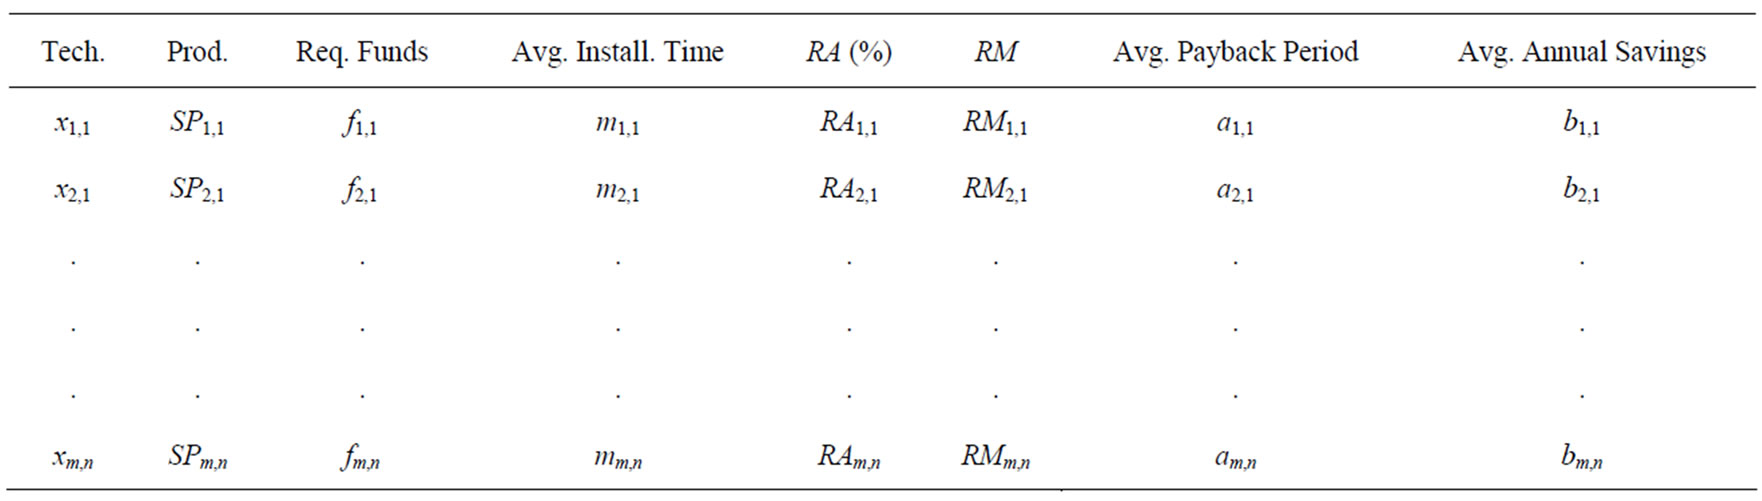
Table 1. Data Required for PIM Model.
4.3. Risk Calculation
A risk is combination of likelihood and consequences of a specified hazardous (potential harms in term of injury or ill) [16]. Therefore, each methods and techniques for carrying out production operations has its level of risk. However, most of risk assessment methods are based on the virtual judgment ant it is varied from person to another (e.g. probability or likelihood of hazard, its effect on person, financial losses …etc.). Hence, risk calculation method is based on calculating the severity points. For each technique, the severity points will be calculated based on the strain that imposed on the user after implementing such technique. Hence, for each element of work, there are physical strains resulting from nature of work, mental strains and physical or mental strains resulting from nature of working conditions. The application of this method is carried out to evaluate the risk (or collecting the severity points) for the selected technique and before implementing the technique at the workplace.
4.4. Objective Function Verification
The objective function can be verified with different parameters. For example, a sensitivity analysis using different upper limits can be used for various levels of budget (Ab) for a given set of productivity improvement techniques (xb,j) at each operation as shown in the table 1. So, the objective function can be verified with different budgets as shown in the table 2.
Similarly, the objective function can be verified with the maximum installation time, maximum payback period, maximum productivity or minimum risks at the workplace. Therefore, many alternative solutions can be obtained from the model. The most important issue in the verification process is to have the necessary input data based on high knowledge and experience of the candidate techniques.
5. Case Study
5.1. Problem Description
Every year, the administration of Al-Babtain tower factory is looking for increasing the factory productivity in order to cooperate with the market demand. At the same time, the workers who worked at Al-Babtain tower factory are very worried about the increase in the injuries. Some of these injuries were classified recordable as defined by the Occupational Safety and Health Administration (OSHA standard number 1904.7) whereas the remaining injuries required only first aid.
From the beginning of January 2006 to the end of December 2007, the administration of the factory tried several techniques to increase the productivity. The results were that the workers who worked in Al-Babtain tower factory had 108 injuries. Of those injuries, a total of 49 were classified recordable as defined by OSHA and the remaining 59 injuries required only first aid. An analysis of the archived injury data showed that 37% of the production department's total injuries in each year were caused by heavy lifting, awkward postures, and repetitive motion.
All production operations were evaluated based on the evaluation models to find the most problematic operations in terms of productivity and risks levels. Then, PIM model was used to select the best techniques for performing these operations that will increase the productivity without increasing risks levels, fatigue, cost and time associated with the implementation of these techniques. A set of candidate techniques were suggested that were predicted to make a positive change in the productivity and to reduce the risks levels with minimum cost.
The most problematic operations at the factory were two drilling operations, namely, operations 13 and 14. Several techniques were suggested. One of these techniques was rebuilding old machines in order to improve
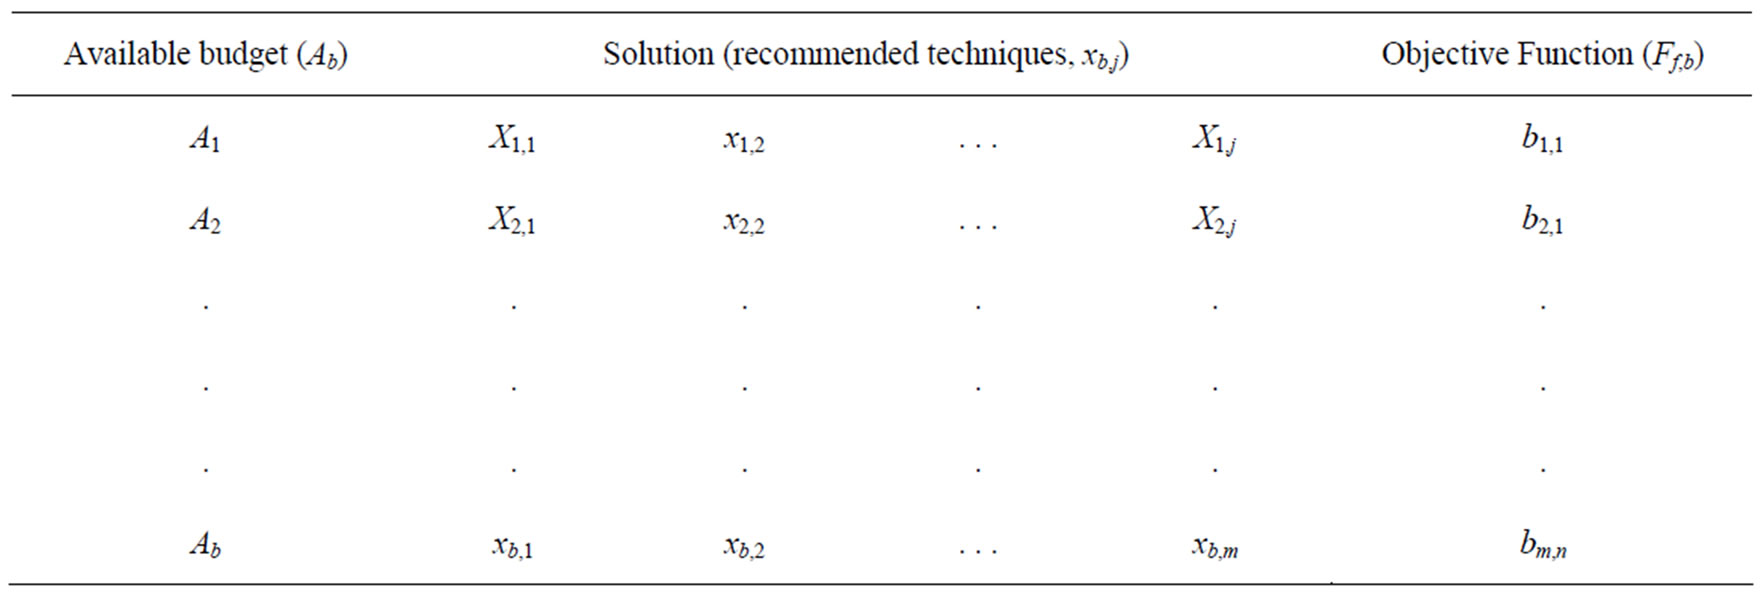
Table 2. Productivity improvement value for different budgets.
the productivity in the two operations. The second option was to purchase the new drilling machines. The last option was to replace those machines by several hand tools. The PIM model was used to select the best suggested candidate technique that will improve operation productivity and human’s health safety as well.
5.2. Collecting Data for Implementing PIM Model
Based on the approved quotations that have been finally selected for those three options, the cost for rebuilding the old drilling machines was SR 678,000 and SR 73,000 for operations 13 and 14, respectively. The cost of the new machines was SR 695,000 for each. The cost of the 12 hand drilling machines was SR 3750 for both operations. Factory administration set the budget of this project to be not more than SR 775,000. Also, the contract will be signed with a supplier to complete this task within three months. The current relaxation allowance for the targeted operations is 33% for each and the current productivity levels are 34 for operation 13 and 70 for operation 14, respectively. Also, the current severity points are 49 for each operation.
5.3. Results and Discussion
The result of the PIM model is that the best technique to use for improving the productivity for operations 13 and 14 at Al-Babtain tower factory without increasing risks levels, fatigue, cost and time associated with the implementation was rebuilding the old drilling machines. The objective function of the model has reached the maximum productivity and was valid with all constraints. The model showed that the standard productivity for operations 13 and 14 increased from current levels of 34 and 70 respectively to new standard productivity level after implementing the candidate technique of 35 and 73. Also, the risk levels have decreased by approximately 35% for operation 13 and 43% for operation 14. In addition, the model shows the following other important results:
1) Installation time and funds required for this technique is valid with the constraints. The cost of rebuilding the two machines is SR 751,000 which is less than the maximum allowable fund for both operations which is SR 775,000 and the technique is completed and tested within three months where it is verified and is acceptable by constraint (3).
2) Relaxation allowance percentage (excluding constant allowance) was decreased from 33% to 16% and 14% for operations 13 and 14, respectively. As a result, productivity was improved based on that the standard productivity increases by:
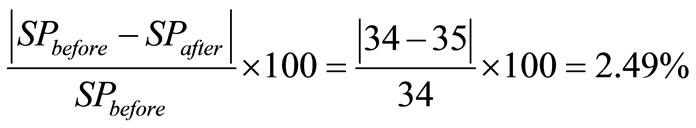
(For operation 13), and by
 (For operation 14)
3) The severity points were also dropped from 49 to 32 and 28 for operation 13 and 14, respectively. So, the value was valid with constraint (6). Therefore, the risk levels of both operations were reduced.
4) The payback period and annual saving were also validated by constraints (7) and (8). The selected technique has annual savings of SR 1.5 million and SR 0.15 million for operation 13 and 14, respectively when the rebuilding is implemented. These figures are greater than the minimum annual savings that was given for both operations. The payback period is 6 months and 5 months for operations 13 and 14 respectively which is less than the payback period that have been set by the factory administration.
The PIM model, as it is noticed, has been applied on two operations. However, the model could be applied to more than these operations which will help the company to select the optimal techniques that can lead to lean manufacturing.
6. Conclusions
PIM model is a decision tool for improving productivity without increasing the risk and the fatigue that affects the worker performance. It enables the user to select the best technique that achieves this aim with minimum cost acquired among set of candidate techniques. It has a feature of testing a set of candidate techniques in order to improve the workplace conditions that will give a positive value in productivity and health safety. It is based on workplace evaluation of standard productivity, relaxation allowance and risk measures to a set of techniques.
This model is to be used to give a good decision for selecting the candidate techniques necessary to carry out production operations. However, the overall picture of the results obtained from implementing the above model suggested that productivity improvement by implementing the candidate techniques is particularly sensitive to the effects of workplace safety and worker performance at the workplace. PIM model needs to be considered for more advanced issues such as testing a set of productivity improvement techniques at workplace to reduce other factors and improve the whole operations at the workplace. In particular, the implementation of the PIM model needs to consider other factors such as the failure rate, which requires an extension to the model formulation.
7. REFERENCES
- J. Fowler and J. Robinson, “Measurement and Improvement of Manufacturing Capacity,” SEMATECH, Inc, 1995.
- D. Sumanth, “Productivity Engineering and Management,” McGraw-Hill, New York, 1994.
- M. Oxenburgh and P. Marlow, “The Productivity Assessment Tool: Computer-Based Cost Benefit Analysis Model for the Economic Assessment of Occupational Health and Safety Interventions in the Workplace,” Journal of Safety Research, ECON Proceedings Paper, 2005, pp. 209-214.
- N. Van Hop, N. Sumate and N. Sitawatch, “Modifying Integrated Model for Manufacturing Process Improvement,” Proceedings of the International Conference on Simulation and Modeling, 2005, pp. 38-47.
- W. Yung, “An Integrated Model for Manufacturing Process Improvement,” European Journal of Operational Research, No. 61, 1996, pp. 39-43.
- R. Radharamanan, L. P. Godoy and K. I. Watanabe, “Quality and Productivity Improvement in a CustomMade Furniture Industry Using Kaizen,” Computers & Industrial Engineering, Vol. 31, No. 1-2, 1996, pp. 471- 474. doi:10.1016/0360-8352(96)00177-5
- S. Huang, J. Dismukes, J. Shi, Q. Su, M. Razzak, R. Bodhale and D. Robinson, “Manufacturing Productivity Improvement Using Effectiveness Metric and Simulation Analysis,” International Journal of Production Research, Vol. 41, No. 3, 2003, pp. 513-527. doi:10.1080/0020754021000042391
- F. Andris and N. Benjamin, “Method Standard and Work Design,” 11th Edition, McGraw-Hill, New York & London, 2004, pp. 335-348.
- R. N. Mefford, “Increasing Productivity in Global Firms: The CEO Challenge,” Journal of International Management, Vol. 15, No. 3, 2009, pp. 262-272. doi:10.1016/j.intman.2008.12.004
- P. Kuhlang, T. Edtmayr and W. Sihn, “Methodical Approach to Increase Productivity and Reduce Lead Time in Assembly and Production-Logistic Processes,” CIRP Journal of Manufacturing Science and Technology, in Press, 2011, Available Online. doi:10.1016/j.cirpj.2011.02.001
- R. H. A. Seidel and G. Arndt, “Productivity Improvement in Job Shop Production,” CIRP Annals—Manufacturing Technology, Vol. 37, No. 1, 1988, pp. 421-424.
- A. Gunasekaran, A. R. Korukonda, I. Virtanen and P. Yli-Olli, “Improving Productivity and Quality in Manufacturing Organizations,” International Journal of Production Economics, Vol. 36, No. 2, 1994, pp. 69-183. doi:10.1016/0925-5273(94)90022-1
- R. Maruta, “Transforming Knowledge Workers into Innovation Workers to Improve Corporate Productivity,” Knowledge-Based Systems, in Press, 2011, Available Online. doi:10.1016/j.knosys.2011.06.017
- R. Mayer, “Production of Operations Management,” 3rd Edition, McGraw-Hill, New York & London, 1975, pp 516-517.
- G. Kanawaty, “Introduction to Work Study,” 3rd Edition, International Labor Organization, 1993, pp. 140-381.
- S. Drozdowsky and S. Whittaker, “Workplace Hazards to Reproduction and Development: A Resource for Workers, Employers, Health Care Providers, and Health & Safety Personnel,” Washington State Department of Labor & Industries, 2000.