Engineering
Vol. 3 No. 8 (2011) , Article ID: 6830 , 8 pages DOI:10.4236/eng.2011.38104
Diagnosis on Surface Failure in Gear Equipment Using Time-Frequency Domain Analysis*
1Department of Intelligent Mechanical Systems Engineering, Kagawa University, Takamatsu, Japan
2NOK Co., Shiba Daimon, Tokyo, Japan
3Honda Motor Co., Ltd., Minami-Aoyama, Tokyo, Japan
E-mail: ohue@eng.kagawa-u.ac.jp
Received July 14, 2011; revised July 28, 2011; accepted August 5, 2011
Keywords: Gear, Diagnosis, Wavelet Transform, Surface Failure, Pitting, Vibration
ABSTRACT
In order to discuss the health monitoring method using time-frequency analysis on the vibration of gear sets, the fatigue test employed for a steel gear pair was carried out using a power circulating gear testing machine. Furthermore, the dynamic characteristics of both steel and sintered gears were measured using a power circulating gear testing machine and were analyzed in a time-frequency domain by the continuous and discrete wavelet transforms. In the case of the failure at the dedendum surface of driven gear, not only the vibration of the gear sets but also the condition of tooth meshing would have to be taken into consideration to diagnose the failed teeth.
1. Introduction
In order to make more progress in the gear performance, it is important to evaluate the gear dynamics more precisely, since gear is a main machine element in motion and power transmissions. For preventing the unexpected failure in mechanical systems, a large amount of work has been carried out based on a statistical model developed by Lundberg and Palmgren [1] with reliability models using the classical fatigue theory. However, most of these works did not consider the operating conditions of machine during the fatigue process.
Generally, the gear dynamic performance has been analyzed using Fast Fourier Transform (FFT) as a function of frequency. However, it is difficult to identify an instantaneous change of signals. In many health monitoring applications, it is more useful to analyze how measurement characteristics change as a function of both time and frequency. The Wavelet Transform (WT) is a method for the time-frequency analysis of signals [2,3]. The WT involves decomposing a signal into a representation comprised of local basis functions called wavelets. Each wavelet is located at a different position on the time axis and is local in the sense that it decays to zero when sufficiently far away from its center. The structure of a non-stationary signal can be analyzed in this way with local features represented by closely-packed wavelets of short length. Therefore, the WT can provide more beneficial information about the frequency compared with the FFT. By reason of the advantage on the WT, the applications of the WT to the diagnostics of the gear sets have been studied [4-7]. Their studies have focused mainly on whether some kinds of the WTs can provide the information to detect the fault of the gear system. However, it is also important to diagnose the failure of the gear sets using not only the WT but also the tooth meshing of the gear pair. Considering the tooth meshing of the gear pair would enable to construct the new diagnosis for the gear sets, which is different from the conventional diagnosis.
In order to evaluate the dynamic characteristics of gear pair, the dynamic performance of sintered and steel gears were measured using a power circulating gear testing machine. The dynamic characteristics were analyzed in a time-frequency domain by the continuous WT, and also those signals were decomposed and reconstructed by the discrete WT. The validity of the new evaluation method by the WT was discussed. Furthermore, in order to perform the health monitoring of the gear sets, a gear fatigue test was carried out and the dynamic characteristics during the fatigue test were measured and discussed by using the WT.
2. Wavelet Transform
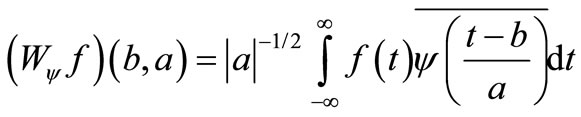
The Wavelet Transform (WT) has been extensively developed. Applications of the WT are actively studied in a variety of fields in engineering [4-9]. The Continuous Wavelet Transform (CWT) of a function f(t) is defined as follows.
 (1)
(1)
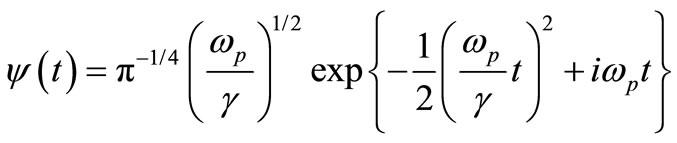
where, the bar over ψ(t) indicates the conjugate of a mother wavelet function ψ(t), a and b indicate the parameters on frequency and time. The Gabor function defined by Equation (2) is adopted as the wavelet function ψ(t).
 (2)
(2)
where, ωp is a center of angular frequency, γ is a constant and was set at 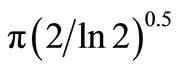 = 5.336 in this study. Figure 1 shows Gabor function based on sinusoidal waves eiωt and its Fourier spectrum.
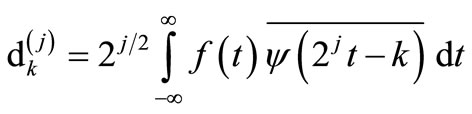
When the coordinates (b, a) of the CWT shown in Equation (1) are discretized to the coordinates (2-j k, 2-j) using two integers j and k, the Discrete Wavelet Transform (DWT) is defined as follows.
 (3)
(3)
where,  is equal to (Wψ f)(2-jk, 2-j). j is called level. The Inverse Discrete Wavelet Transform (IDWT) is defined as
 (4)
(4)
The function gj(t) on the wavelet component is given by
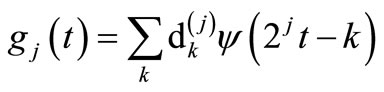 (5)
(5)
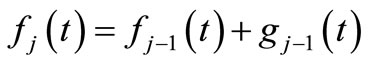
Suppose that fj(t) is the function at a level j, fj(t) is satisfied with the following relation.
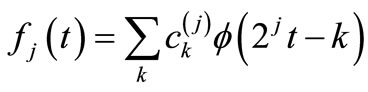 (6)
(6)
where,  is a sequence at a level j, and
  (t) is a scaling function. The scaling function
  (t) and the mother wavelet function ψ(t) are satisfied with the two-scale relations as follows.
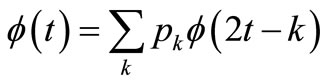 (7)
(7)
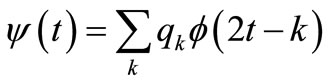 (8)
(8)
where, {pk} and {qk} are two-scale sequences. The functions gj(t) and fj(t) at a level j are able to be found by using Equations (5) and (6). The function fj(t) decomposed into the function gj(t) on the wavelet component is satisfied with the following relation.
 (9)
(9)
In this study, the scaling and the mother wavelet functions based on the cardinal B-spline function in order of m = 4 was adopted. The cardinal B-spline function Nm(t) in order of m is defined as follows.
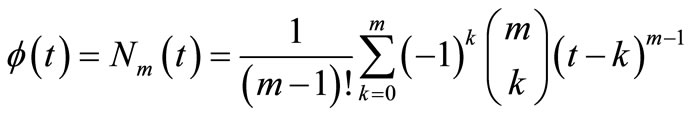 (10)
(10)
Figure 2 shows the scaling function  (t) and the mother wavelet function ψ(t) based on the function N4(t). The sequences {ak}, {bk}, {pk} and {qk} are given in Reference [2].
3. Dynamic Characteristics of Gear
3.1. Test Gear and Testing Machine
Table 1 shows the specifications of gear pair employed in this dynamic performance test. The module is 5 mm and the pressure angle is 20 deg. The test gears are
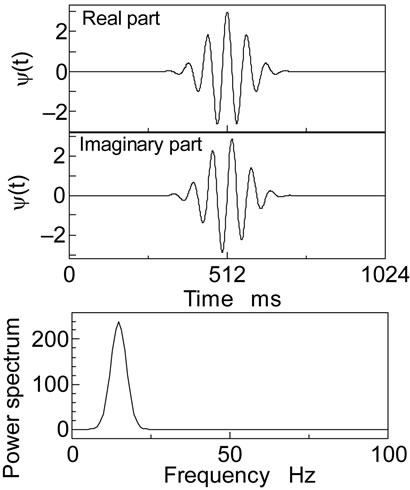
Figure 1. Gabor function.

Figure 2. Scaling and wavelet functions based on Cardinal B-spline in order of 4.
induction-hardened sintered and chromium molybdenum steel (JIS: SCM440) ones. The mating pinion is casehardened steel (JIS: SCM415) one. Generally, the sintered materials have higher damping ratio due to the pores, comparing with the steel ones. The density of the sintered gear is 6900 kg/m3 [10]. The Young’s modulus and Poison’s ratio of the sintered gear were 152 GPa and 0.25, and those of the steel gear were 206 GPa and 0.3, respectively.
The test apparatus shown in Figure 3 is a power circulating type gear testing machine with a center distance of 82.55 mm. The test gear was driven within a range of rotational speed n2 of 1600 rpm to 10,000 rpm. The load to the gear pair was statically applied by twisting the gear shaft using a loading lever with dead weights and by fixing using a torsion coupling. The value of the torque was 30 Nm. The lubricating oil was a gear oil with EP additives and was pressure-fed at an oil temperature of 313 K. The vibration acceleration of the gear box was detected by a piezo-electric pickup through an amplifier. The pickup has a maximum response frequency of 20 kHz. These signals were analyzed using a computer and a digital oscilloscope.
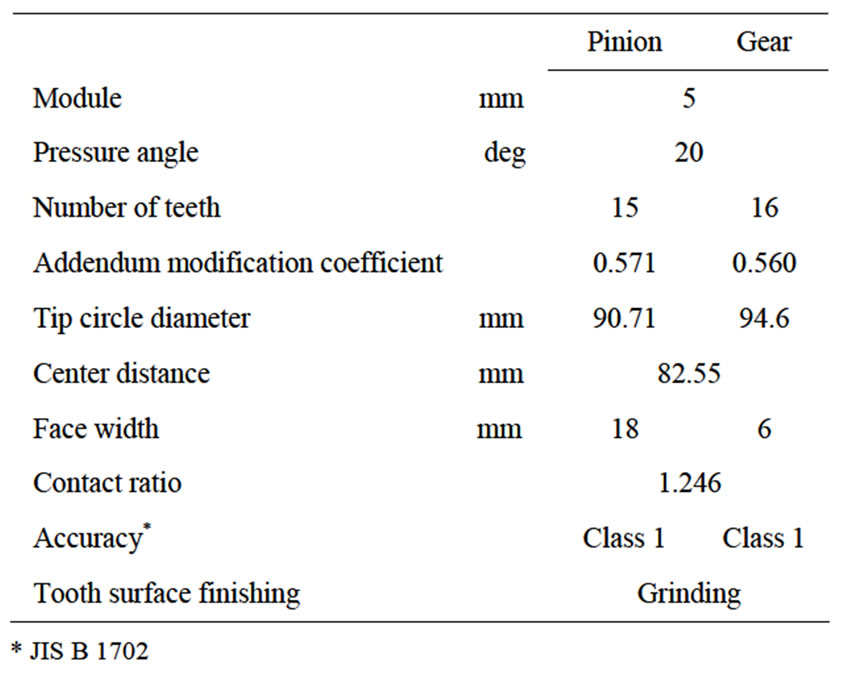
Table 1. Specifications of gear pair with a center distance of 82.55 mm.
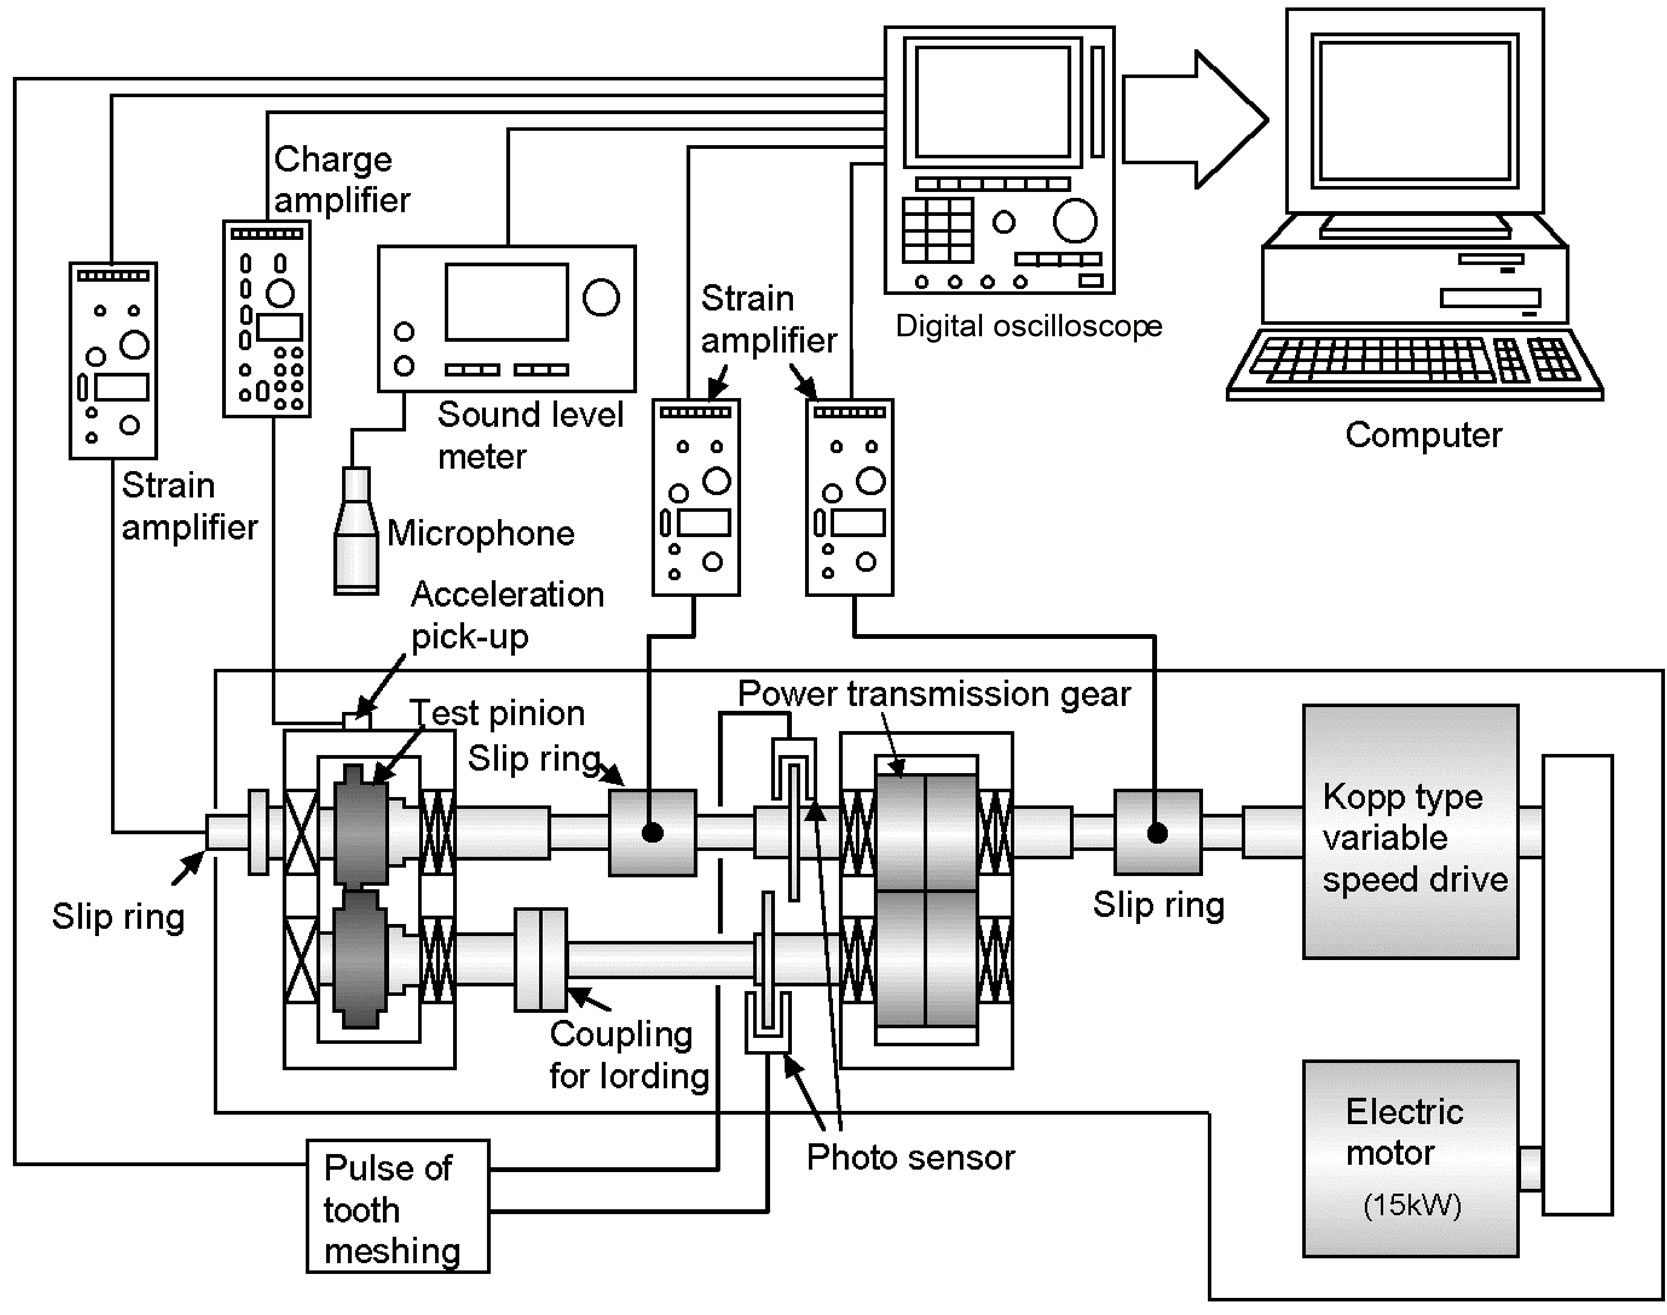
Figure 3. Power circulating gear testing machine.
3.2. Analysis of Gear Dynamics Using WT
Using the DWT and the IDWT, the vibration acceleration of the gear box was decomposed, and was reconstructed in two regions above and below fz. Figure 4 shows the results of the decomposed vibration acceleration of the gear box at n2 = 1800 rpm. The level j corresponds to the lower frequency, as the absolute value of j becomes larger. Each function gj(t) is the wave at each level j including the original wave f0(t). As the absolute value of level j became larger, the wave shape of fj(t) became smooth. In this case, level j < –5 corresponds to the frequency band below tooth mesh frequency fz, which is given by Equation (11) using n2 and a number z2 of gear tooth.
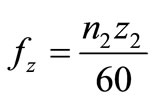 (11)
(11)
Figure 5 shows the root-mean-squares of the vibration acceleration plotted against n2. The increase in the vibration acceleration reconstructed in the region below fz is proportional to n2 to the power two, and is independent of the material of the gear. On the other hand, the vibration acceleration reconstructed in the region above fz for the sintered gear is smaller than those for the steel one. This tendency is the same as the behavior of the original vibration acceleration. The vibration due to the tooth mesh propagates to the gear box through shafts and bearings supporting the gear pair. The vibration of the gear box is caused by the torsional vibration of the gear pair due to the tooth mesh. The torsional vibration depends on the frequency components above fz, since the fluctuations of the vibration are caused by the frequency components above fz.
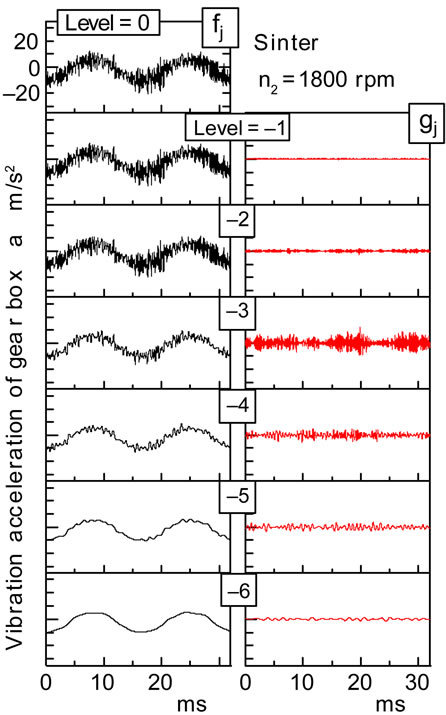
Figure 4. Example of decomposed vibration acceleration of gear box at n2 = 1800 rpm.
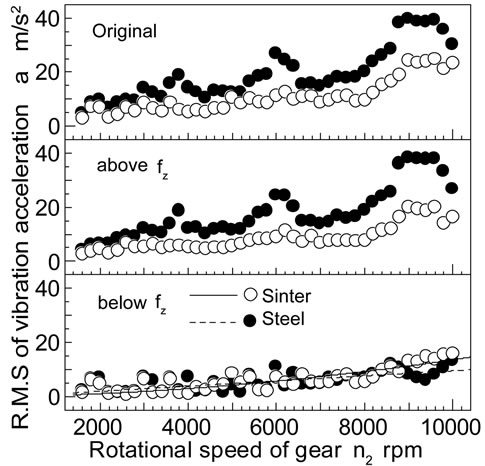
Figure 5. Root mean square of vibration acceleration above and below fz.
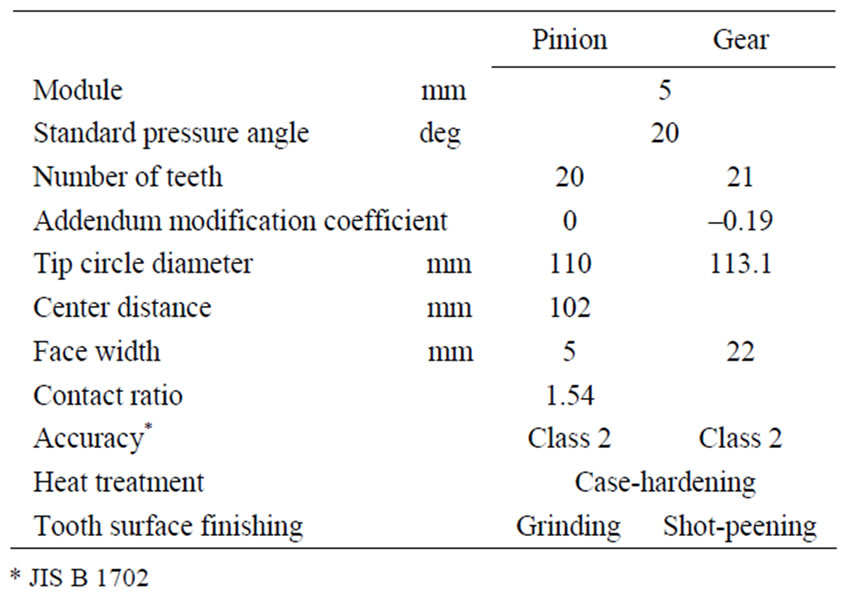
Table 2. Specifications of gear pair with a center distance of 102 mm.
4. Health Monitoring
4.1. Fatigue Test
In order to carry out the health monitoring of the tooth surface failure in gear sets, a fatigue test was performed by using the gear testing machine shown in Figure 3. Table 2 shows the specifications of the gear pair. The module is 5 mm and the pressure angle is 20 deg. The test gear pair is case-hardened chromium molybdenum steel one. The center distance of the test gear pair is 102 mm. The fatigue test was carried out at a rotational speed of 1800 rpm for the pinion.
Figures 6 and 7 show the tooth profile errors of the test gear pair and the observations of the tooth surfaces of the pinion tooth No. 1 and No. 11 during the fatigue process under a maximum Hertzian stress of pmax = 1850 MPa at the pitch point of the gear pair. The test pinion was failed by pitting at a number of fatigue cycles of N2 = 4.8 × 10⁶. At N2 = 0, before the fatigue test, the tooth profiles of both the gear and the pinion are considerably smooth. As the number of stress cycles increases up to N2 = 1.0 × 10⁶, the dedendum tooth of the pinion wears due to the interference between the dedendum tooth of the pinion and the mating gear. While, at N2 = 2.0 × 10⁶, the tooth profile of the pinion tooth No. 11 changes at the dedendum tooth. This change of the tooth profile depends on the pitting shown in Figure 7. Finally, the maximum tooth profile error of the pinion tooth No. 11 reaches about 400 μm. However, the tooth profile error of the pinion tooth No. 1 is only about 20 μm. The maximum tooth profile errors of pinion having 20 teeth, at each fatigue stage. Each tooth profile error is less than 40 μm up to N2 = 1.0 × 10⁶. At N2 = 2.0 × 10⁶, the tooth profile error of tooth No. 11 becomes larger than those of the other ones, and the values are about 150 μm. At N2 = 4.8 × 10⁶, the tooth profile errors of the tooth No. 11, No. 12 and No. 15 become larger. The toot profile of the mating gear during the fatigue test does not change remarkably.
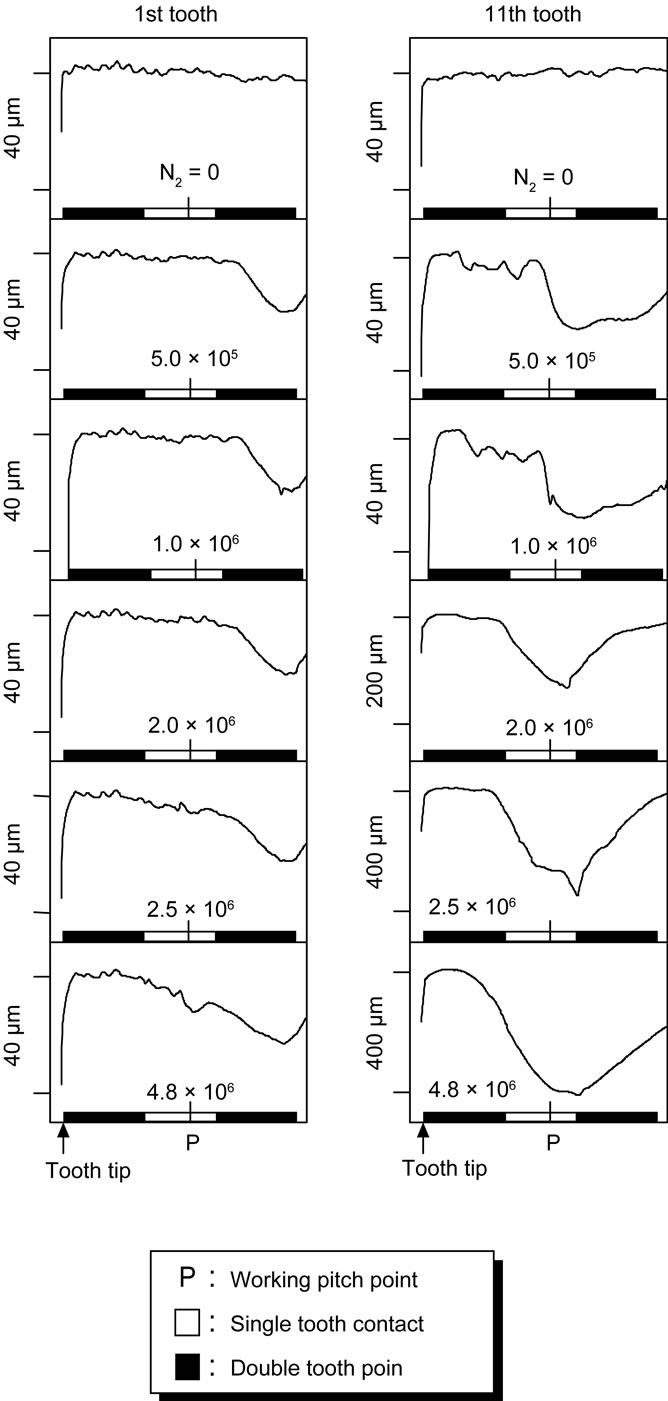
Figure 6. Tooth profile error of pinion during fatigue test: (a) Pinion tooth No. 1; (b) Pinion tooth No. 11.
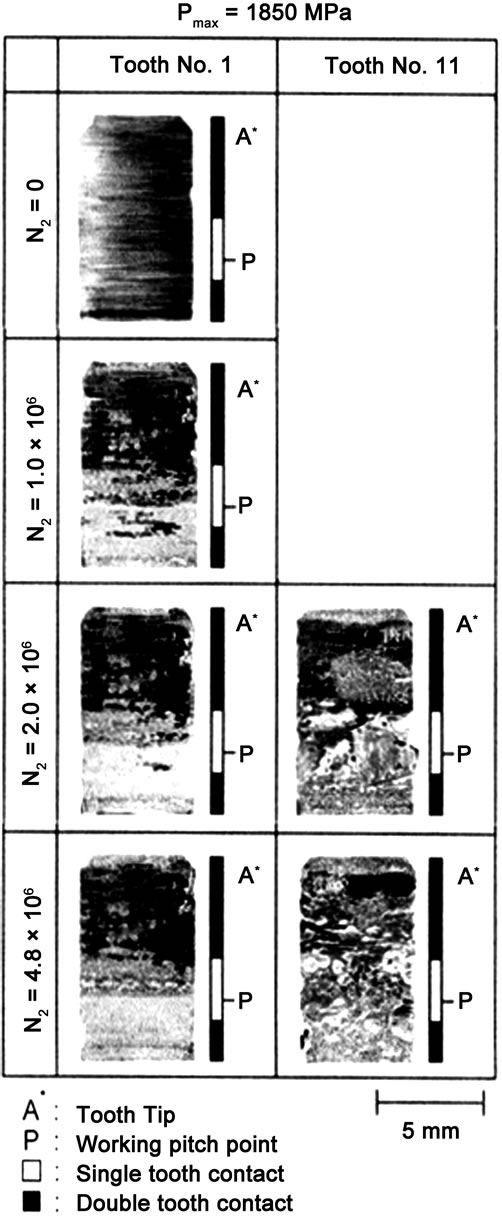
Figure 7. Observation of pinion teeth.
4.2. Health Monitoring
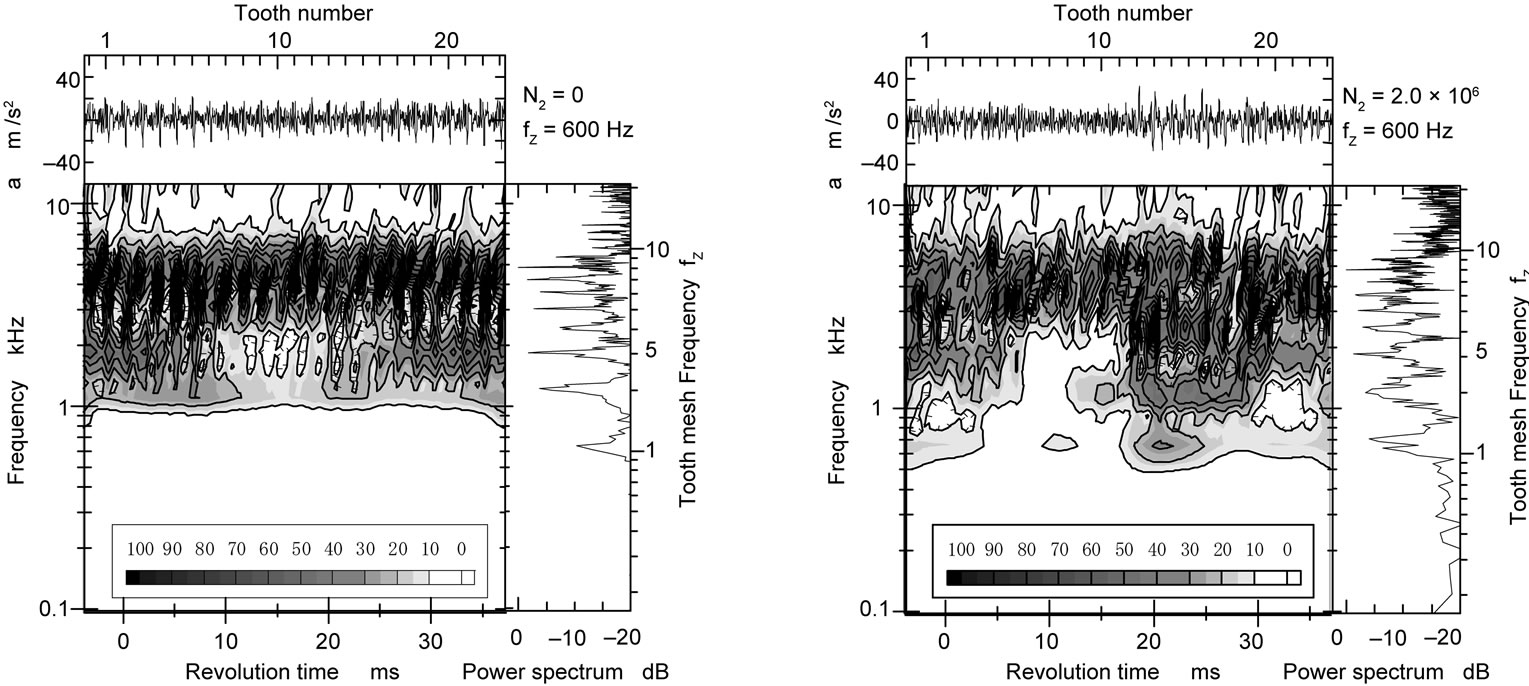
Figure 8 shows the vibration acceleration of the gear box, its WT map and FFT spectrum at (a) N2 = 0 and (b) N2 = 2.0 × 10⁶. In this fatigue test, the tooth mesh frequency fz is 600 Hz. At both the fatigue stages, it is difficult to diagnose the tooth surface failure only by the vibration acceleration waves. Comparing the FFT spectrum at N2 = 2.0 × 10⁶ with that at N2 = 0, it is understood that the tooth surface failure occurred at N2 = 2.0 × 10⁶, since the intensity of the frequencies except for tooth mesh frequency fz and its harmonic frequencies became larger at N2 = 2.0 × 10⁶. From the result of WT map at N2 = 0, it is understood that the intensities at tooth mesh frequency fz and its harmonic frequencies during the one rotation of the pinion are not constant but fluctuate against the time. At the moment when each tooth pair meshes, the intensities at the tooth mesh frequency fz and its harmonic frequencies increase. The WT map at N2 = 2.0 × 10⁶ shows that the intensities at tooth mesh frequency fz and its harmonic frequencies near the meshing of tooth No. 11 increase. It is considered that the changes in those intensities are caused by the deterioration of tooth No. 11 due to the surface failure (pitting).
The tooth profile deterioration caused the change of the intensities at tooth mesh frequency and its harmonic frequencies. Therefore, the health monitoring was carried out by the vibration acceleration having the component of tooth mesh frequency fz. The vibration acceleration having the component of fz can be calculated using DWT. Figure 9 shows the decomposed vibration acceleration of the gear box at (a) N2 = 0 and (b) N2 = 2.0 × 10⁶. The level j corresponds to the lower frequency, as the absolute value of j becomes larger. The vibration due to the tooth mesh propagates to the gear box through shafts and bearings supporting the gear pair. Therefore, comparing the decomposed result at N2 = 0 with that at N2 = 2.0 × 10⁶, the amplitude of the decomposed vibration acceleration near meshing of tooth No. 11 becomes larger. This result corresponds with the result of the WT map shown in Figure 8. However, since the discrete WT can provide the signal with the component of tooth mesh frequency, the discrete WT is superior to the continuous WT.
(a) N2 = 0 (b) N2 = 2.0 × 10⁶
Figure 8. Vibration acceleration of gear box , its WT map and FFT spect-rum during fatigue test.
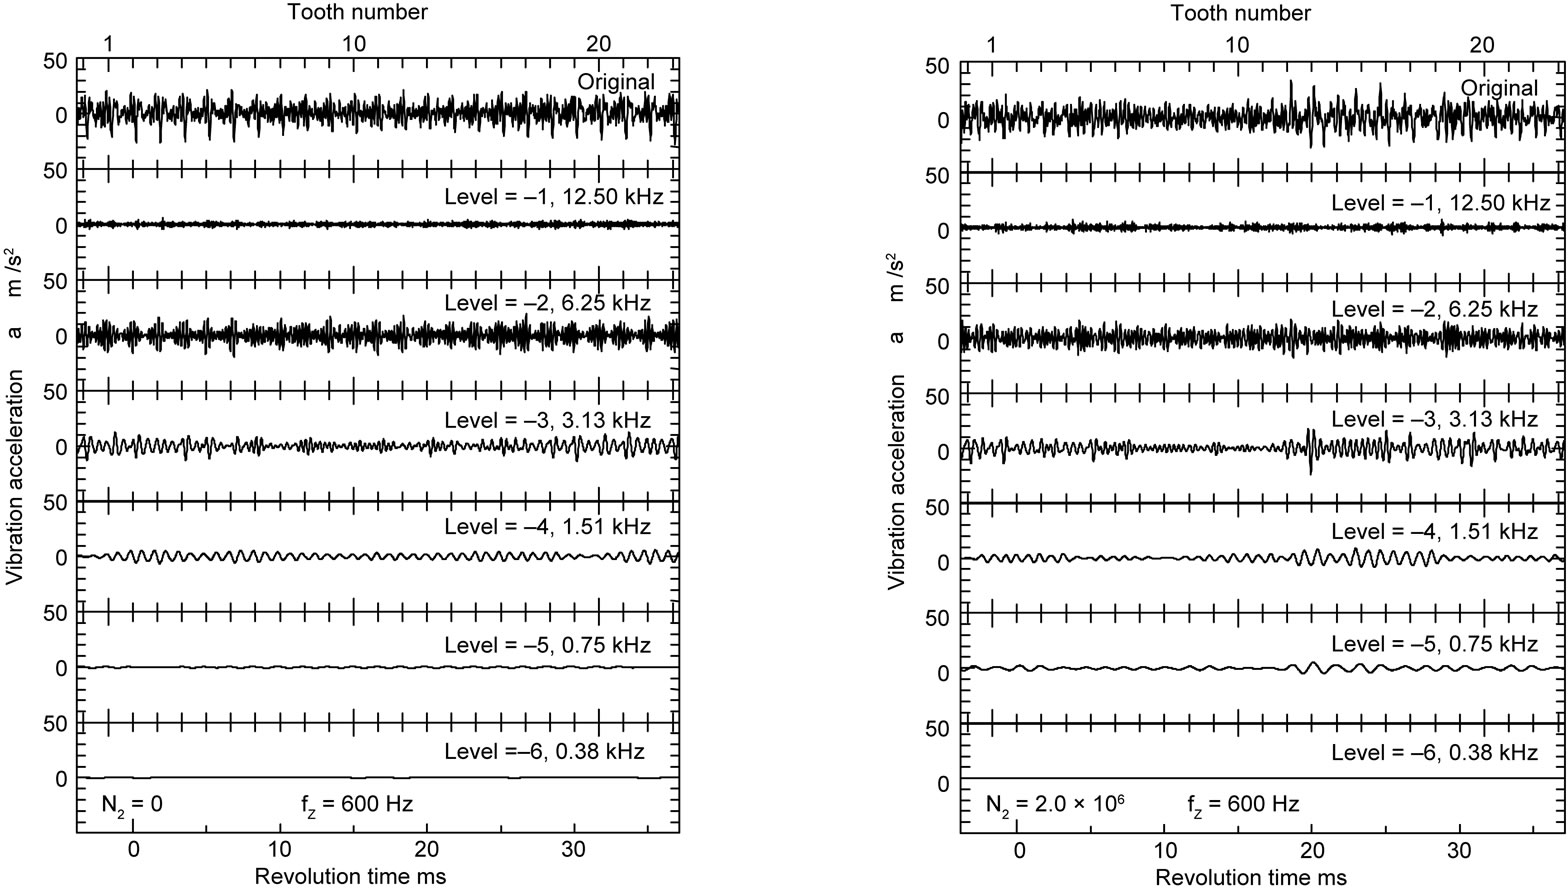
(a) N2 = 0 (b) N2 = 2.0 × 10⁶
Figure 9. Decomposed vibration acceleration of gear box during fatigue test.
Since the vibration acceleration of the gear box is caused by tooth meshing, the fundamental frequency of the vibration acceleration of the gear box is tooth mesh frequency fz. Therefore, the relationship between the vibration acceleration having the component of tooth mesh frequency fz and the maximum tooth profile error was investigated during the fatigue test. The relationship is shown in Figure 10. In this case, the vibration acceleration having the component of a frequency of 750 Hz was adopted since the tooth mesh frequency fz is 600 Hz. The tooth profile error of each tooth at N2 = 0 is less than those at N2 = 5.0 × 10⁵ and 1.0 × 10⁶. Therefore, the amplitude of the vibration acceleration having tooth mesh frequency becomes slightly larger from N2 = 5.0 × 10⁵ to 1.0 × 10⁶. The dedemdum surface of the tooth No. 11 was failed by pitting and the maximum tooth profile error of the tooth No.11 is larger than those of the other teeth at N2 = 2.0 × 10⁶. However, the amplitude of the vibration acceleration becomes maximum, not at the meshing point of tooth No. 11, but after the meshing point of tooth No. 12. The pitting failure in the pinion occurred at the tooth surface near the pitch point, but the addendum tooth surface of the pinion did not fail and was smooth as shown in Figure 6. When the driven pinion meshes with the mating gear, the tooth mesh starts from the addendum surface of the pinion. At the beginning of the meshing of tooth No. 11, the smooth dedendum surface of tooth No. 10 and the smooth addendum surface of tooth No. 11 mesh with each mating gear tooth.
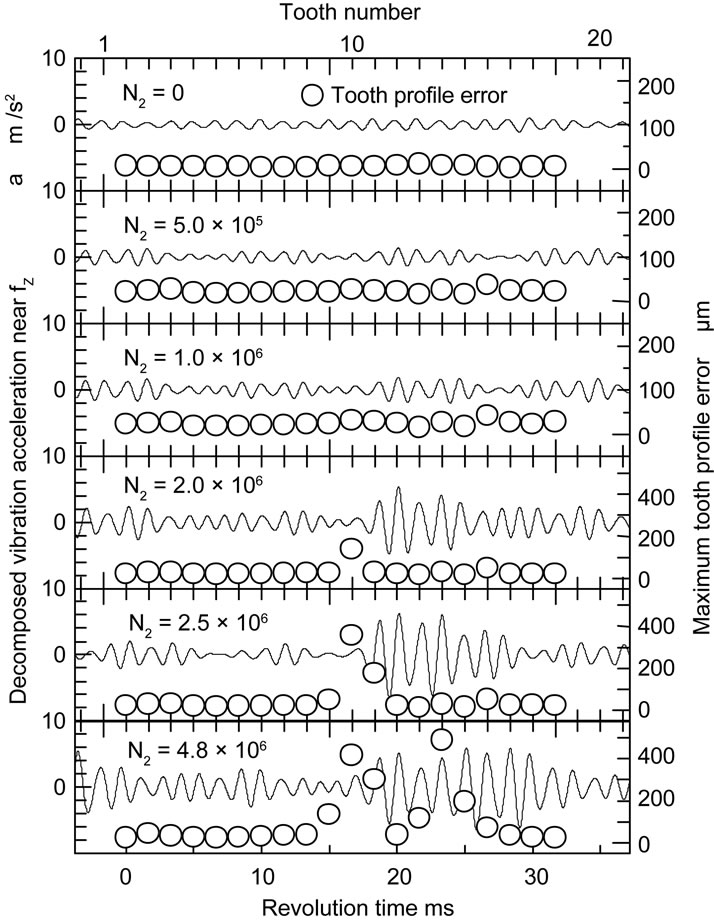
Figure 10. Relation between vibration acceleration and maximum tooth profile during fatigue test.
While, at the beginning of the meshing of tooth No. 12, the failed dedemdum surface of tooth No. 11 and the smooth addendum surface of tooth No. 12 mesh with each mating gear tooth. The above evidence indicates that the impact force due to the meshing of tooth No. 12 is much larger than that due to the meshing of tooth No. 11. Therefore, the amplitude at the meshing of tooth No. 11 is smaller than that at the meshing of tooth No. 12. In this case of the failure at the dedendum surface of driven gear, the amplitude of the vibration acceleration with the component of tooth mesh frequency became larger after the failed tooth meshing. Therefore, not only the vibration of the gear sets but also the condition of tooth meshing would have to be taken into consideration to diagnose the failed teeth. At N2 = 4.8 × 10⁶, since the teeth profiles of tooth No. 10 to No. 16 deteriorate comparing with the others, the amplitude of the vibration acceleration fluctuates widely during the meshing of those teeth. From the above result, the proposed method in this paper, which is to monitor the vibration with the component of tooth mesh frequency fz, makes it possible to discuss the health monitoring of the gear sets more precisely.
5. Conclusions
In order to evaluate the dynamic characteristics of gear pair, the dynamic performance were analyzed by the WT. The validity of the evaluation method by the WT was discussed. Furthermore, to perform the health monitoring, a gear fatigue test was carried out and the dynamic characteristics during the fatigue test were analyzed. The main results are summarized as follows.
1) The behavior of the vibration acceleration of the gear box against the rotational speed of the gear could be divided to two different behaviors above and below fz. The behavior of the vibration acceleration below fz was independent of the gear material and was proportional to the rotational speed to the power two. The behavior of the vibration acceleration above fz was influenced by the difference in the gear material.
2) A failed tooth by pitting could be found out by the intensity of the vibration acceleration having the tooth mesh frequency fz on the wavelet map during fatigue process. Furthermore, the wave shape of the vibration acceleration having the tooth mesh frequency fz could be analyzed using the discrete wavelet transform. The mesh condition of the gear pair with failed tooth could be gained from the amplitude of the vibration acceleration having the tooth mesh frequency fz.
3) The proposed method in this paper is to monitor the vibration of gear sets having the component of tooth mesh frequency fz using the wavelet transform, and evaluate the damage of the gear tooth from the change in the amplitude of the vibration having the frequency fz. In the case of the dedendum surface failure of driven gear, however, the vibration acceleration with the component of tooth mesh frequency became larger after the failed tooth meshing.
6. Acknowledgements
The authors would like to thank Sumitomo Metal Industries, Ltd. and Japan Energy Co. Ltd. for providing materials and lubricating oil. This research was supported by the Grants-in-Aid for Scientific Research of JSPS.
7. REFERENCES
- G. Lundberg and A. Palmgren, “Dynamic Capacity of Rolling Bearings,” ACTA, Polytechnica, Mechanical Engineering Series, Vol. 1, No. 3, 1947, p. 7.
- C. K. Chui, “Introduction to Wavelet,” Academic Press, London, 1992.
- S. Mallat, “A Wavelet Tour of Signal Processing,” Academic Press, London, 1998.
- W. J. Staszewski and G. R. Tomlinson, “Application of the Wavelet Transform to Fault Detection in a Spur Gear,” Mechanical Systems and Signal Processing, Vol. 8, No. 3, 1994, pp. 289-307. doi:10.1006/mssp.1994.1022
- W. J. Wang and P. D. McFadden, “Application of Wavelets to Gearbox Vibration Signals for Fault Detection,” Journal of Sound and Vibration, Vol. 192, No. 5, 1996, pp. 927-939. doi:10.1006/jsvi.1996.0226
- B. A. Paya, I. I. Esat and M. N. M. Badi, “Artificial Neural Network Based Fault Diagnostics of Rotating Machinery Using Wavelet Transforms as a Preprocessor,” Mechanical Systems and Signal Processing, Vol. 11, No. 5, 1997, pp. 751-765. doi:10.1006/mssp.1997.0090
- A. Yoshida and Y. Ohue, “A Study on Diagnosis of Tooth Surface Failure by Wavelet Transform of Dynamic Characteristics,” Proceedings of 5th International Tribology Conference in Australia, Brisbane, 6-9 December 1998, pp. 11-16.
- S. Qian and D. Chen, “Joint Time-Frequency Analysis,” Prentice Hall PTR, Upper Saddle River, 1996.
- Y. Ding, R. L. Reuben and J. A. Steel, “A New Method for Waveform Analysis for Estimating AE Wave Arrival Times Using Wavelet Decomposition,” NDT & E International, Vol. 37, No. 4, 2004, pp. 279-290. doi:10.1016/j.ndteint.2003.10.006
- A. Yosida, Y. Ohue and I. Karasuno, “Surface Failure and Durability of Induction-Hardened Sintered Powder Metal Rollers and Gears with Various Hardened Depths,” Transactions of the ASME, Journal of Mechanical Design, Vol. 116, 1994, pp. 730-737. doi:10.1115/1.2919443