Journal of Information Security
Vol. 3 No. 3 (2012) , Article ID: 21347 , 7 pages DOI:10.4236/jis.2012.33030
Feedback Reliability Ratio of an Intrusion Detection System
1Department of Computer Science and Engineering, College of Engineering Roorkee (COER), Roorkee, India
2Department of ICT, Atal Bihari Vajpayee Indian Institute of Information Technology and Management, Gwalior, India
Email: *ushaban@gmail.com, kvarya@iiitm.ac.in
Received May 18, 2012; revised June 14, 2012; accepted June 21, 2012
Keywords: Attacks; Canberra Metric; Feedback; Intrusion Detection; Performance; Reliability
ABSTRACT
The behavior and nature of attacks and threats to computer network systems have been evolving rapidly with the advances in computer security technology. At the same time however, computer criminals and other malicious elements find ways and methods to thwart such protective measures and find techniques of penetrating such secure systems. Therefore adaptability, or the ability to learn and react to a consistently changing threat environment, is a key requirement for modern intrusion detection systems. In this paper we try to develop a novel metric to assess the performance of such intrusion detection systems under the influence of attacks. We propose a new metric called feedback reliability ratio for an intrusion detection system. We further try to modify and use the already available statistical Canberra distance metric and apply it to intrusion detection to quantify the dissimilarity between malicious elements and normal nodes in a network.
1. Introduction
Nowadays the risk of attacks in data networks is exponentially rising. Thus, the area of network security is gaining importance for researchers and practioners. Attack could be either from outside or from the inside of a network. Further compared to wired networks, mobile ad-hoc networks have several disadvantages with respect to security the most important being the dynamic nature of such networks. In such networks node act as routers and participate in the routing process following some routing protocol. Till date several routing protocols have been formulated for such networks. However, attackers have been always successful to penetrate and harm such networks. Attacks have been classified by several researchers [1] based on the behavior of attacks. Attacks might be internal or external [2]. External attackers try to hamper network performance using any one of the technique like eavesdropping, message intercepting, replay etc. However, the problem is more severe in case of an internal attacker [3] and thus in such a situation the task to detect the misbehaving node becomes daunting. A single intruder can manage to create havoc in a network. This is referred as an intrusion in the system, where a node or malicious element from within a network tries to hamper the normal functioning of the network. To resolve this cumbersome task various Intrusion Detection Systems (IDS) have been developed, which uses different techniques to identify threats in a network. All the available algorithms are based on some assumptions and consider some measure which determine the misbehaving nature of a node. Different approaches are used to determine an intruder in a system, with every approach having its own merits and demerits [4]. One of the approaches used in intrusion detection system maintains a pre-defined knowledge of intrusion with it. Every time an abnormal activity is encountered, this predefined list of intrusions is checked for a match. But this type of technique can determine only a specified number of intrusions. While this list for intrusions can be updated from time to time, but this static approach known as signature-based intrusion detection [5], is not considered an efficient approach for real time network systems. Another approach used for the detection of misbehavior of an insider node considers a measure in which a threshold value is set on the basis of normal activities. Then value of the measure is determined for the node considering all of its parameters. If this calculated value shows some deviation from the threshold value, then the node is declared as an intrusion for the system. This kind of approach known as anomaly based detection helps in detecting new threats introduced in the network. Similarly, various other intrusion detection systems are available, but there is no particular measure available which can successfully rank these presently available IDS on the basis of their capability and performance.
In this paper, a novel approach has been proposed which can predict the performance level of an Intrusion Detection System on the basis of its activities recorded for a particular interval. For this purpose, real time data packets information are captured on a network of both types: pure network data, and data containing various attacks. A statistical approach is adopted in this proposal, known as Canberra metric. Canberra Metric is used to determine dissimilarity between different groups of elements based on various parameters.
Prior Work
Various attempts have been made in the past to define a reasonable measure which can measure the level of trust for an IDS such that the reliability of an IDS can be calculated and a confidence level can be defined for a particular network. The biggest problem that is yet to be resolved is to decide the key factors to be taken into account for describing and analyzing the performance of an IDS. Various options like false positive, false negative, number of packets observed, number of detections, cost of the maintenance, confidence value etc. have been proposed by researchers. Numerous techniques and methodologies have been adopted by researchers to illustrate and benchmark an IDS.
In [6] a survey of IDS technologies available have been analyzed and the authors have proposed an evaluation scheme which considered false positive rate, false negative rate, vulnerability etc. as the key dimensions of an intrusion detection system. And showed that these parameters are to be taken into account to analyze and improve the quality of Network IDS. [7] proposed a new measure metric called Intrusion Detection Capability, which considered ratio of the mutual information between the IDS input and output to the entropy of the input and proved it to be a better measuring tool to determine the capability of an IDS. The authors in [7] showed an analysis comparing previously available cost-based approaches and the proposed metric results in a scenario.
The authors in [8] summarize and present a few test cases to demonstrate various evaluation environment methodologies. A new technology has also been proposed with open source environment which is based on both Artificial Intelligence and real network traffic data. The approach included injecting artificial attacks in the isolated test environment to realize the capability of a system. A similar approach has been adopted by the authors in [9] in which a TCL script is executed in a set environment a TELNET environment and can reveal important information about an IDS and capabilities.
Benchmarking an IDS is not a fully evaluative task and cannot be accomplished by applying some logical technique. Hence, no perfect evaluation methodology has been developed so far to analyze an IDS to be installed on a system [10]. Approaches adopted so far lack depth in one or in another aspect and need some modification looking at the challenges present in real environment at present scenario [11]. Some of those challenges faced in the real-time network are: 1) ever increasing network traffic; 2) the use of encrypted messages to transport malicious information; 3) use of more complex, subtle, and new attack scenarios and many more.
[12] presented a brief description comparing different avail able approaches to evaluate the performance of an Intrusion Detection System. This article concluded on a note that there is lot of scope for further research in this field, as the best suitable approach is yet to be discovered. In this paper, a statistical approach has been proposed to untie the node of the problem explained above. This paper aims at presenting a metric based solution for the evaluation and analysis of the performance and reliability of an IDS. And provide a tool to network intrusion detection system analyst with a tool, which can be used to judge an IDS before installing it on a system. And predictions can be made for IDS regarding its reliability and trust level of its detections and security of data. [13] has previously shown that Canberrra and Chi Square are metrics which could be used in intrusion detection.
The rest of the paper is organized as follows. Section 2 discusses various statistical techniques available to evaluate similarities and dissimilarities and goes on to discuss how these statistical techniques could be applied to the field of intrusion detection. Section 3 presents the approach that we have followed. In Section 4 we present the mathematical and programmatical implementation of the problem. Section 5 deals with results and discussions.
2. Statistical Techniques
Statistics deals with huge volumes of data and has several established techniques to analyze the data based on their similarity or dissimilarity. In huge volumes of data a small anomaly can be easily identified from historical data. This phenomenon can be adapted to network intrusion detection. Since warnings are based on actual usage patterns, statistical systems can adapt to behaviors and therefore create their own rule usage-patterns. The usage-patterns are what dictate how anomalous a packet may be to the network.
Anomalous activity is measured by a number of variables sampled over time and stored in a profile. Based on the anomaly score of a packet, the reporting process will deem it an alert if it is sufficiently anomalous; otherwise, the IDS will simply ignore the trace. The IDS will report the intrusion if the anomalous activity exceeds a threshold value.
Statistical techniques of intrusion detection usually measure similarities or dissimilarities between network variables like users logged in, time of login, time of logout, number of files accessed in a period of time, usage of disk space, memory, CPU, IP addresses, number of packets transferred etc. The frequency of updating can vary from a few minutes to, for example, one month. The system stores mean values for each variable used for detecting exceeds that of a predefined threshold.
Similarity is defined as a quantity that reflects the strength of relationship between two objects or two features. This quantity is usually having range of either –1 to +1 or normalized into 0 to 1. If the similarity between feature and feature is denoted by δ, we can measure this quantity in several ways depending on the scale of measurement (or data type) that we have. On the other hand, dissimilarity measures the discrepancy between the two objects based on several features. Dissimilarity may also be viewed as measure of disorder between two objects. These features can be rep resented as coordinate of the object in the features space. There are many types of distance and similarity. Each similarity or dissimilarity has its own characteristics. Let the dissimilarity between object i and object j is denoted by δij. The relationship between dissimilarity and similarity is given by
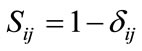 (1)
(1)
for similarity bounded by 0 and 1. When the objects are similar, the similarity is 1 and dissimilarity is 0 and vice versa. If similarity has a range of –1 to +1 and the dissimilarity is measured with range of 0 and 1, then
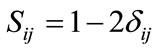 (2)
(2)
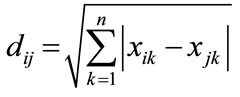
There are several distance metrics available for measuring the similarity or dissimilarity between quantitative variables. The simplest distance variable is the Euclidean Distance [14]. Euclidean distance or simply “distance” examines the root of square differences between coordinates of a pair of objects and is given by
 (3)
(3)
Manhanttan distance metric is another such metric. It represents distance between points in a city road grid. It examines the absolute differences between coordinates of a pair of objects and is given by
 (4)
(4)
Chebyshev distance [15] is another such statistical distance metric and is also called maximum value distance. It examines the absolute magnitude of the differences between coordinates of a pair of objects and is given by
 (5)
(5)
Chebyshev metric is actually a special case of the Minowski metric with λ =  and has been used to calculate the dissimilarities between normal events and malicious events in networks. In this paper we use the Canberra metric. Canberra distance was proposed by Lance and Williams in 1967. It examines the sum of series of a fraction differences between coordinates of a pair of objects. Each term of fraction difference has value between 0 and 1. The Canberra distance itself is not between zero and one. If one of coordinate is zero, the term become unity regardless the other value, thus the distance will not be affected. Note that if both coordinate are zeros, we need to be defined as
  This distance is very sensitive to a small change when both coordinates are near to zero.
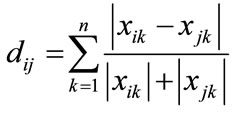 (6)
(6)
3. Our Approach
We start with selection of the key factors which can best describe a system in words of capability and vulnerability.
Using these key factors, a formula based approach is used to calculate a reliability value, which shows the level to which a user can rely on IDS. A Threshold value is defined in accordance with the normal functioning of an Intrusion detection system in a real time environment. A distance measuring metric known as Canberra metric is applied to determine the similarity or dissimilarity between the predefined threshold value and the observation value. Comparison results are provided by the Canberra metric, which depict the trust level of the IDS. If the observed value is less than the defined threshold value, it shows that IDS under consideration is not a reliable one.
Now these similarity based values generated by Canberra metric are passed to an evaluation tool which generates the receiver operating characteristics (ROC) graph showing the comparison between the observed value and the predefined value.
3.1. Feedback Reliability Ratio (FRR)
The primary task of our approach is the selection of the attribute on which the evaluation of IDS is to be classified.
For this purpose four parameters are taken into consideration namely: True Positive (TP), False Positive (FP), True Negative (TN), and False Negative (FN). True Positive depicts the number of detections caught by IDS when the detections are actually a threat to the system. False Positive value shows the incorrect decision made by IDS about a threat, while they were not actually involved in any threatening event. True Negative is the condition when IDS correctly determine an activity about its harmless nature. False Negative is the situation when IDS declares an activity as harmless, while the activity was a threat and was capable of causing harm to a system.
The fundamental property of a good Intrusion Detection System is not only to detect a threat but is also to provide a correct and reliable decision about an activity. Performance of a system degrades if the IDS installed on the system provide an improper feedback about an activity. So, the reliability factor converges to the False Positive (FP) and False Negative (FN) values of IDS, and these two attribute can describe the capability of an IDS to a reasonable extent. Lower the FP and FN values indicate better reliability on feedback provided by IDS. Mathematically, Reliability on a feedback provided by an IDS can be shown as:
 (7)
(7)
Total value of both the factors (FP and FN) represents the number of incorrect decisions declared by the IDS. So, a feedback ratio can be determined on the basis of these two factors which can describe the reliability value of IDS on the basis of its past judgments. Hence,
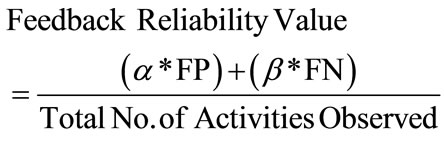 (8)
(8)
where α = Coefficient of false positives and β = Coefficient of false negatives.
Depending upon the environment in which the IDS is installed, expectations from an IDS varies in terms of performance. In some situations a very low value of FN is desired, as a high value of FN can harm a system if a strong attack passes through the IDS filter. However, in some cases a high value of FP can drastically degrade the system performance, as the user will not be able to execute any task if the IDS blocks most of the activities by marking them as a threat. Hence, the coefficients (α and β) used in the above equations can take values between 0 and 1 depending upon the expectation of the environment on which IDS is to be applied on. Figure 1 shows a flowchart of our approach.
3.2. Canberra Metric to Predict the Performance of an IDS
Canberra metric is a measure used for determining the
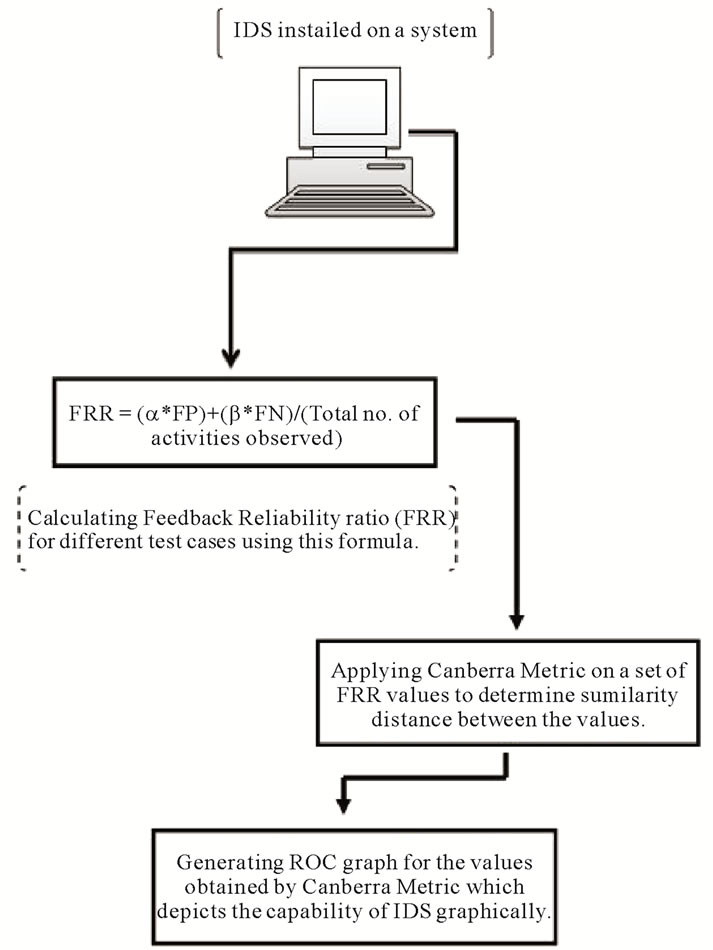
Figure 1. Flowchart.
distance between groups in terms of similarity between the elements. Canberra metric operates as a rectangular metric having numerical values, with different cases as its rows and variations observed in a case as its column values. A square symmetric matrix is generated as the output of the metric algorithm with zero’s as its diagonal elements. The values of the output matrix represent the distance between the variations of cases. The distance between any two elements is determined using the formula shown below:
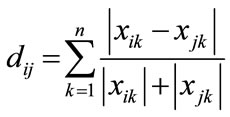 (9)
(9)
where, i and j are the cases for which distance is to be determined, and k is the variation index for the cases. For the evaluation of an Intrusion Detection System using the Canberra distance metric various test cases are taken under consideration which provide us with the numerical values to be passed as the input to Canberra metric. To generate different test cases for evaluation of computer network intrusion detection systems, the Dataset made available by MIT Lincoln Laboratory, under Defense Advanced Research Projects Agency (DARPA ITO) and Air Force Research Laboratory (AFRL/SNHS) sponsorship in 1998 and 1999 [16] and [17] evaluation is used. These data sets contain examples of both attacks and background traffic. Canberra metric determine the distance between the FRR values using the above equation and finally output the distance values in a square symmetric matrix form. These output values shows the distance or dissimilarity in our case for different test cases. Canberra metric provides a mathematical representation of the similarity/dissimilarity between various cases available, the values of different columns can be compared to see the different trust levels of IDS. This observation helps an analyst to decide upon the IDS to be used on a system for securing data and to protect it from any external threat.
3.3. Weka
To demonstrate the results obtained by Canberra metric graphically, any graphical tool can be used. In our case a famous tool named Weka [18] is used. Waikato Environment for Knowledge Analysis (Weka) is an evaluation Tool used for Data Mining for data analysis and predictive modeling purposes. Present version of Weka is built on Java programming language, so provides better flexibility and can be deployed on any platform [19]. The values generated by Canberra Metric are passed as an input to Weka through a file in Comma separated values (CSV) format. Weka use these values in CSV file to output a Receiver operating characteristics (ROC) graph which shows a deviation between different curves, more the deviation observed shows less capability of the IDS.
4. Implementation of Canberra Metric
A slightly modified form of Canberra Metric is implemented for the evaluation of distance measure. Pseudocode for modified Canberra Metric algorithm is given below: Consider “C” is the number test cases generated and “v” is the number of variation observed in a test case. And “X” is a temporary variable. Let “M” (of order C*v) is the input matrix containing all the data required to be processed by the algorithm. And “O” (of order C*C) is the output matrix, which is a square symmetric matrix.
CANBERRA-DETERMINE (C, v)
1) For i = 0 to C
2) Begin
3) For j = 0 to C
4) Begin
5) Val = 0
6) For k = 0 to v
7) Begin
8) Yik = M[i][k];
9) Yjk = M[j][k];
10) X = (Yik – Yjk)/(Yik + Yjk)//Standard formula for Canberra metric
11) End
12) O[i][j] = Val; //Save this value in the output matrix
13) End
14) End
15) Output ‘Matrix O’
This output matrix “O” provides us with the values depicting the deviation between performances of the IDS in different cases, which helps us in determining overall capability of the IDS. The values passed to the Canberra algorithm are obtained by applying Feedback Reliability Ratio (FRR) formula on various test cases (By taking moderate value for both the constants a and SS as 0.5 in Equation (2)). After applying Canberra algorithm on these values of the test cases, a square matrix is obtained that clearly depicts the effective value for every case. Figure 2 shows the structure of the matrices, input values and the output matrix generated.
Finally, a graphical representation of the observed values is generated. The sum of the effective value for every case from the output matrix is used to locate points in the graph on y-axis, along with the intervals given on the x-axis. Joining these points in the graph generates a polyline graph, which shows the capability of an Intrusion Detection System for various test cases.
5. Results and Discussion
The peak point of the ROC graph shown in Figure 3 shows the poor performance of IDS in real time environment. While a point at lower level shows better feedback results provided by the IDS. Thus, from the ROC graph for an IDS it can easily be predicted that in what scenario an IDS can perform efficiently. The ROC can also predict at what situation IDS does not provide a reliable detections and the trust level of the IDS.
The approach followed in this paper makes use of easily available attributes like False Positive (FP), False Negative (FN) and Total number of activities that helps in determining the Feedback Reliability Ratio (FRR). Further a distance based metric is used to determine the
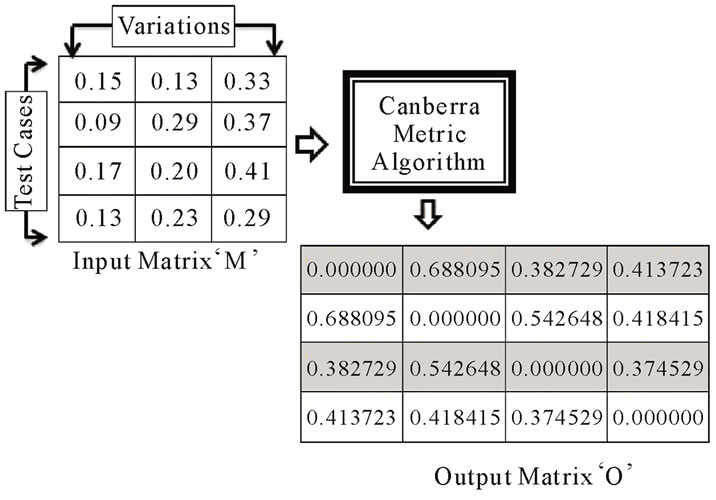
Figure 2. Structure of matrices.
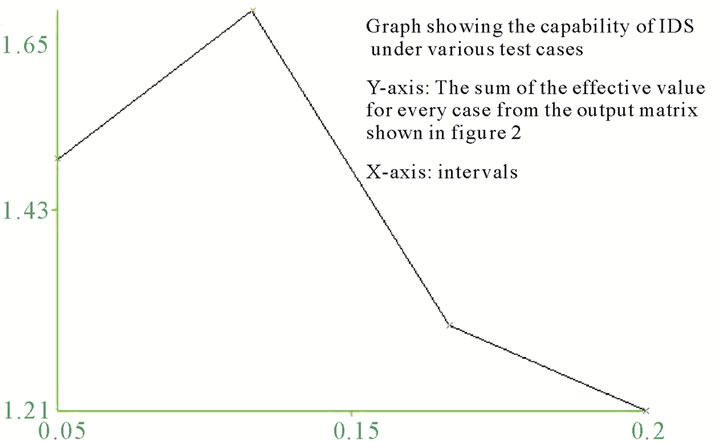
Figure 3. ROC curve.
similarity or dissimilarity in the behavior of an IDS. In our case, Canberra Metric is implemented for this purpose on the data set provided by DARPA analysis in 1999 for the evaluation of Intrusion Detection Systems. Finally the results produced by Canberra Metric are shown graphically using a Java based data mining tool by drawing a ROC graph.
The approach shown in this paper proved its importance in the field of network security as data security is a crucial factor in networks, where many sites interact with each other for data sharing and transaction of information. In such areas, a single threat can hamper the whole system due to its malicious nature. And hence need of a reliable Intrusion Detection System rises, which can secure both data and transactions on a system. But for this purpose, there should be a proper evaluation methodology which can predict the nature and performance of an IDS before installing it on a real time scenario. Our approach accomplishes that purpose by defining an evaluation technique for IDS using information of its behavior in the past.
6. Future Work
Unlike the norm that an IDS should be executed as often as possible to minimize the effects of intrusions we have shown that the IDS should be operated at optimum times with a view to maximize reliability o the IDS. The optimal position at which reliability is a maximum depends n several factors like attacker types, network characteristics etc. Thus, our aim should be to optimize performance and hence reliability of IDS in such varying circumstances. In future we hope to devise methods to increase performance and predict more accurate reliability of intrusion detection systems.
7. Acknowledgements
The first author wishes to acknowledge the support of a WOS-A project (ref. no. : SR/WOS-A/ET-20/2008) funded by the Department of Science and Technology, Government of India.
REFERENCES
- M. Mahoney, “Computer Security: A Survey of Attacks and Defenses,” 2000. http://docshow.net/ids.htm
- U. Banerjee and A. Swaminathan, “A Taxonomy of Attacks and Attackers in MANETs,” International Journal of Research and Reviews in Computer Science, Academy Publishers, Vol. 2, 2011, pp. 437-441.
- P. Ning and K. Sun, “How to Misuse AODV: A Case Study of Insider Attacks against Mobile Ad-Hoc Routing Protocols,” Journal Ad Hoc Networks, Vol. 3, No. 6, 2005, pp. 60-67.
- S. E. H. Smaha, “An Intrusion Detection System,” Proceedings of the IEEE Fourth Aerospace Computer Security Applications Conference, Orlando, December 1988, pp. 37-44.
- H. Debar, M. Dacier and A. Wespi, “Towards a Taxonomy of Intrusion Detection Systems,” Computer Networks, Vol. 31, No. 8, 1999, pp. 805-822. doi:10.1016/S1389-1286(98)00017-6
- J. Allen, A. Christie, W. Fithen, et al., “State of the Practice of Intrusion Detection Technologies,” Carnegie Mellon University, Software Engineering Institute, CMU/ SEI-99-TR-028 ESC-TR-99-028, 2000. http://citeseerx.ist.psu.edu/viewdoc/summary?doi=10.1.1.155.4719
- G. F. Gu, P. Fogla, D. Dagon, W. Lee and B. Skori, “Measuring Intrusion Detection Capability: An Information-Theoretic Approach,” Proceedings of the 2006 ACM Symposium on Information, Computer and Communications Security, New York, 2006, pp. 90-101.
- A. Nicholas, A. Randal, L. John, O. Henry and R. George, “Intrusion Detection Testing and Benchmarking Methodologies,” Proceedings of the First IEEE International Workshop on Information Assurance, Washington DC, 2003.
- N. J. Puketza, K. Zhang, M. Chung, B. Mukherjee and R. A. Olsson, “A Methodology for Testing Intrusion Detection Systems,” IEEE Transactions on Software Engineering, Vol. 22, No. 10, 1996, pp. 719-729.
- M. Ranum, “Experiences Benchmarking Intrusion Detection Systems,” 2001. http://www.nfr.com/
- Anonym, “Testing Intrusion Detection Systems: A Critique of the 1998 and 1999 DARPA Intrusion Detection System Evaluations as Performed by Lincoln Laboratory,” ACM Transactions on Information and System Security, Vol. 3, No. 4, 2000, pp. 262-294.
- Wilkison, “Intrusion Detection FAQ: How to Evaluate Network Intrusion Detection Systems?” http://www.sans.org/security-resources/idfaq/eval ids.php
- S. M. Emran, and N. Ye, “Robustness of Chi-Square and Canberra Distance Metrics for Computer Intrusion Detection,” Quality and Reliability Engineering International, Vol. 18, No. 1, 2002, pp. 18-28.
- R. A. Johnson and D. W. Wichern, “Applied Multivariate Statistical Analysis,” Prentice Hall, New Jersey, 1998, pp. 226-235.
- T. P. Ryan, “Statistical Methods for Quality Improvement,” John Wiley & Sons, New York, 1989.
- R. Lippmann, D. J. Fried, I. Graf, J. W. Haines, K. R. Kendall, D. McClung, D. Weber, S. H. Webster, D. Wyschograd, R. K. Cunningham and M. A. Zissman, “Evaluating Intrusion Detection Systems: The 1998 DARPA Off-Line Intrusion Detection Evaluation,” IEEE Computer Society Press, Vol. 2, 2000, pp. 12-26.
- R. Lippmann, J. W. Haines, D. J. Fried, J. Korba and K. Das, “The 1999 DARPA Off-Line Intrusion Detection Evaluation,” Springer, Berlin Heidelberg, New York, 2000, pp. 162-182.
- Weka. http://www.cs.waikato.ac.nz/ml/weka/
- Z. Markov and I. Russell, “An Introduction to the WEKA Data Mining System,” Proceedings of the 11th Annual SIGCSE Conference on Innovation and Technology in Computer Science Education, 2006, pp. 367-368.
NOTES
*Corresponding author.