Journal of Modern Physics
Vol. 2 No. 12 (2011) , Article ID: 9032 , 7 pages DOI:10.4236/jmp.2011.212184
Synthesis and Characterization of Chlorine-Methoxy-Diphenylquinoline (Cl-MO-DPQ) and Chlorine-Methyl-Diphenylquinoline (Cl-M-DPQ) Blue Emitting Organic Phosphors
1 Jawaharlal Nehru Art’s, Commerce & Science College Wadi, Nagpur, India
2Department of Physics, Rashtrasant Tukadoji Maharaj, Nagpur University, Nagpur, India
3Department of Applied Physics, Shri Vidhyarthi Sudhar Sangh’s College of Engineering & Research, Nagpur, India
4Department of Physics, Kyung Hee University, Seoul, South Korea
E-mail: *sjdhoble@gmail.com
Received July 29, 2011; revised October 9, 2011; accepted October 22, 2011
Keywords: Diphenylquinoline (DPQ), Chlorine-Methoxy (Cl-MO-DPQ), phosphor, OLED
ABSTRACT
New series of blue light emitting diphenylquinoline (DPQ) and its derivatives based on Chlorine-Methoxy (Cl-MO-DPQ) and Chlorine-Methyl (Cl-M-DPQ) were synthesized in Argon atmosphere at 140˚C by Friedlander condensation. These all samples were soluble in many organic solvents like Acetic acid, Formic acid, Dichloromethane etc. in different molar concentrations up to micro molar. It emits blue light in above solvents under UV source. All samples in different organic solvents were studied. Structural characterization was made by FTIR. Ultraviolet, fluorescence and excitation spectroscopy were used for analysis of photo physical properties. Thermal properties were characterized by TGA and SDTA. The derivatives Cl-MO-DPQ and Cl-M-DPQ show absorbance peaks in the range 264 - 370 nm and 264 - 338 nm respectively. In both the cases the emission spectra are in blue region. The TGA and SDTA studies show not only the DPQ but also it’s derivatives have good thermal stability even though they are low molecular weight organic compounds, which may in turn improve the stability and operating lifetime of the device. The physical and chemical properties of these polymers are useful as a blue emitting organic material for OLED’s.
1. Introduction
An Organic Light Emitting Diode (OLED) is a special type of light-emitting diode (LED) in which, the emissive layer comprises a thin-film of certain organic compounds. П-Conjugated polymers are found growing applications in electronics and optoelectronics, including light-emitting diodes, photovoltaic cells, thin film transistors, and sensors [1]. Red, green, and blue emissions with high efficiencies are required for full-color displays [2]. In the evaluation of potential long term applications of organic conducting polymers, some of the major concerns are the chemical and thermal stability of doped conjugated polymers [3]. The promise of П-conjugated polymers as advanced materials for applications in electronics, optoelectronics, and nonlinear optics has motivated our continuing investigation of several classes of П-conjugated polymer [4]. These studies have included synthesis and characterization of new materials. One of the most fascinating advantages of organic materials is the possibility of a wide selection of emission colors, particularly in the blue region in EL displays through the molecular design of organic materials [5].
In the present work a diphenylquinoline(DPQ) and its derivatives based on Chlorine-methoxy DPQ and Chlorine-methyl DPQ were synthesized by Friedlander condensation at 90˚C for one hour and then at 140˚C for four hours under Argon atmosphere. The crystalline solids obtained were tested in acidic and basic solvents at different molar concentrations for emission. All the organic products show very strong blue emission under UV source. Here, variety of laboratory techniques is used to determine the physical and chemical properties of polymers. The UV-transmittance and absorption spectra were recorded on SPECORD-50 spectrophotometer to study the photo physical properties of organic material [6].
PL spectra were recorded on Hitachi F-4000 spectrofluorometer to study the emission and excitation range. FTIR spectra were obtained by FTIR-8101 SHIMADZU spectrometer to determine various functional groups present in the polymers [7]. X-ray diffraction pattern was recorded by PANalytical’s X’Pert PRO Material Research Diffractometer for the identification of crystalline phases [8]. Thermal stability was studied by tracing Thermo gravimetric Analysis (TGA) & Single Differential Thermal Analysis (SDTA) curves [9]. The results of all the polymers regarding structural conformation, thermal and optical properties are confirmed as per the requirements for the blue emission.
2. Experimental
Chlorine methoxy and chlorine methyl substituted 2; 4-diphenyl quinoline has been synthesized by Friedlander condensation. Cl-MO-DPQ and Cl-M-DPQ were synthesized as shown in schemes 1 and 2 respectively. 2-amino, 5-chlorobenzophenone reacts with 4-methoxy acetophenone in presence of diphenyl phosphate at 140˚C, in an Ar atmosphere, water vapors comes out and finally, undergoes crystallization and gives 6-Chloro- 2(4-methoxyphenyl)-4-phenyl quinoline (Cl-MO-DPQ). In case of chlorine methyl DPQ, we have to replace 4-methoxy acetophenone by 4-methyl acetophenone to get 6-chloro-2(4-methylphenyl)-4-phenyl quinoline (ClM-DPQ).
2-amino, 5-chlorobenzophenone (Aldrich Chemicals), and acetophenone (Aldrich Chemicals) were added along with 2 gms of diphenyl phosphate and 3 gms of m-cresol
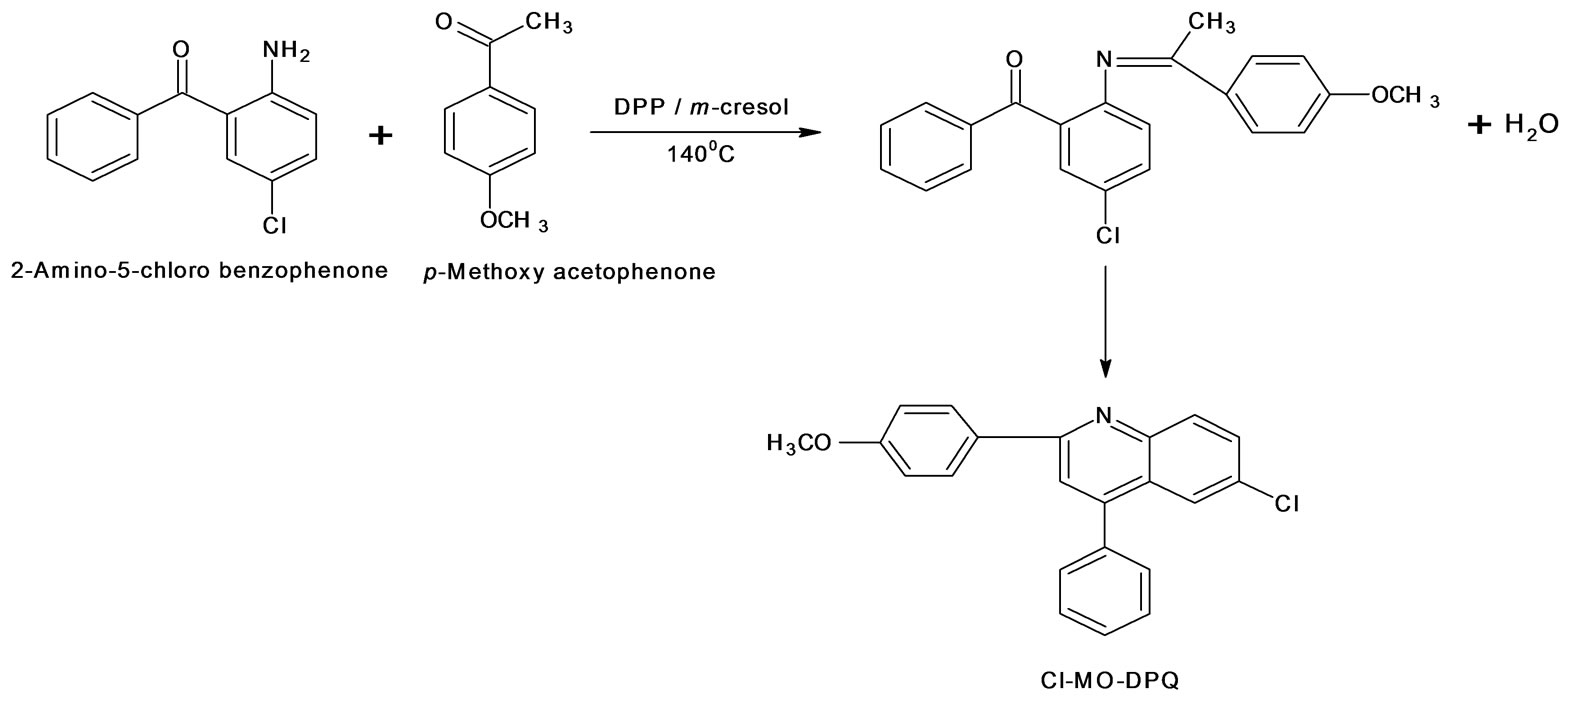
Scheme 1. Synthesis of 6-chloro-2(4-methoxyphenyl)-4-phenyl quinoline (Cl-MO-DPQ).
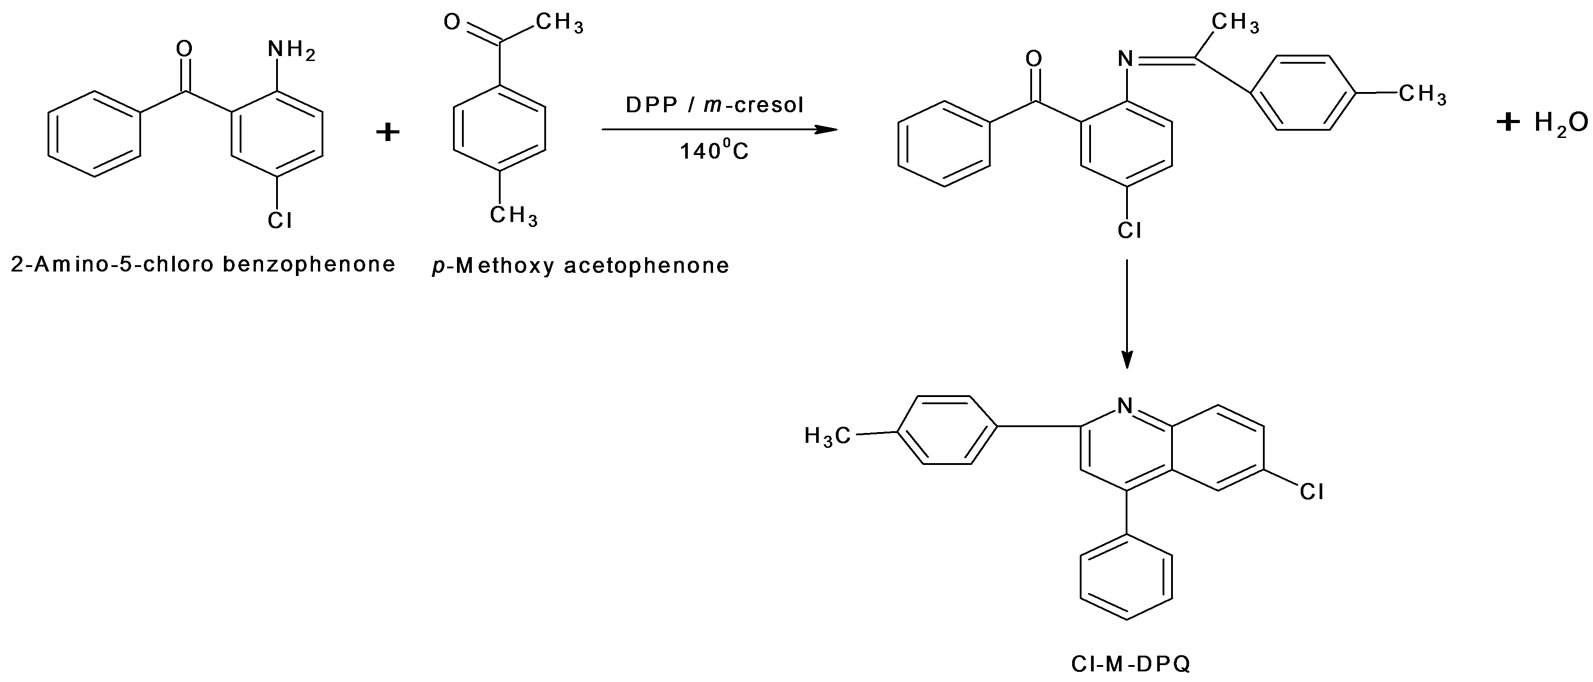
Scheme 2. Synthesis of 6-chloro-2(4-methylphenyl)-4-phenyl quinoline (Cl-M-DPQ).
in glass reactor fitted with mechanical stirrer and two glass inlets. The reaction mixture was purged with an argon gas [purity: 99.90%] for 20 min. and then temperature was raised to 90˚C gradually under the argon atmosphere for 1h and then to 140˚C for 4 h. After cooling, methylene chloride (20 ml, SRL make) and 10% NaOH (100 ml) were added to reaction mixture. The organic layer was separated and washed with distilled water (50 ml × 5 times) until it was neutral. Then it was dried over an MgSO4 and evaporated under the nature condition to yield an off-white solid. The crude product was then washed with hexane (25 ml × 5 time) to afford crystalline solid. Same method was applied for the synthesis to obtain crystalline solid of chlorine-methyl-diphenylquinoline (Cl-M-DPQ) [10].
The Fourier transform infrared (FT-IR) spectra were measured with a SHIMADZU Model 8101A infrared spectrophotometer with 1% sample and 99% KBR in the form of pallet. UV spectra in acetic acid, formic acid and THF were recorded on ANALYTIKJENA—Split-Beam spectrophotometer SPECORD 50 in different molar concentrations. The photoluminescence spectra were obtained by HITACHI F-4000 spectrofluorometer in the solid state powder at room temperature. The thermal stability and their melting point were analyzed from TGA and SDTA curve. This analysis was carried out in air atmosphere with a heating rate 4˚C/min in a platinum crucible. The thermocouple used was Chromel-Alumel in the temperature range 35˚C - 325˚C. It was recorded from Mettler STARe Thero Gravimetric Analyzer TGA, SDTA.
3. Results and Discussion
The qualitative aspects of infrared spectroscopy are one of the most powerful attributes of this diverse and versatile analytical technique. The average modern infrared instrument records spectra from an upper limit of around 4000 cm−1 (by convention) down to 400 cm−1 as defined by the optics of the instrument (commonly based on potassium bromide, KBr).
From the figures 1 and 2, we can conclude that, the aromatic CH vibration stretch which appears at 3100 - 3000 cm−1. A strong absorption band in the region around 1700 cm−1 is due to C=O stretching. There are aromatic CC stretch bands for the carboncarbon bonds in the aromatic ring at about 1500 - 1600 cm−1. A small stretching peak appears at 2820 - 2815 cm−1 which confirms the presence of methoxy (O-CH3) group. The strong FT-IR peaks at 1663 and 1656 cm−1 owing to the carbonyl groups have almost completely disappeared as in 2, 4-DPQ [11]. The new strong bands between 1500 and 1400 cm−1 due to the imine (C=N) group and this is
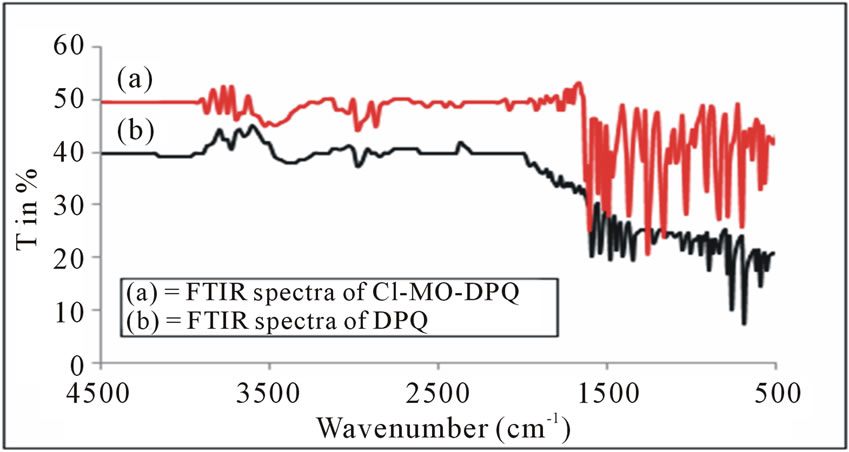
Figure 1. FTIR Spectra of DPQ and Cl-MO-DPQ.
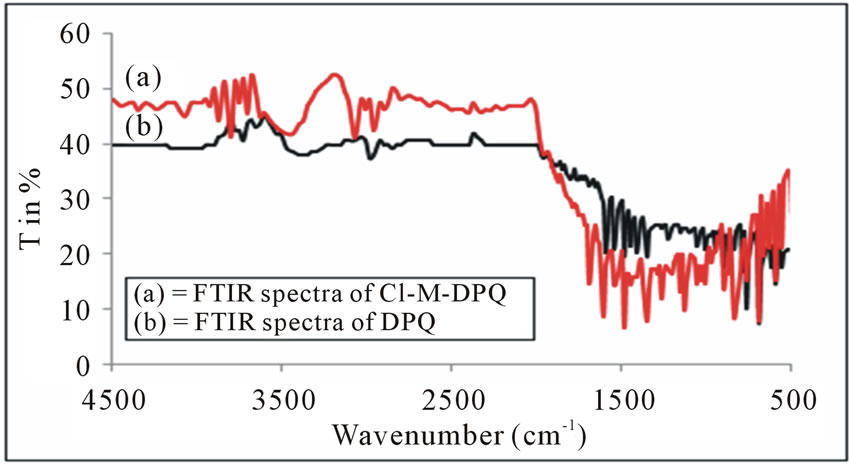
Figure 2. FTIR Spectra of DPQ and Cl-M-DPQ.
the characteristic of the quanoline ring. The C=N structure in the polymers gives the electron transporting characteristics. We observe the asymmetric C-H stretch of the methyl group (2960 cm−1) occurring at slightly higher frequency than symmetric vibrations (2875 cm−1) for methyl.
The Photo physical characteristics of the polymers were investigated in solution and in the solid state. The solubility of 6-chloro-2(4-methoxyphenyl)-4-phenyl quinoline (Cl-MO-DPQ) and 6-chloro-2(4-methylphenyl)-4- phenyl quinoline (Cl-M-DPQ) were tested in a variety of organic solvents. The Cl-MO-DPQ and Cl-M-DPQ exhibited good solubility in several solvents such as chloroform, dichloromethane, tetrahydrofuran (THF), formic acid (FA), acetic acid, etc. The good solubility nature of Cl-MO-DPQ and Cl-M-DPQ can be attributed to the presence of the methoxy, methyl and chlorine units, along with flexible phenyl linkages in the quinoline backbone. This result demonstrates that the introduction of the methoxy and methyl unit into the main chain is highly effective in enhancing the solubility of the diphenylquinolines. The UV-vis absorption spectra could provide a good deal of information on the electronic structures of the polymeric compound.
The absorption spectra of Cl-MO-DPQ in THF, acetic acid, and formic acid solution are depicted in Figures 3-5 respectively. The Cl-MO-DPQ in THF solution exhibits an absorption with a λmax at 272 nm, due to π - π*
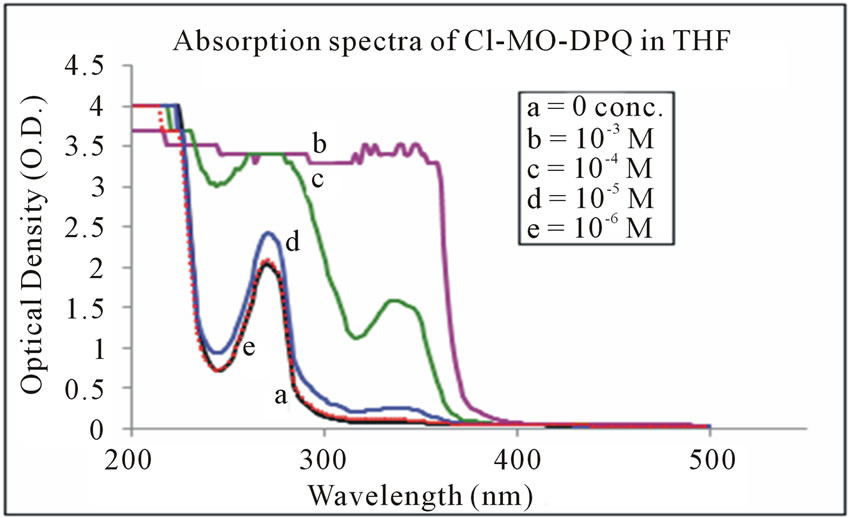
Figure 3. Absorption spectra of Cl-MO-DPQ in THF.
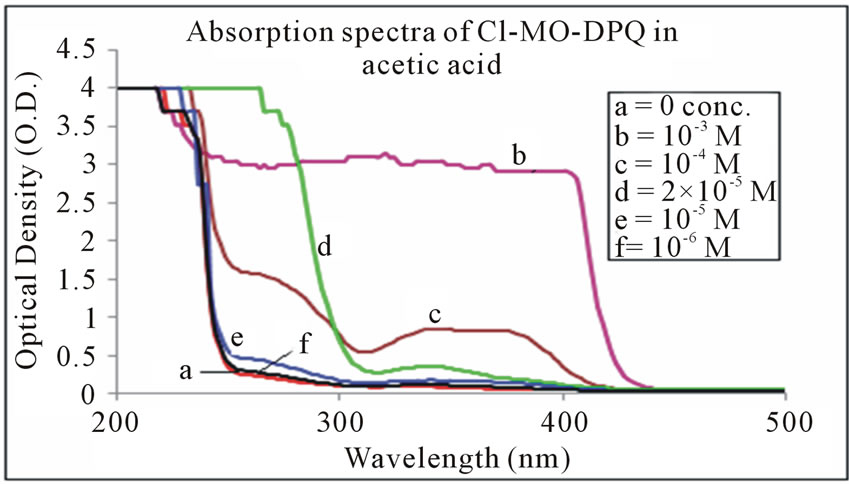
Figure 4. Absorption spectra of Cl-MO-DPQ in acetic acid.
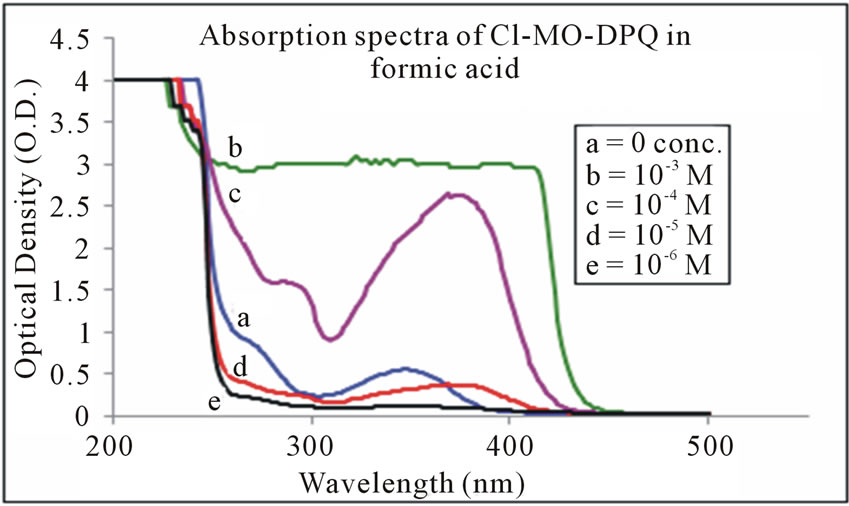
Figure 5. Absorption spectra of Cl-MO-DPQ in formic acid.
transition contributed by the conjugated quinoline backbone. There is an additional absorption at 340 nm contributed by the phenyl side chains of the model compound, with sufficient molar extinction coefficient (ε). Similarly, Cl-MO-DPQ in acetic acid and formic acid solution, exhibit absorption peaks at 264 nm, 334 nm and 274 nm, 348 nm respectively.
This red shift of the absorption spectrum of Cl-MODPQ is due to protonation of imine nitrogen of the quinoline ring to form quinoliniun ion such an effect of protonation of imine has been observed in polyquinolines. The red shift of the emission band is in line with a similar red shift in absorption band.
The absorption spectra of Cl-M-DPQ in THF, acetic acid, and formic acid solution are depicted in Figures 6-8 respectively. The Cl-M-DPQ in THF solution exhibits an absorption with a λmax at 270 nm, due to π - π* transition contributed by the conjugated quinoline backbone. There is an additional absorption at 326 nm contributed by the phenyl side chains of the model compound, with sufficient molar extinction coefficient (ε). Similarly, Cl-M-DPQ in acetic acid and formic acid solution, exhibit absorption peaks at 264 nm, 338 nm and 276 nm, 350 nm respectively. Here is also the red shift is obtained in the absorption spectrum of Cl-M-DPQ is due
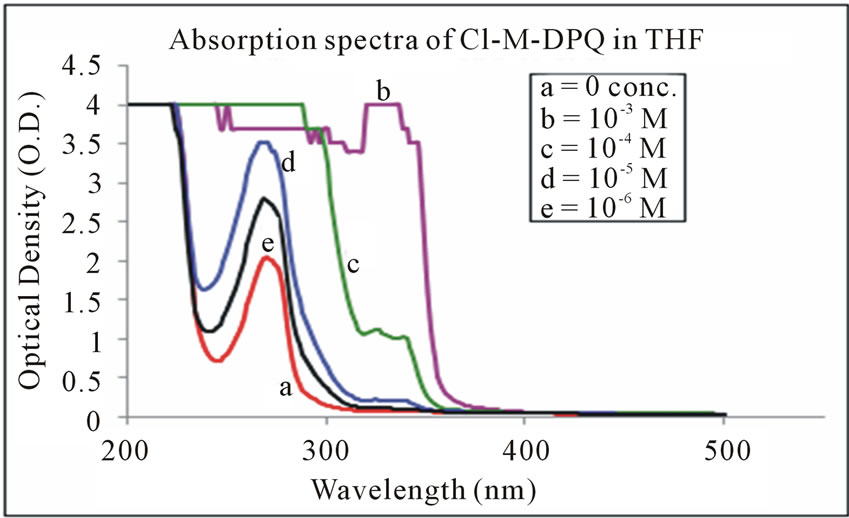
Figure 6. Absorption spectra of Cl-M-DPQ in THF.
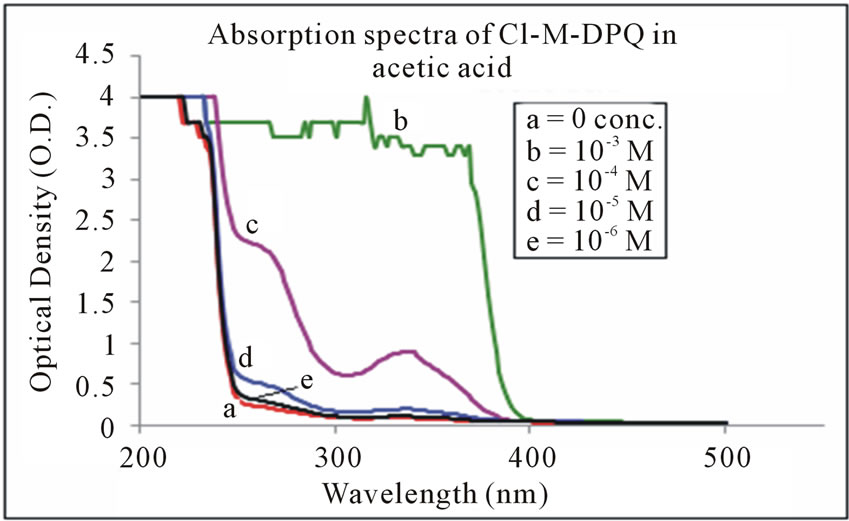
Figure 7. Absorption spectra of Cl-M-DPQ in acetic acid.
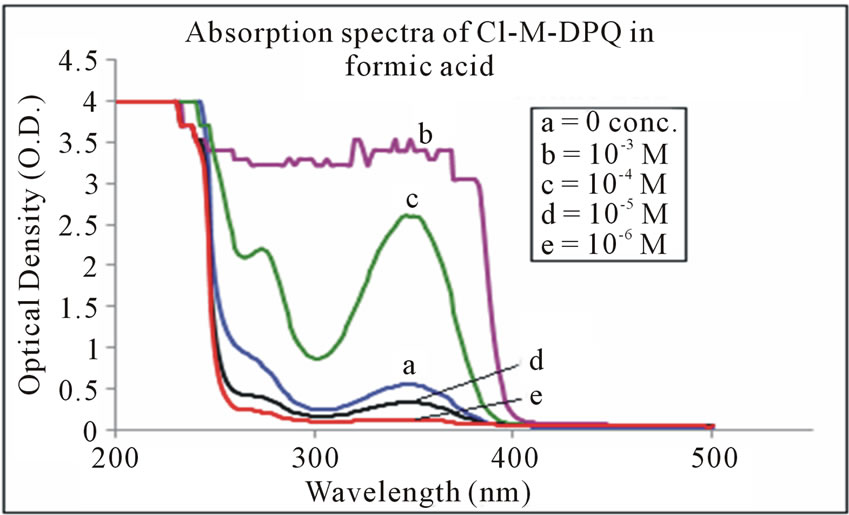
Figure 8. Absorption spectra of Cl-M-DPQ in formic acid.
to protonation of imine nitrogen of the quinoline ring to form quinoliniun ion such an effect of protonation of imine has been observed in polyquinolines. Table 1 shows the absorption peaks in nm of both Cl-MO-DPQ and Cl-M-DPQ in THF, acetic acid, and formic acid.
The experiments performed with highly and weakly polar organic solvents show an insignificant influence of a solvatochromic effect on the optical absorption thus the discrepancies between the calculated and the measured spectra must be rather attributed to electron-vibronic coupling as well as to rotational dynamics of methyl/ phenyl groups.
The PL spectra of Cl-MO-DPQ and Cl-M-DPQ in solid state are as shown in Figures 9 and 10. Upon excitation of the Cl-MO-DPQ main chain in solid state at 365 nm, the emission spectrum displays a broad band at 440
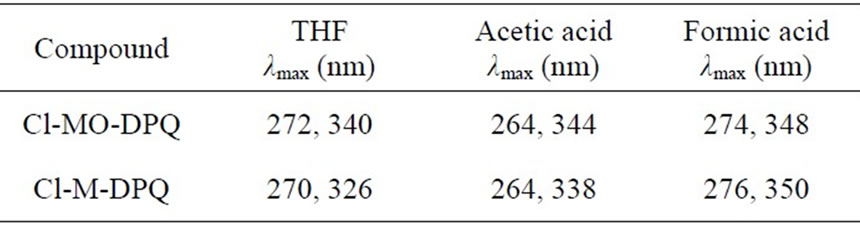
Table 1. Absorption peaks, λmax of Cl-MO-DPQ and Cl-MDPQ in nm.
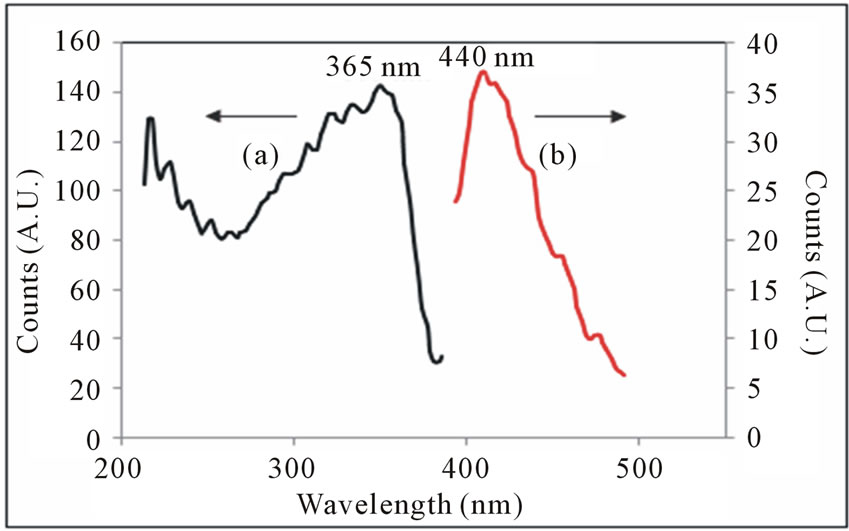
Figure 9. (a) Excitation and (b) Emission spectra of Cl-MODPQ in powder form.
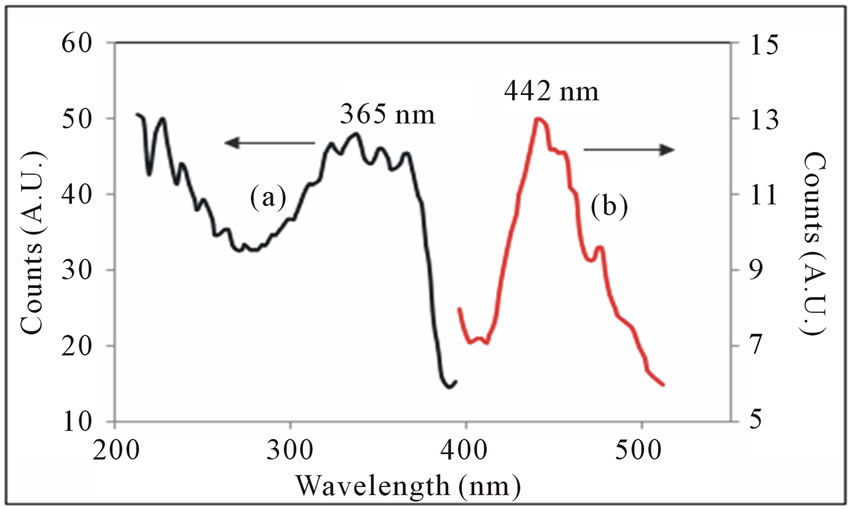
Figure 10. (a) Excitation and (b) Emission spectra of Cl-MDPQ in powder form.
nm, with a hint of a shoulder around 468 nm. The observed 365 nm excitation in the range of near UV excitation of OLED, and 365 nm excitation light is match with standard light emitting diode. The excitation spectra Cl-M-DPQ crystalline powder shows peak at 365 nm. When the powder is excited at 365 nm, it emits intense blue light of wavelength 442 nm with shoulder peaks at around 457 and 477 nm. The unresolved bands in both the cases can be seen in the emission spectrum with some vibronic structure. The powder emission spectra (365 nm excitation) losses vibronic structure and have a peak at 440 nm. However, the spectrum is significantly broad, which may be due to additional π - π* interactions or conformational rigidity in the solid state.
Thermo gravimetric analysis is a type of testing performed on a sample to determine changes in weight in relation to change in temperature and to calculate Degradation temperature (At this temperature a weight loss of 5% of starting mass takes place and it’s a convenient benchmark for comparing anti-oxidant efficiency). The TGA and SDTA of both the samples are shown in figures 11 and 12. The TGA is used for precise measure-
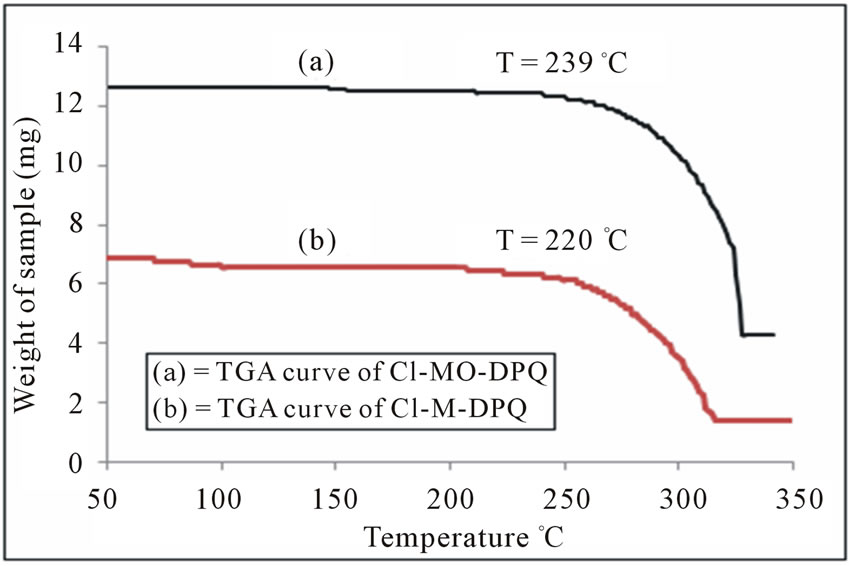
Figure 11. TGA Curve of (a) Cl-MO-DPQ and (b) Cl-MDPQ in powder form.
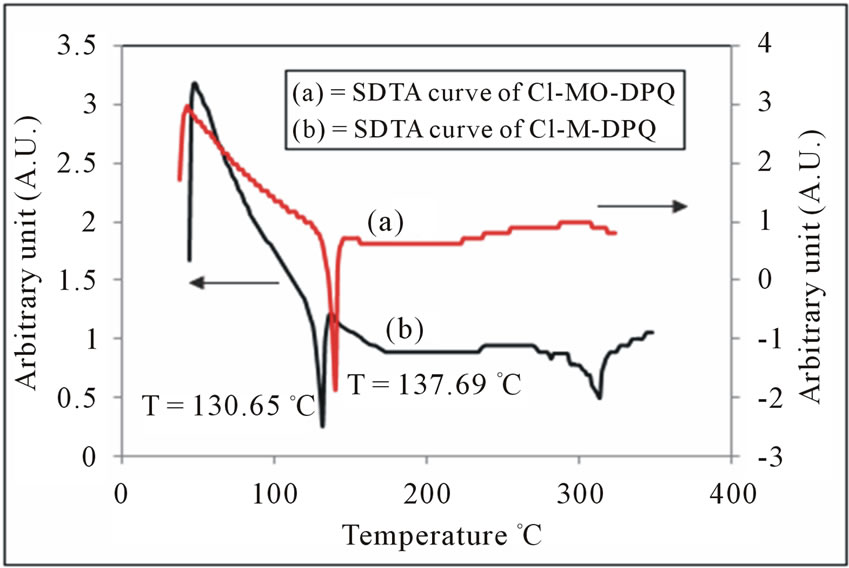
Figure 12. SDTA Curve of (a) Cl-MO-DPQ and (b) Cl-MDPQ in powder form.
ment of specimen weight changes as function of time and temperature in various gaseous environments. This experimental method is very useful for investigation of reactivity and stability. Thermal decomposition and nitridation reactions are typical examples.
The TGA results reveal that the onset decomposition temperatures of the polymeric compound are around 270˚C for Cl-MO-DPQ and 212˚C for Cl-M-DPQ which indicates that the material is stable. Obviously, the stability of the material is adequate for the fabrication processes and other optoelectronic devices. The high thermal stability is closely related to the performance of the LEDs, which prevents morphological change, deformation, and degradation of the emitting layer, by current-induced heat during the operation of EL devices.
As displayed in figure 12, the first SDTA trace shows the melting peak around 137.69˚C for Cl-MO-DPQ and 130.65˚C for Cl-M-DPQ. This clearly indicates that the incorporation of the rigid quinoline unit into the phenyl backbone reduces the segmental mobility and effectively suppresses the tendency of the polymer chains to densely pack. This improved thermal resistance of the copolymers bodes well for stable blue emission from LEDs made from them. The thermal data of Cl-MO-DPQ and Cl-M-DPQ are summarized in Table 2.
Glass transition is a dynamic phenomenon between two distinct states of matter (liquid and glass), each with different physical properties. The glass transition temperature (Tg), is lower melting temperature(Tm), due to super cooling. Feature of chemical structure that affects the degree of molecular freedom influence both the crystalline melting point and the glass transition temperature. Moreover such features have roughly similar effects on both properties so that the empirical rule has been found that for many polymers [12]. The correlation between Tm and Tg in metallic glasses (MGs) is analyzed by Lu and Li in 2009 [13]. A linear relationship, Tg = 0.385 ± (Tm), is reported. This correlation agrees with Egami’s suggestion [14]. The prediction of Tg from Tm through the relationship Tg = 0.385 ± (Tm) has been tested using experimental data obtained on a large number of MGs. This relationship can be used to predict and design MGs with a desired Tg. Therefore, in this paper we are also use this correlation for determine the Tg using melting point of materials. The calculated glass transition temperature (Tg)
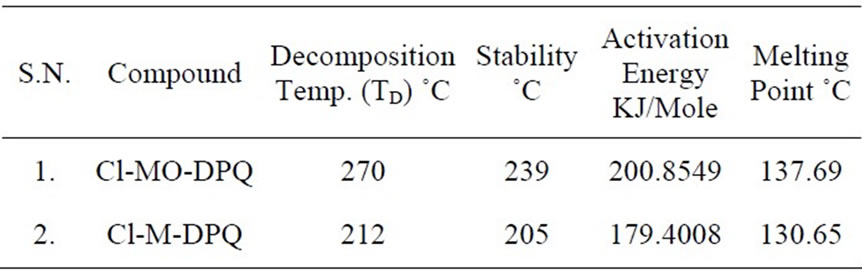
Table 2. Thermal data of Cl-MO-DPQ and Cl-M-DPQ.
of prepared Chlorine-Methoxy (Cl-MO-DPQ) and Chlorine-Methyl (Cl-M-DPQ) materials are 53.01 (±0.385)˚C and 50.30 (±0.385)˚C, respectively.
4. Conclusions
We synthesized a novel series of blue emitting derivatives of DPQ in nearly quantitative yield. The new monomers were synthesized by attaching a ChlorineMethoxy and Chlorine-Methyl to the main chain of DPQ. The Fourier Transform Infrared (FT-IR) technique has brought significant practical advantages to infrared spectroscopy. It has made the use of infrared analysis virtually limitless. This conform the methoxy and methyl group of DPQ. The Cl-MO-DPQ and Cl-M-DPQ exhibited good solubility in several solvents such as chloroform, dichloromethane, tetrahydrofuran (THF), formic acid (FA), acetic acid, etc. Both the compounds show strong blue emission under UV source in different solvents showing good solubility in acidic and basic media. Thus, the excellent solubility of these polymers is useful as potential candidates for practical applications. The UV-vis absorption spectra could provide a good deal of information on the electronic structures of the polymeric compound. PL spectra of Cl-MO-DPQ and Cl-M-DPQ show very strong emission at 440 nm and 442 nm with same excitation at 365 nm.
These are more stable, have high thermal stability, sharp melting point and emit intense blue color. Intensive studies on organic semiconductors are used commercially in display and lighting applications as organic lightemitting diodes (OLEDs) or transistors, and they progress to enter the solar cell market. As a result, interest in the science behind this novel class of materials has risen sharply.
REFERENCES
- W. Zhang, B. Yang, P. Lu, M. Li, L. L. Tian and Y. G. Ma, “Optical and Electron-Deficient Properties of Poly [2, 7-(9, 9-Dihexylfluorene)-Co-Bi-Pyridine]: A Combined Experimental & Theoretical Study,” Synthetic Metals, Vol. 158, No. 5, 2008, pp. 194-199. doi:10.1016/j.synthmet.2007.12.017
- G. Y. Park and Y. Ha, “Red Phosphorescent Iridium (III) Complexes Containing 2, 3-Diphenylquinoline Derivatives for OLEDs,” Synthetic Metals, Vol. 158, No. 3-4, 2008, pp. 120-124. doi:10.1016/j.synthmet.2007.12.010
- L. Y. Chiang, J. W. Swirczewski, F. Lai and D. P. Goshorn, “New Chemistry to the Synthesis of Quinoline Oligomers ann a CVD Technique for High Temperature Conducting Thin Films,” Synthetic Metals, Vol. 41, No. 1-2, 1991, pp. 1425-1431. doi:10.1016/0379-6779(91)91870-G
- J. A. Osaheni and S. A. Jenekhe, “Effects of Molecular Structure on the Electro Active & Optical Properties of Conjugated Rigid-Rod Poly (Benzobisazoles),” Chemistry of Materials, Vol. 7, No. 4, 1995, pp. 672-682. doi:10.1021/cm00052a011
- C. Adachi, T. Tsutsui and S. Saito, “Blue Light-Emitting Organic Electroluminescent Devices,” Applied Physics Letters, Vol. 56, No. 9, 1990, pp. 799-801. doi:10.1063/1.103177
- Analytic Jena AG, Analytical Solutions, Manual of Spectord 50, Germany. http://www.analytikjenauk.co.uk/pdf/molecular%20spectroscopy/Specord%20series.pdf
- Manual FTIR-8101 model SHIMADZU. http://www05.abb.com/global/scot/scot205.nsf/veritydisplay/75c6fbdb8c2e824085256cc4004bb1ad/$file/imz8557%20rev%201-2%20ft-ir%20reference%20manual.pdf
- Manual PANalytical’s X1pert Research Diffractometer. http://www.panalytical.com/index.cfm?sid=76
- Manual METTLER STAR e-TGA/SDTA Spectrometer. http://www.docstoc.com/docs/57983272/Users-Guide-for-theMettler-TGAsDTA-851e
- L. D. Lu and S. A. Jenekhe, “Poly (vinyl diphenylquinoline):
 A New pH-Tunable Light-Emitting and ChargeTransport Polymer Synthesized by a Simple Modification of Polystyrene,” Macromolecules, Vol. 34, No. 18, 2001, pp. 6249-6254.
 - J. Hou, L. Huo, C. He, C. Yang and Y. Li, “Synthesis and Absorption Spectra of Poly[3-(phenylenevinyl)thio-phene]s with Conjugated Side Chains,” Macromolecules, Vol. 39, No. 2, 2006, pp. 594-603. doi:10.1021/ma051883n
- J. W. Nicholson, “The Chemistry of Polymers,” 3rd Edition, RSC Publication, London, 2006.
- Z. Lu and J. Li, “Correlation between Average Melting Temperature and Glass Transition Temperature In Metallic Glasses,” Applied Physics Letters, Vol. 94, No. 6, 2009, pp. 061913-061914. doi:10.1063/1.3081028
- T. Egami, “Magnetic Amorphous Alloys: Physics and Technological Applications,” Reports on Progress in Physics, Vol. 47, No. 12, 1984, p. 1601. doi:10.1088/0034-4885/47/12/002