Applied Mathematics
Vol.5 No.12(2014), Article
ID:47390,9
pages
DOI:10.4236/am.2014.512173
Self-Similarities of Pulmonary Arterial Tree and a New Integrated Model of Pulmonary Circulation with the Name of Fractal Phasic Perfusion (FPP) Model
Kyongyob Min
Respiratory division, Department of Internal Medicine, Itami City Hospital, Itami, Japan
Email: in1007@poh.osaka-med.ac.jp
Copyright © 2014 by author and Scientific Research Publishing Inc.
This work is licensed under the Creative Commons Attribution International License (CC BY).
http://creativecommons.org/licenses/by/4.0/


Received 17 January 2014; revised 1 March 2014; accepted 9 March 2014
ABSTRACT
Pulmonary arterial hypertension (PAH) has become an important topic of basic and clinical research in recent years. Morphologic researches have shown that specific PAH-lesions are located in the lobular small muscular arteries and correlate with hemodynamic measurements. However, it still remains to be shown how pathological changes of the small arteries in the lobule develop to PAH. Based on both fractal properties of pulmonary arterial tree and asynchronous phasic contractions of lobular arterial muscles under the evenness of the pulmonary capillary pressure (PCP) in the lung, the author has constructed an integrated model of pulmonary circulation which has produced a mathematical relationship between the mean pulmonary arterial pressure (MPAP) and the cardiac output (CO). By use of the expression between MPAP and CO, it has been able to explain the pathogenesis of PAH in terms of statistical changes among regional and temporal perfusions in the lung. In order to detect clinically the early stage of PAH, the author has suggested that it is important to establish the pulmonary functional imaging of regional and temporal perfusions.
Keywords:Pulmonary Arterial Hypertension, Weibel’s Number, Fractal Arterial Tree, Asynchronous Contractions of Arterioles, PAP Decay Curve

1. Introduction
Pulmonary arterial hypertension (PAH) is a rare condition but has now become an important topic of basic and clinical research because both have led to an ongoing development of specific medical therapies improving symptoms and stabilizing the patient. This rise in interest is partly due to the fact that pulmonary vascular remodeling with pulmonary hypertension is often encountered in various chronic lung diseases including collagen vascular lung diseases [1] . The morphologic study of diseased lungs from patients with PAH represents an important landmark on the chart of pathophysiologic concepts. Characteristic lesions in lungs of patients with PAH do not concern the larger pulmonary arteries of elastic type, but that typical obliterating PAH-lesions are found in pre-acinar and intra-acinar small arteries. Recently, Stacher and coworkers presented a large analysis of 62 PAH cases and 28 control subjects with systemically sampled lung tissue obtained at the time of lung transplantation, concluding also that the intima and intima plus media fractional thicknesses of small arteries were increased in the PAH group versus the control lungs and correlated with pulmonary hemodynamic measurements [2] .
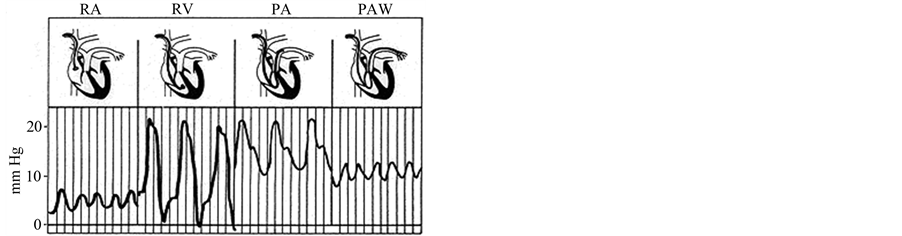
Hemodynamic measurements of pulmonary circulation are usually measured with a triple lumen balloontipped thermodilution fluid-filled catheter (Figure 1) [3] [4] . The catheter is inserted into a central vein and floated through the right heart chambers into the pulmonary artery under constant pressure wave monitoring. Pulmonary vascular pressures including the mean pulmonary arterial pressure (MPAP) are measured in the pulmonary arterial trunk when the lungs are at functional residual capacity. Therefore there seems a great difference in the levels between the sites of pathological arterial lesions and of MPAP measurements. To translate these morphologic observations into hemodynamic measurements in clinical practices concerning both early detection of PAH and accurate monitoring of effectiveness of therapy, it seems necessary to answer the basic problem how pathological changes of the small arteries make increase in MPAP.
In this study, I have proposed a new integrated model of pulmonary circulation named “Fractal Phasic Perfusion (FPP) model” based on the fractal properties of elastic pulmonary arterial tree and asynchronous phasic contractions of lobular arterial muscles which regulate corresponding lobular perfusion under the evenness of the pulmonary capillary pressure (PCP) in the lung. By use of FPP model, I have proposed a statistical mechanism of increase in MPAP in subjects with pre-acinar and intra-acinar arterial lesions. In order to understand the development of pulmonary hypertension in pulmonary arterial diseases, I have also suggested the necessity of pulmonary functional images representing regional and temporal distribution of perfusions in the lung.
2. Assumptions
2.1. Self-Similarities of Pulmonary Vascular Structure and Fractal Power Laws
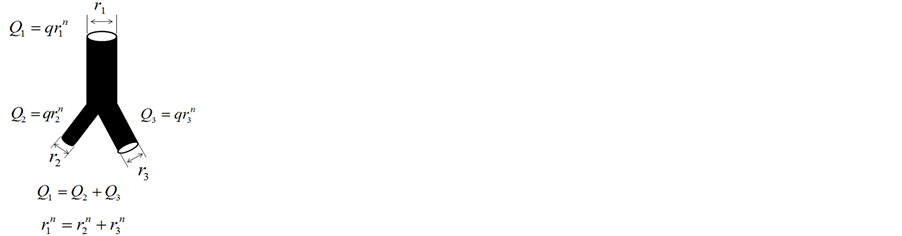
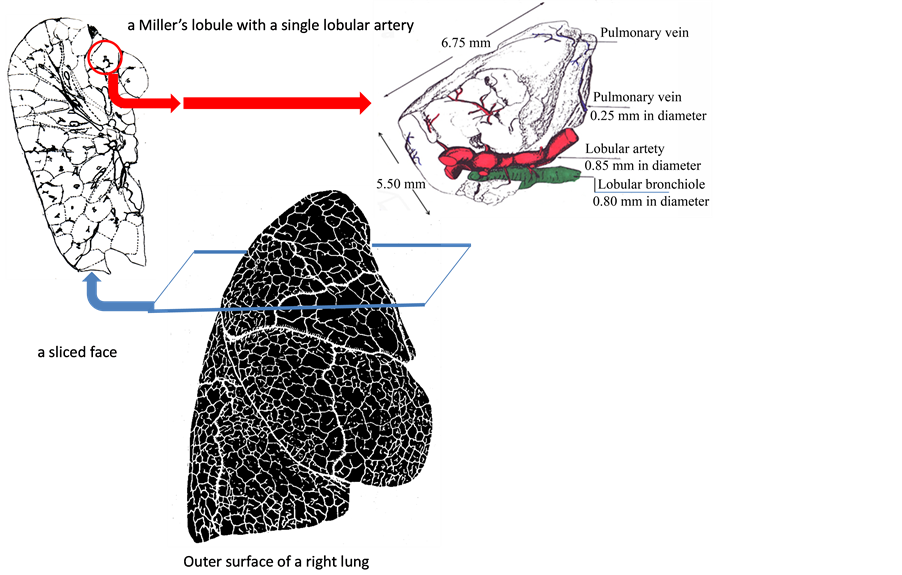
The pulmonary lobes are composed of many lobules (Miller’s secondary lobules, Figure 2), which are integrated into the whole lung by the pulmonary arterial tree (PAT) accompanying with the bronchial tree (BT). By applying the rules of integration to PAT with BT, we assumed a power relationship between the diameters at a bifurcation ( ,
,  , and
, and ) in Figure 2(a), as follows:
 . Biologists with an interest in the self-similarities of biological branching structures including PAT have found Horton’s branching law to be applicable to PAT [5]
 (a)
(a) (b)
(b)
Figure 1. Catheter measurements of Cardiac and Pulmonary Arterial Pressure and An example of the PAP decay curve after balloon occlusion. (a) The pulmonary arterial catheter provides successive measurements of a right atrial pressure (RAP), a right ventricular pressure (RVP), a pulmonary arterial pressure, and an occluded PAP; (b) Analysis of the pressure transient after pulmonary arterial occlusion for the estimation of pulmonary capillary pressure (PCP) either by the intersection of the fast and the slow components of the PAP decay curve, or by the extrapolation of the exponential fitting of the slow component of the PAP decay curve to the moment of occlusion (modified from ref. [4] ).
 (a)
(a)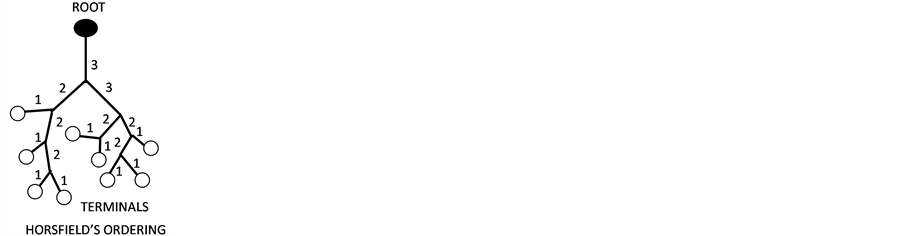 (b)
(b)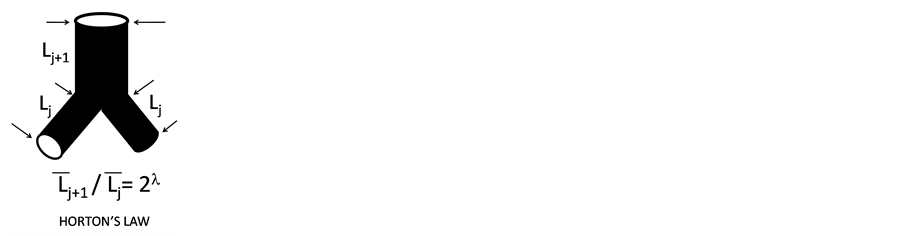 (c)
(c)
Figure 2. Fractal properties of Pulmonary Arterial Tree. (a) The diameter of a mother branch (r1) is related to those of daughter branches (r2 and r3) by a certain power (n) at every branching point; (b) In Horsfield’s ordering system, the first edge starts from the terminal, and when the edges of order j and order k come together at a vertex, the third edge is assigned to one order greater than the greater of j and k, or to j + 1 if j = k; (c) There is the selfsimilarity of branching known as a statistical law of Horton among branches with Horsfield ordering. Horsfield’s version of Horton’s law implies a geometrical self-similarity (modified from ref. [5] ).
[6] . They implemented Horsfield’s version of Horton’s branching law as another assumption as follows:
 (constant)
where  and
and  denote the mean length of a arterial branch of Horsfield’s order j and j + 1, respectively, as shown in Figure 2(b) and Figure 2(c).
Fluid dynamic parameters of the arterial tree as the conduit system are derived in power functions of the radius, including the fractal dimension in the exponents. Suwa and Takahashi [6] showed fluid dynamic relationships based on the fractal property in the length-radius relationship of various arterial branching including PAT as follows:

where  and
and  denote the mean length and diameter of the arterial branch of order j, respectively, and h is constant. Based on these assumptions, Suwa and Takahashi [6] measured a set of lengths and radii of a pulmonary arterial cast model of human and revealed the relation between powers i and n as follows:
 .Thus, self-similarities of PAT are summarized by a set of equations as follows,
 (1)
(1)
 (2)
(2)
 (3)
(3)
2.2. Asynchronous Phasic Perfusion of Lobules
Muscular artery or arterioles appear along the arterial branches of less than 2000 μm in diameter [7] . Thick bands of smooth muscle have been found in the wall of lobular artery, which regulates perfusion of corresponding lobule in time. Krahl directly observed asynchronous lobular perfusion through a window on the ribcage of rabbits in vivo [8] .
2.3. Evenness of Pulmonary Capillary Pressure (PCP)
Right heart catheterization with flow-directed balloon-tipped catheter measures successively the right atrial pressure (RAP), the pulmonary arterial pressure (PAP) and the occluded PAP (OPAP). Arterial occlusion creates a stop-flow condition. A measurement of pulmonary capillary pressure (PCP) can be obtained by the analysis of a PAP decay curve after balloon occlusion. A pressure decay curve is made of a first fast component which corresponds to the stop of flow through an arterial resistance, and a shorter component, which corresponds to the emptying of the compliant capillaries through a venous resistance. The intersection between the two components of the PAP decay curve offers an estimate of PCP (Figure 1) [4] . Measurements of PCP from the analysis of the PAP decay curve after balloon occlusion have showed the evenness of PCP in the whole lung [9] .
3. Results
3.1. Evenness of Pressure Drop along Fractal Tree
A simple physical law that governs laminar flows of Newtonian fluids of a viscosity constant η through thin nondistensible circular tube of L in length, states that a pressure drop  to flow Q is expressed by the equation as follows,
 . In the fractal tree of the pulmonary artery, the length of a branch Lj and the flow Qj are expressed by its corresponding diameter of rj as
 and
and 
where h and q are parameters which are able to be estimated by fractal analysis of pulmonary arterial tree (Equations (1) and (2)). Thus, the pressure drop ΔP along a branch is constant or even because of i + n = 4 as follows,
 (4)
(4)
3.2. Grouping of Lobules by Weibel’s Number
It is generally accepted that the pattern of branching of the pulmonary artery closely follows that of bronchial tree down to the lobular branch [7] . Thus, each lobular branch of artery can be numbered according to accompanying bronchial generation of Weibel (the branching number from the trachea of zero) [10] . When a lobule is supplied by a lobular artery of Weibel’s number w, the pressure in the lobular artery (Pl) is expressed by the equation as follows,  because of the evenness of pressure drop (Equation (4)). If a PAP decay curve can be obtained by arterial occlusion at the lobular artery, an additional Weibel’s number w’ in the lobule would be obtained as follows,
 . Therefore, the simple relationship has been obtained among PAP, PCP, w and w' as follows,
 (5)
(5)
where x = w + w' is named the modified Weibel’s number. It is important to note that the parameter w is determined by the pattern of branching of elastic arterial tree, and that the parameter w' correlates with pathological conditions of intra-lobular muscular arterioles as well. Thus, grouping the lobules by x can characterize the anatomico-pathological conditions of arteries including intra-lobular arterioles.
3.3. Pulmonary Arterial Flow and Phasic Lobular Perfusions
The pulmonary arterial flow is measured as Q(t) at the time of t, when we can see lobular perfusions in the number of s(t) and the relation is . When x is assigned for each lobular perfusion, the flow Q(t) is rewritten by the following,
 (6)
(6)
where sx(t) is the number of lobules with x where we can see a perfusion at the time of t. It is important to note that each lobule is characterized with both x and a duration time of perfusion (tx) during observation (Figure 3).
3.4. Relationship between MPAP and CO
Pulmonary vascular pressures and flows are usually measured with triple lumen balloon-tipped thermodilution fluid-filled catheter. The catheter is inserted into a central vein and floated through the right heart cambers into the pulmonary artery under constant pressure wave monitoring (Figure 2). The pulmonary arterial catheter provides successive measurements of a right arterial pressure (RAP), a right ventricular pressure (PVP), and a pul-
 (a)
(a)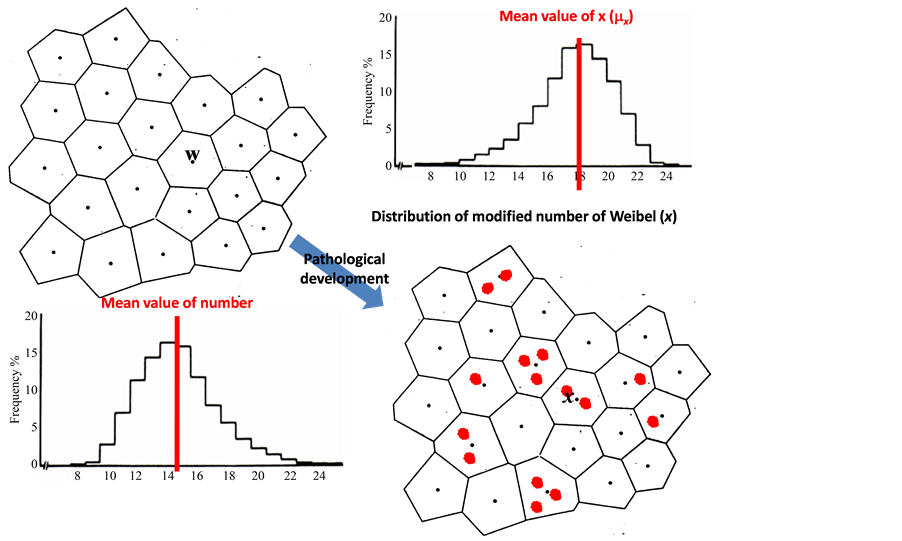 (b)
(b)
Figure 3. Distributions of Weibel’s numbers and Modified numbers. (a) The pulmonary lobes are composed of many lobules (Miller’s secondary lobules). Each lobular branch of artery can be numbered according to accompanying bronchial generation of Weibel (the branching number from the trachea of the number zero to the lobular bronchiole), then a Weibel’s number is assigned to each lobule; (b) Distribution of lobular numbers of Weibel would transform to another when preand intra-acinar lesions of arterioles emerged in a number of lobules.
monary arterial pressure (PAP), and an occluded PAP. Catheter measurements also provide pulmonary arterial pressure (PAP) and flow waves (Q). Based on the set of measurements of PAP and Q during a single stroked time (τ), the mean pulmonary arterial pressure (MPAP) has been obtained as following calculations according to Equation (5),
 (7)
(7)
where tx is the duration of perfusion seen in the lobules with x during the period of , and rxt indicates the correlation coefficient of variables x and tx, or the correlation of regional and temporal perfusions during a stroke. It is important to note that under phasic perfusions of lobule the variable x is a function of time (t). Then, MPAP is expressed by the following equation,
 (8)
(8)
where parameters such as ,
,  ,
,  ,
,  are the variations and the means of variables x and tx, respectively. N is the total number of lobules in the lung. Further, by use of Equation (6), the stroke volume (RSV) is expressed as follows,
 (9)
(9)
Then, by combination of the Equations (4), (8) and (9), the relationship between MPAP and the cardiac output (CO = RSV/τ) has been obtained as follows,
 (10)
(10)
This expression of Equation (10) is the “Fractal Phasic Perfusion (FPP)” model of pulmonary circulation.
4. Discussion
4.1. Single Fractal Dimension of Pulmonary Arterial Tree
This study has been carried out the assumption that pulmonary arterial tree is entirely prescribed by a single fractal dimension. A study has shown that it is not true in some cases, where the system appears to be ruled by two different dimensions for large and small diameters [11] . However, single fractal dimensions of pulmonary vascular structure have been reported by many studies for mammals including human [12] . In a recent through analysis of the pulmonary vascular trees conceived as fractal structures it has been shown that the fractal dimension of both elastic arteries and veins is about 2.7 [6] [13] .
4.2. High Flow and Low Pressure of Pulmonary Circulation
The pulmonary circulation is a high flow and low pressure circuit. This property of pulmonary circulation has been characterized by recruitment and distension of vascular tree. After observations of Krahl [8] , the lobular arterial muscle bundle has been recognized as a sphincter to regulate corresponding lobular perfusion. In fractal tree of the elastic pulmonary artery the diameter of a branch is related with corresponding flow through it, therefore the number of lobules supplied by the branch would determine the corresponding flow and its diameter as well. If a number of asynchronous phasic contractions of lobular arterial smooth muscles should appear simultaneously, the phenomena of recruitment and distention would be observed according to the pattern of simultaneous lobular perfusions. Thus, the recruitment and distension are recognizable as different faces of harmonized asynchronous contractions of lobular arterial muscles, which would show various regional patterns of pulmonary perfusion.
4.3. How to Verify the Effectiveness of FPP Model
Many cardiac and pulmonary diseases are associated with an abnormal increase in pulmonary arterial pressures (PAH) [1] and obliterating lesions of preand intra-acinar arteriolar lesions have been found in patients with PAH. However, it is still unknown how these lesions in the lobule develop to PAH. According to FPP model of this study, the obliterating lesions of the intimal layer of arterioles in a lobule make the number of x higher, and the distribution of x would change higher in its mean or variation (Figure 3), then MPAP would increase according to Equation (10). The variation coefficient of (σx/μx) in Equation (10) could be estimated from the fluctuation of PAP because that PAP is dependent on the variable x in Equation (5), that is
 (11)
(11)
Heart and pulmonary arterial (Ventriculo-arterial) coupling is recognizable through a pressure-flow (PAP-Q) relationship [4] . In the case of FPP model, PAP-Q loop can be translated into the relationship between variables x and tx in the lung (Figure 4). The correlation coefficient rxt is recognizable by the ratio of the area in the PAP-Q loop (ALoop) to the area of PAP-Q square (ASquare) by using the following equation,
 (12)
(12)
The ratio of ALoop/ASquare indicates the efficiency of energy transmission through elastic pulmonary arterial tree from the right cardiac ventricle to pulmonary parenchyma.
The variation coefficient of distribution in regional perfusion  is not able to estimate from the physiological measurements but only from the functional images of regional and temporal perfusion in the lung. New active researches have begun to develop and utilize advanced imaging technology in order to measure regional and temporal changes of perfusion in the lung [14] . Further advances in technology to measure regional
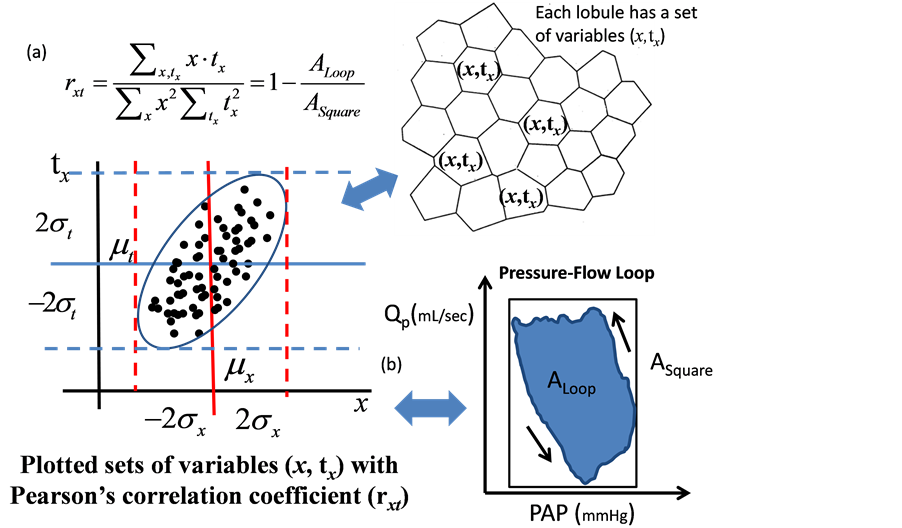
Figure 4. An image of distributed perfusions in the lung. (a) Each lobule is characterized by both the corresponding number of modified Weibel, x and the perfusion time (tx); (b) Both the pulmonary arterial pressure (PAP) and the pulmonary arterial flow (Q) are able to be described by the distribution of perfusion times (tx) based on each modified Weibel’s number of lobule (x). By use of a reconstructed PAP-Q loop, the correlation ratio is able to be estimated as [rxt = 1 − the areas in the PAP-Q loop (ALoop)/the area in the PAP-Q square (ASquare)].
and temporal perfusions of the lung concerning would be able to estimate the distribution of perfusion in the whole lung, and we hope to get it in coming years. When we can estimate the distribution of regional perfusions through new functional images, the effectiveness of FPP model would be verified by comparison among physiological measurements (PHYS), imaging measurements (IM), and pathological measurements (PATH) through the equation of FPP as follows,
 (13)
(13)
where PATH, PHYS and IM are estimated by the following equations,
 (14a)
(14a)
 (14b)
(14b)
 (14c)
(14c)
4.4. Conclusion
Morphologic researches on pulmonary arterial hypertension have shown that specific PAH-lesions are located in the lobular small muscular arteries and correlate with hemodynamic measurements. However, there has been a great gap of understanding between pathological lesions and hemodynamic measurements in PAH subjects. Based on both fractal properties of pulmonary elastic arterial tree characterized by power laws and asynchronous phasic shifted contractions of lobular arterial muscles under the evenness of the pulmonary capillary pressure (PCP) in the lung, I have constructed an integrated model of pulmonary circulation (“Fractal Phasic Perfusion” model) which has produced a mathematical relationship between the mean pulmonary arterial pressure (MPAP) and the cardiac output (CO). By use of FPP, it has been able to suggest the close relationship among physiological, pathological and imaging measurements in PAH subjects. Thus, this study would provide a clue to bridge over the gap of understanding in pathological and physiological pulmonary hypertension through functional pulmonary imaging, and also a clue to detect clinically the early stage of pathological PAH.
References
- Simonneau, G., Robbins, I.M., Beghetti, M., Channick, R.N., Delcroix, M., Denton, C.P., Elliott, C.G., Gaine, S.P., Gladwin, M.T., Jing, Z.C., et al. (2009) Updated Clinical Classification of Pulmonary Hypertension. Journal of the American College of Cardiology, 54, S43-S54. http://dx.doi.org/10.1016/j.jacc.2009.04.012
- Stacher, E., Graham, B.B., Hunt, J.M., Gandjeva, A., Groshong, S.D., McLaughlin, V., Jessup, M., Grizzle, W.E., Aldred, M.A., Cool, C.D. and Tuder, R.M. (2012) Modern Age Pathology of Pulmonary Arterial Hypertension. American Journal of Respiratory and Critical Care Medicine, 186, 263-272. http://dx.doi.org/10.1164/rccm.201201-0164OC
- Swan, H.J.C., Ganz, W., Forrester, J.S., Marcus, H., Diamond, G. and Chonette, D. (1970) Catheterization of the Heart in Man with Use of a Flow-Directed Catheter. The New England Journal of Medicine, 283, 447-451. http://dx.doi.org/10.1056/NEJM197008272830902
- Naeije, R. (2011) Pulmonary Vascular Function. In: Peacock, A.J., Naeije, R. and Rubin, L.T., Eds., Pulmonary Circulation, 3rd Edition, UK, 3-25.
- Min, K., Hosoi, K., Kinoshita, Y., Hara, S., Degami, H., Takada, T. and Nakamura, T. (2012) Use of Fractal Geometry to Propose a New Mechanism of Airway-Parenchymal Interdependence. Open Journal of Molecular and Integrative Physiology, 2, 14-20. http://dx.doi.org/10.4236/ojmip.2012.21003
- Suwa, N. and Takahashi, T. (1971) Morphological and Morphometrical Analysis of Circulation in Hypertension and Ischemic Kidney. Urban & Schwarzenberg, Muenchen.
- Elliott, F.M. and Reid, L. (1965) Some New Facts about the Pulmonary Artery and Its Branching Pattern. Clinical Radiology, 16, 193-198. http://dx.doi.org/10.1016/S0009-9260(65)80042-3
- Krahl, V.E. (1963) A Method of Studying the Living Lung in the Closed Thorax, and Some Preliminary Observations. Angiology, 14, 149-159. http://dx.doi.org/10.1177/000331976301400401
- Cope, D.K., Grimbert, F., Downey, J.M. and Taylor, A.E. (1992) Pulmonary Capillary Pressure: A Review. Critical Care Medicine, 20, 1043-1056. http://dx.doi.org/10.1097/00003246-199207000-00024
- Weibel, E.R. and Gomez, D.M. (1962) Architecture of the Human Lung—Use of Quantitative Methods Establishes Fundamental Relations between Size and Number of Lung Structures. Science, 137, 577-585. http://dx.doi.org/10.1126/science.137.3530.577
- Matuo, T., Okeda, R., Takahashi, M. and Funata, M. (1990) Characterization of Bifurcating Structures of Blood Vessels Using Fractal Dimensions. Forma, 5, 19-27
- Kamiya, A. and Takahashi, T. (2007) Quantitative Assessments of Morphological and Functional Properties of Biological Trees Based on Their Fractal Nature. Journal of Applied Physiology, 102, 2315-2323. http://dx.doi.org/10.1152/japplphysiol.00856.2006
- Ochs, M. and Weibel, E.R. (2008) Functional Design of the Human Lung for Gas Exchange. In: Fishman, A.P., Ed., Fishman’s Pulmonary Dieases and Disorders, 4th Edition, McGraw-Hill, Boston, 23-69.
- Patz, S., Hatabu, H., Butler, J.P., Washko, G., Choi, A., Rosas, I., Muradyan, I., Lisitza, N. and Dabaghyan, M. (2013) Mission of the Center for Pulmonary Functional Imaging. cpfi.spi.havard.edu