Advances in Bioscience and Biotechnology
Vol.4 No.5(2013), Article ID:32276,9 pages DOI:10.4236/abb.2013.45087
The action of ethanol on G protein. In silico and cellular/molecular evidences
![]()
1Departamento de Ciencias Biologicas, Facultad de Ciencias Biologicas, Universidad Andres Bello Sede Concepcion, Talcahuano, Chile
2Departamento de Bioquimica y Biologia Molecular, Facultad de Ciencias Biologicas, Universidad de Concepción, Concepcion, Chile
3Universidad Nacional Autonoma de Mexico, Centro de Nanociencias y Nanotecnologia, Ensenada, Mexico
4Laboratorio de Virus Oncológicos en Reproducción, BIOREN-CEGIN, Universidad de La Frontera, Temuco, Chile
Email: *xromo@unab.cl
Copyright © 2013 Pamela Fernandez et al. This is an open access article distributed under the Creative Commons Attribution License, which permits unrestricted use, distribution, and reproduction in any medium, provided the original work is properly cited.
Received 28 March 2013; revised 1 May 2013; accepted 21 May 2013
Keywords: Alcoholism; Ethanol; Glycine Receptor; G Proteins; Signals Transduction
ABSTRACT
Ethanol (EtOH) enhances glycinergic currents in the central nervous system (CNS). Because evidence for an interaction between the α1 subunit of the glycine receptor (α1GlyR) and the G protein Gβγ subunit exists in vitro and because cAMP levels are known to increase in response to EtOH, we wanted to investigate the interaction between Gβγ and α1GlyR in response to EtOH treatment in HEK293 cells and to explore the possible sites of interaction between EtOH and the Gαs subunit. His pull-down assays in GlyRHis6-transfected HEK293 cells incubated with ethanol or propofol revealed that only EtOH treatment increased the binding of Gβγ heterodimers to α1GlyR. Using molecular modelling (protein structure prediction), was modelled the hGαs protein for the first time and validated this model by site-directed mutagenesis. By molecular docking, we identified some potential regions of interaction between hGαs and EtOH that are located on the SIII and SI regions of the Gαs. Therefore, we conclude that ethanol increases the interaction between α1GlyR and Gβγ in HEK293 cells, an effect that might be attributed to the interaction between EtOH and hGαs, which consequently stimulates hGαs.
1. INTRODUCTION
Ethanol (EtOH) is one of the most consumed drugs in the world [1]. EtOH acts specifically on many proteins [2] and as an inhibitory drug in the CNS by potentiating hyperpolarising currents [3]. The α1 subunit of the Glycine Receptor (a1GlyR) is an inhibitory receptor that is affected by EtOH. This is a selective channel for Cl− and is expressed within the spinal cord and within some regions of the brain [4]. Clinically relevant concentrations of EtOH (1 - 100 mM) are known to enhance glycinergic currents [5], increasing the rates of channel aperture.
There are currently two proposed mechanisms of action of EtOH on α1GlyR. In the first mechanism, EtOH directly interacts with a1GlyR [6,7], and in the second mechanism, the action of EtOH on a1GlyR is exerted indirectly through its effects on Gβγ [8]. Consistent with the first proposed mechanism, several studies have reported that mutations on S687 and A288 of α1GlyR can eliminate its responsiveness to 200 mM EtOH, suggesting that the binding sites for EtOH are specific amino acids located within the TM2 and TM3 regions of a1GlyR. Some studies have reported that mutations can dramatically alter the functional properties of a1GlyR [9]. The discovery that a1GlyR directly interacts with Gβγ has provided secondary supporting evidence for these findings [10,11]. The α1GlyR variants that are mutated in basic residues, which are considered key elements for the interaction between α1GlyR and Gβγ, were found to be insensitive to EtOH at clinically relevant concentrations (1 - 100 mM) [8]. In addition, the potentiation of glycinergic currents that are mediated by EtOH was reverted by the sequestration of Gβγ [11]. These findings are consistent with the notion that Gβγ mediates the effect of EtOH on the glycinergic currents.
Additional evidence supports the relationship between EtOH and hGαs. For example, increased cAMP levels, which subsequently activate PKA, have been observed in response to EtOH [12,13]. In addition, adenylyl cyclase VII has been identified as the most EtOH-responsive adenylyl cyclase [14,15] and has been shown to require Gαs and Gβγ for activation [16]. In addition, constitutively activated Gαs can increase the potentiation of α1GlyR in the presence of ethanol independently of cAMP concentrations [17]. Unpublished findings have shown that EtOH can activate both Gαs proteins in rat brain membranes and purified hGαs in vitro.
In this study, we investigated the binding between a1GlyR and Gβγ in response to EtOH, based on the findings mentioned above. Our results show that EtOH increases the binding of Gβγ bound to a1GlgR. Such increased binding does not result from treatment with the general anaesthetic propofol, which also potentiates glycinergic currents. The increased interaction between Gβγ and a1GlyR was more apparent in HEK293 cells that were treated with EtOH for short incubation times, because the interaction was attenuated after 5 min. According to these findings and subsequent molecular modelling, such as homology modelling and molecular docking techniques, we have identified five energetically favourable regions of interaction between hGαs and EtOH that are located within the SIII and SI and near to the Gβγ binding region of hGαs. The most energetically favourable interaction is between EtOH and N153 (Hydrogen bonding), N240 and V242 (Van der Waals interaction) of the hGαs protein.
2. MATERIALS AND METHODS
2.1. Cell Culture
HEK 293 cells were cultured using standard methodologies [8].
2.2. Transfection
HEK293 cells seeded at 80% confluence in 60-mm culture plates were transfected with Satisfection (Stratagene) according to the manufacturer’s protocol. For the transfection of α1GlyR-pCDNA3.1-HisC (αGlyR-His6) or a GFP-expressing plasmid (transfection control), we used 6 µg of plasmid per plate. The co-precipitation assays were performed 24 hrs after transfection.
2.3. Coprecipitation Assays (His-Pull Down)
Cells were lysed with 300 µL of lysis buffer per 60-mm plate (10 mM Tris-HCl, pH 7.4, 10 mM EDTA, 70 mM NaCl and 1X protease inhibitor cocktail (Calbiochem). Sixty-five micrograms of each protein lysate were incubated in a rotary incubator overnight at 4˚C with 20 µL of Ni2+-NTA resin (Invitrogen), which was previously equilibrated. Next, the tubes were centrifuged at 4000 rpm for 3 min at 4˚C. The resin was washed three times with wash buffer (10 mM Tris-HCl pH 7.4, 10 mM EDTA, 70 mM NaCl, 10 mM imidazole), and the bound proteins were then eluted from the resin by boiling in 20 μL of loading buffer for 5 min at 100˚C.
2.4. Western Blot
Each experiment was visualised by western blotting using an anti-α1GlyR antibody (1:500) (Synaptic Systems) to assess the α1GlyR expression, and an anti-Gβ antibody (1:1000) (Santa Cruz Biotechnology) to detect the interaction between Gβ and α1GlyR.
2.5. Site-Directed Mutagenesis
The site-directed mutagenesis of the hGs protein was performed using a commercial kit according to the manufacturer’s protocol (QuikChange™ Site-Directed Mutagenesis Kit, Stratagene), with H6pQE60-hGs as the template in each reaction. The following two pairs of primers were used (we only show the forward sequences): (a) N292A-Forward 5’-CTCTGTGATCCTGTTCCTCGCCAAGCAAGATCTGCTCGC-3’, (b) K293A-Forward 5’-CTCTGTGATCCTGTTCCTCAACGCGCAAGATCTGCTCGCTGAGAAAG-3’.
2.6. Protein Expression and Purification
The cultures previously transformed with H6pQE60-hGs reached an OD of 0.7 - 0.8 at 600 nm and the expression of the proteins was induced by the addition of 50 μM of isopropyl-β-D-thiogalactoside (IPTG) (Sigma-Aldrich). The cultures were incubated further at 30˚C overnight with constant agitation. The recombinant normal and mutant proteins were purified according to a previously described protocol with some modifications [18]. The protein-containing fractions were concentrated to 500 μL and were aliquoted and stored at –80˚C until further use.
2.7. Bodipy® FL-GTP-γ-S Exchange Assay
The effect of EtOH on the rate of GDP/GTP exchange of the wild type (wt) and mutant hGαs proteins was analysed using the Bodipy® FL-GTP-γ-S (B-GTPγS) exchange assay. Briefly, 0.2 mM of wt or mutant hGαs protein was incubated for 10 min at room temperature in reaction buffer (10 mM Tris-HCl, pH 8.0, 1 mM EDTA and 10 mM MgCl2). Next, we added 2 mM B-GTPγS. Lastly, the resulting fluorescence was measured at 2 min.
2.8. Homology Modelling
The three-dimensional structure of the hGαs protein, P63092 (GNAS2_HUMAN) was predicted by homology-based modelling using Modeller9v8. BLAST-P was used to identify the potential template structures for molecular modelling. The templates are in the Protein Data Bank (PDB) WEB page, with the PDB IDs 1TAG/3AH8 for inactive form. The protein models were validated using Anolea and Prochek.
2.9. Binding Site Prediction
Molecular modelling of the ligand-receptor interaction (human Gαs protein-ethanol) was performed using Autodock 4.2 software. All the torsion angles in the smallmolecule were set free to perform flexible docking. A 0.375 Å grid spacing was used for grid point generation. The maximum box size allowed by the software was set to cover the entire protein structure, and the docking parameters were set to default values. The final structures were clustered and ranked according to the AUTODOCK scoring function.
2.10. Statistical Analysis
The western blot results were scanned, quantified and analysed using Image J software. The data for the different functional parameters evaluated were expressed as the mean ± SEM. The data were analysed using GraphPad Prism 5.02 for Windows (GraphPad Software, San Diego, CA, USA). Differences between the groups were assessed using a one-way analysis of variance followed by Tukey’s multiple comparison tests. p-values ≤ 0.05 were considered as statistically significant.
3. RESULTS
3.1. Ethanol Increases the Binding of Gβγ to α1GlyR
The HIS pull-down assays using transfected HEK293 cells showed that in the absence of EtOH, exogenously expressed α1GlyR-His6 bound to small quantities of Gβγ (Figrues 1(a)-(c)). However, treatment of the HIS6- α1GlyR-transfected cells with increasing concentrations of EtOH (50, 75 and 100 mM) for different treatment times (30 sec, 1 min and 5 min) increased the amount of Gβγ bound to α1GlyR. After 30 sec of treatment with 100 mM EtOH, the quantity of Gβγ bound to α1GlyR increased 10-fold compared to the results obtained using control treatment (p < 0.05; Figure 1(a)). After 1 min of treatment with 100 mM EtOH, the quantity of Gβγ bound to α1GlyR increased 14-fold (p < 0.05; Figure 1(b)). Finally, after 5 min of treatment with 100 mM EtOH, the interaction increased approximately 6-fold compared to the results of the control treatment (p < 0.05; Figure 1(c)). Similar results were observed when the α1GlyRHis6-transfected cells were incubated with concentrations of 50 and 75 mM EtOH (Figures 1(a)-(c)). Cells incubated with EtOH for longer than 5 min exhibited reduced interactions between Gβ and GlyR, similar to the interaction levels observed in cells incubated without ligand (data not show).
3.2. Propofol Does Not Affect the Binding of Gβγ to α1GlyR
Because the general anaesthetic propofol, which is similar to EtOH, can also potentiate glycinergic currents, we sought to determine whether incubation of the transfected cells with propofol also affects the interaction between α1GlyR and Gβγ We did not find any significantly increased interaction between Gβγ and α1GlyR induced by different concentrations of propofol (1, 0.1 and 0.01 mM) for different incubation times (30 sec, 1 min and 5 min) (Figure 2).
3.3. hGαs Protein: A Three-Dimensional Structural Prediction
In our case, the percent identity of the target sequence was almost identical to that of the template (92% identity for the inactive form). Therefore, the resulting model can be considered a favourable approximation. We sought to establish the three-dimensional structure of hGαs bound to GDP because EtOH binds to the inactive (GDP-bound) form of the Gα protein in order to stimulate the nucleotide exchange. Figure 3(a) shows the GDP-bound structure of hGαs represented by an α-helix and a β-strand. The structure exhibits stereochemistry with Z score of –8.96 and 94.4% of amino acids in the permitted zones. This structure highlighted the presence of three flexible regions, termed switch regions (SI, SII and SIII), which undergo conformational changes in response to the binding of GTP [19,20]. The nucleotide-binding pocket is located at the interface of the domains of hGαs and is represented by pink spheres. Within the structure, the Cterminus of hGαs makes extensive contacts with GPCRs, [21,22]. Furthermore, the schematic representation shows the binding site of the hGαs subunit with the βγ subunit (black colour); this region consists of the N-terminus of the hGαs subunit and a switch II segment [19].
To validate the hGαs model, we analysed the interactions between GDP and hGαs, and we used site-directed mutagenesis to assess the key interactions of specific amino acids. We selected the amino acids N292 and K293 due to their direct interaction with GDP (Figure 3(a)).
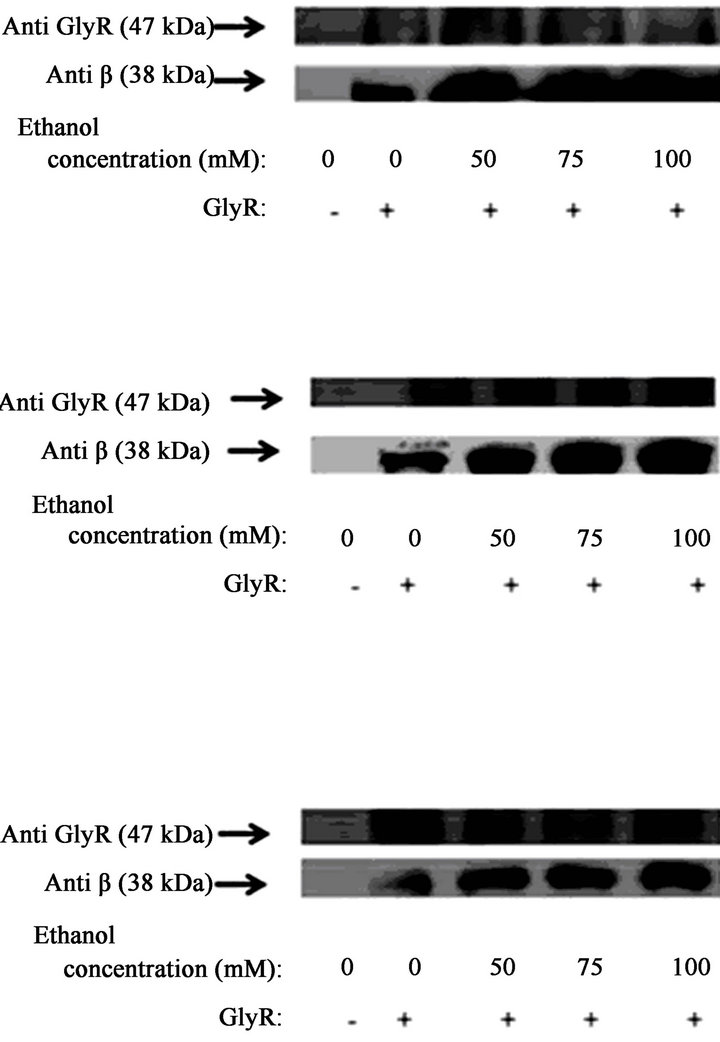
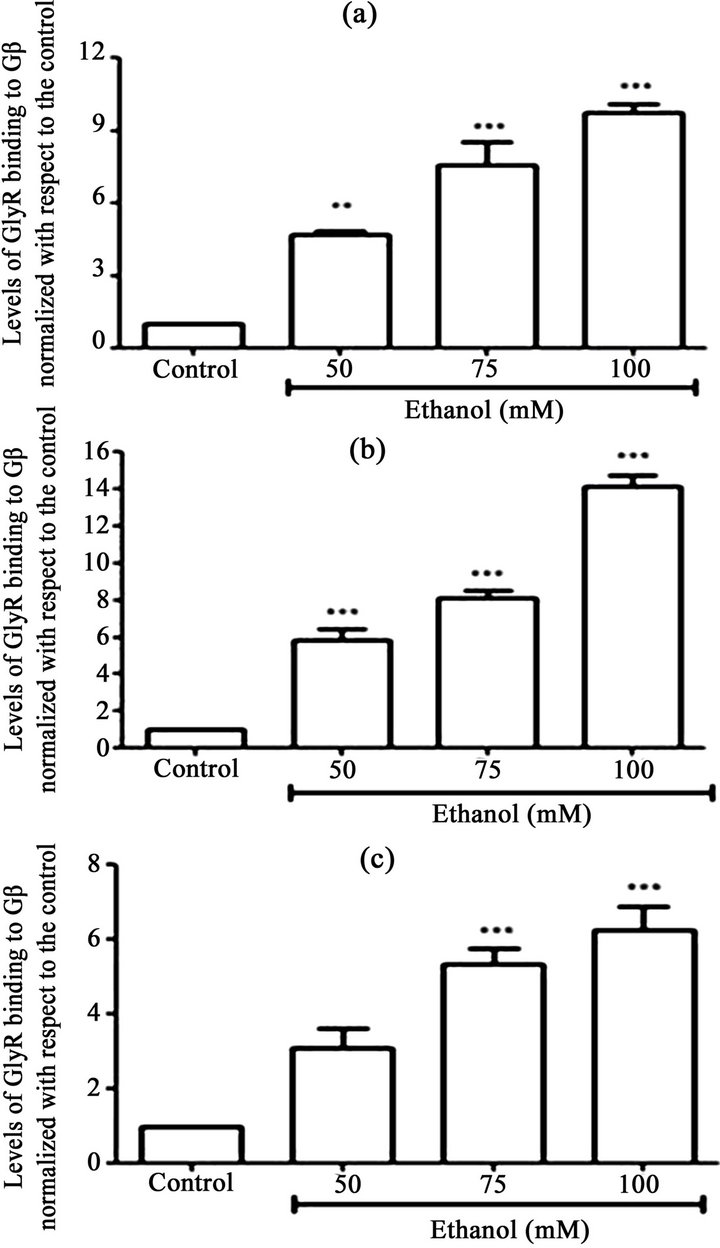
Figure 1. The effect of ethanol on Gb-GlyR binding. HEK293 cells were transfected with GlyR-His6 (6 mg) using Lipofectamine and incubated with different concentrations of ethanol (50, 75 and 100 mM). Untransfected cells were used as controls. The data show that the effect of ethanol on Gb-GlyR binding after 30 s (a), 1 min (b) and 5 min (c) incubation with ethanol. (Right) Western blot analysis and (left) the levels of Gb-GlyR binding. The results shown are the mean values ± SD (n = 3). Significant difference (p < 0.05).
We mutated both amino acids to A in order to abrogate the nucleotide-protein interactions. In this way, we analysed the exchange of GDP/B-GTPγS (a fluorescent analogue of GTPγS, which increases its fluorescence once bound to a protein). Next, we compared the basal nucleotide exchange rate between wild type hGαs with mutant hGαs proteins. As shown in Figure 3(b), the N292A and K293A mutants exhibited reduced B-GTPγS binding by approximately 6-fold compared to hGαs wt, which is similar to the decreased fluorescence exhibited by denatured proteins (Figure 3(b)).
3.4. Binding Site Prediction
According to our molecular docking simulation results, we observed that ethanol exhibits its highest affinity for the SIII region of Gαs at –6.03 kcal·mol–1 (Table 1, Figure 4). Indeed, the highest ranked system interaction with ethanol involves a hydrogen bond with N167 (2.24 Å) and two van der Waals interactions with N254 and V256 (Figrue 4). The site with the second highest affinity (–5.72 kcal·mol–1) was found within the SI region, involving a hydrogen bond with R199 (2.63 Å) and Van der Waals interactions with L296. In the third ranked observed that ethanol interacts with W234 via a hydrogen bond; this residue is located within the βγ binding region of Gαs. For the next ranked position, ethanol exhibited van der Waals interactions with F208 and K211, with an interaction free energy of –5.59 kcal·mol–1 located within the SI region. For the last ranked position, the ethanol exhibited a weak hydrogen bond with S205 (3.09 Å) and van der Waals interactions with L203. These residues are also located within the SI region, with an interaction free energy of –5.57 kcal·mol–1.
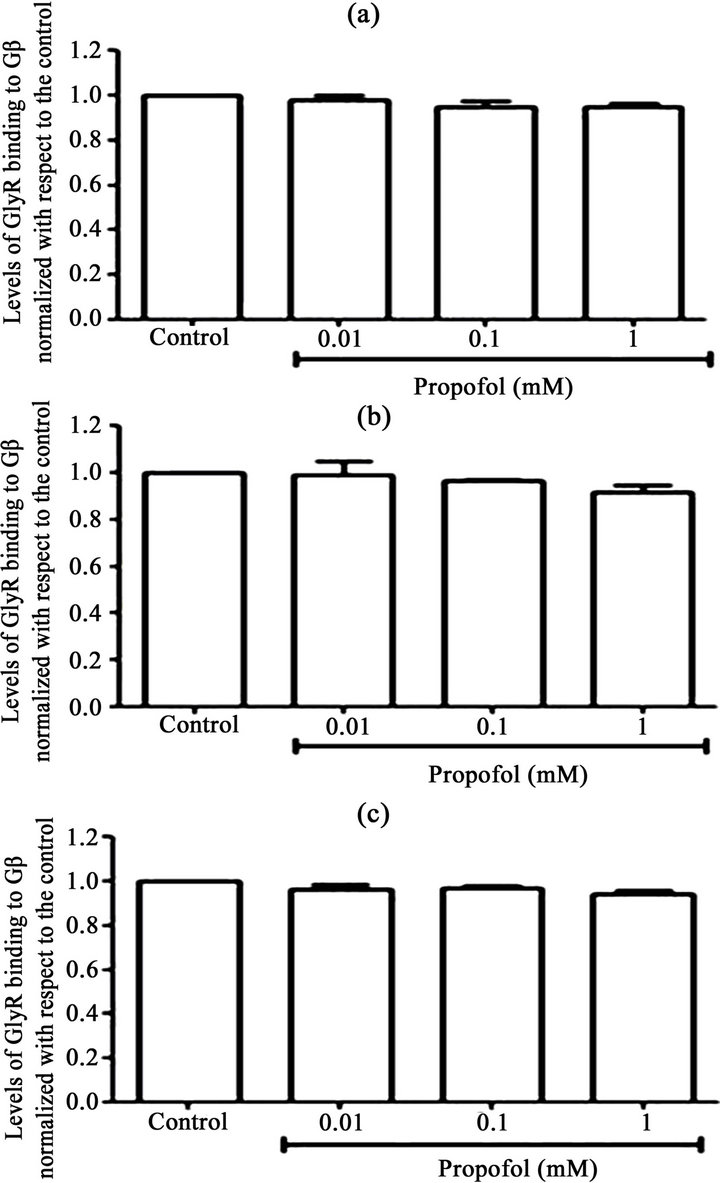
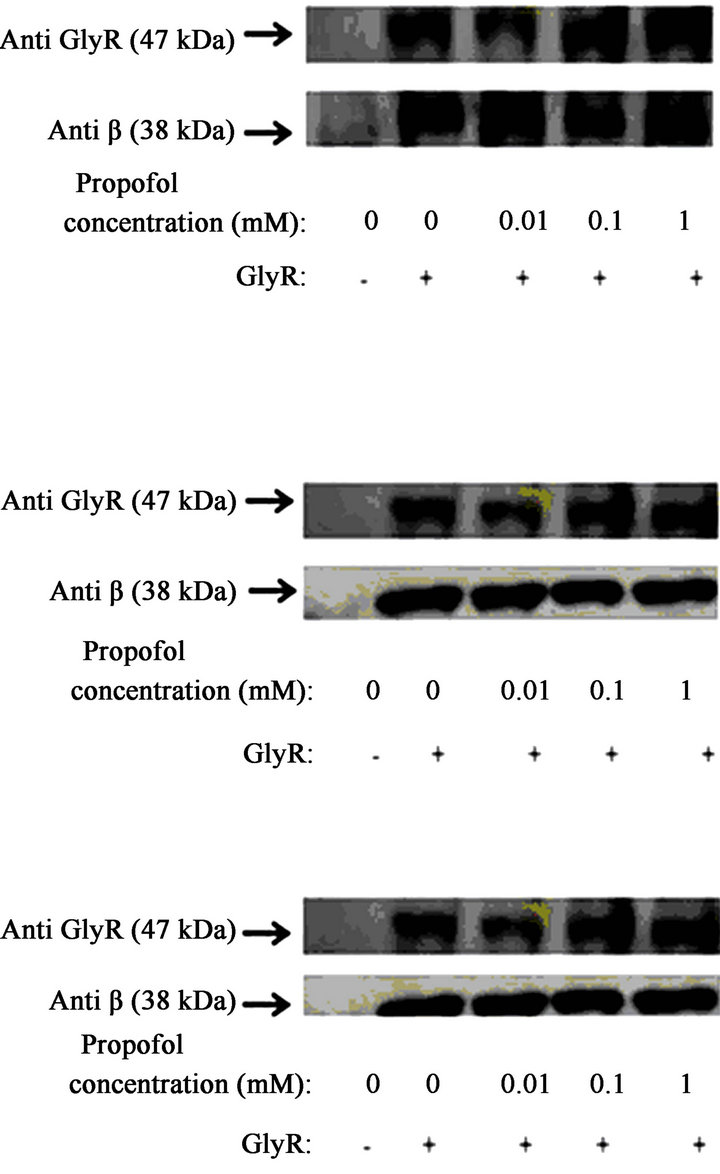
Figure 2. The effect of propofol on Gb-GlyR binding. HEK293 cells were transfected with GlyR-His6 (6 mg) using Lipofectamine and were incubated with different concentrations of propofol (0.01, 0.1 and 1 mM). Untransfected cells were used controls. The data show the effect of propofol on Gb-GlyR binding after 30 s (a), 1 min (b) and 5 min (c) incubation with propofol. (Right) Western blot analysis and (left) the levels of Gb-GlyR binding. The results shown are the mean values ± SD (n = 3). Significant difference (p < 0.05).
4. DISCUSSION
Determining the molecular mechanism of action of ethanol on inhibitory channels of the CNS is important for understanding how the effects of alcohol are elicited and for identifying therapies to help millions of people affected by alcoholism around the world. One of the inhibitory channels that is targeted by EtOH is GlyR, and the results of this study support our hypothesis that the effect of EtOH on α1GlyR is mediated by G proteins.
Our results showed a significant increase in the binding of Gβγ proteins to GlyR in cells treated with EtOH for short incubation times (Figures 1(a)-(c)). Those short times are consistent with electrophysiological studies performed by Yevenes et al. [4,11,23] in which very rapid effects were observed (1 - 6 sec) in the glycinergic currents that were enhanced by EtOH. Consistently, these enhanced currents were inhibited in EtOH-treated cells that were transfected with Gβγ scavengers [8]. Cells incubated with EtOH for longer than 5 min exhibited reduced interactions between Gβ and GlyR, similar to the interaction levels observed in cells incubated without ligand (data not show). The loss of this interaction might be attributed to desensitisation of the system after long EtOH incubation times; it might be necessary for Gβγ to bind to Gα to re-establish its heterotrimeric state. Conversely, the chemical characteristics of EtOH render this compound rapidly diffusible across the plasma membrane [24], such that the effects can be observed within seconds of EtOH treatment.
Exogenous α1GlyR expressed in HEK293 cells did not exhibit an increased binding to Gβ when the cells were incubated with the general anaesthetic propofol.
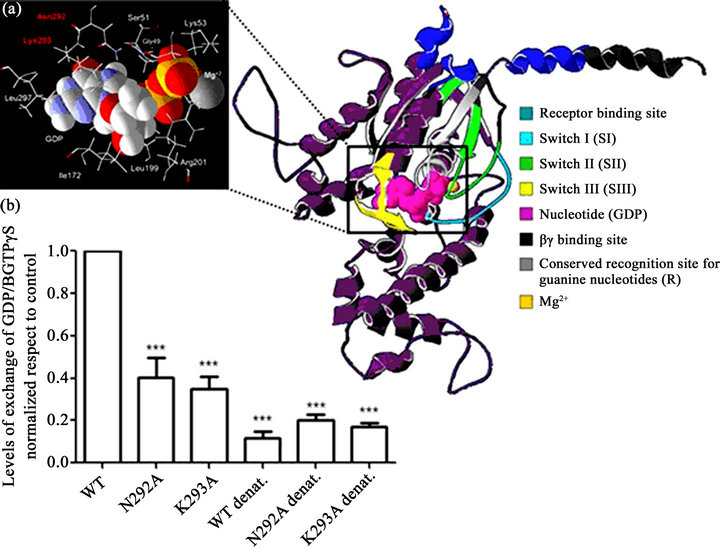
Figure 3. Human Gas protein: Three-dimensional structural prediction. (a) (Right) The hGas structure is displayed as a purple coloured ribbon diagram. The switch regions are coloured light blue (SI), green (SII) and yellow (SIII). The nucleotide (GDP) is represented by pink spheres and the cofactor by an orange sphere. (Left) A magnified view of the nucleotide-binding pocket. These data were prepared using VMD. (b) The effect of the N292A and K293A mutations on GDP/GTPgS exchange. The results were normalised with respect to the control (Wild Type, WT). The results shown are the mean ± SD (n = 3). Significant difference (p < 0.05).
This result is consistent with the general action of such anaesthetics on GlyR because the α1GlyR 385-386A mutants (which are unable to bind Gβγ) did not exhibit enhanced glycinergic currents during propofol pulse treatments [8], reinforcing the idea that the action of propofol as an anaesthetic is not exerted via G proteins. Remarkably, propofol is the most lipophilic, non-volatile general anaesthetic [25] and can therefore rapidly penetrate the plasma membrane. Thus, at incubation times similar to those used for EtOH, propofol treatment was sufficient to elicit effects at the levels of the plasma membrane.
Which Gα subunit is stimulated to increase the interactions between Gβγ subunit and α1GlyR in response to EtOH remains unknown. Ethanol simultaneously stimulates PKA and increases the cAMP levels. Thus, it is conceivable that EtOH might interact with Gs protein coupled receptors or directly with Gs heterotrimers, stimulating the GDP/GTP exchange rate of heterotrimeric Gs proteins and liberating the Gβγ heterodimers to interact with α1GlyR. EtOH is known to increase the basal exchange rate of GDP/GTPγS in purified Gαs protein (unpublished results). Therefore, by using informatics tools, we investigated the possible energetically favourable interaction sites between EtOH and Gαs that might activate the protein.
Because the hGαs protein structure had not yet been solved, we sought to model this protein. The modelled hGαs protein structure shown in Figure 3(a) has a Z score within the expected range for X-rays and NMRsolved protein structures. Consequently, our three-dimensional model could accurately to reflect the hGαs subunit structure. To ensure that the structure was optimal, we analysed the nucleotide-binding residues. We substituted specific amino acids that bind to the purine ring of the nucleotide (Figure 3(a)) in order to destabilise the bond and to inhibit GDP/GTPγS exchange. We chose the amino acid residues N292 and K293 because they are within the G-4 region of hGαs (the conserved region of all G proteins that directly interacts with the guanine ring of GDP and GTP) [19]. As shown in Figure 3(b), the recombinant protein loses its ability to exchange B-GTPγS when each amino acid is mutated,
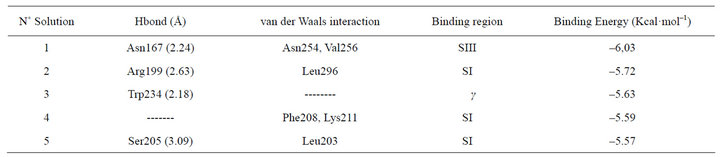
Table 1. hGas/EtOH docking results.
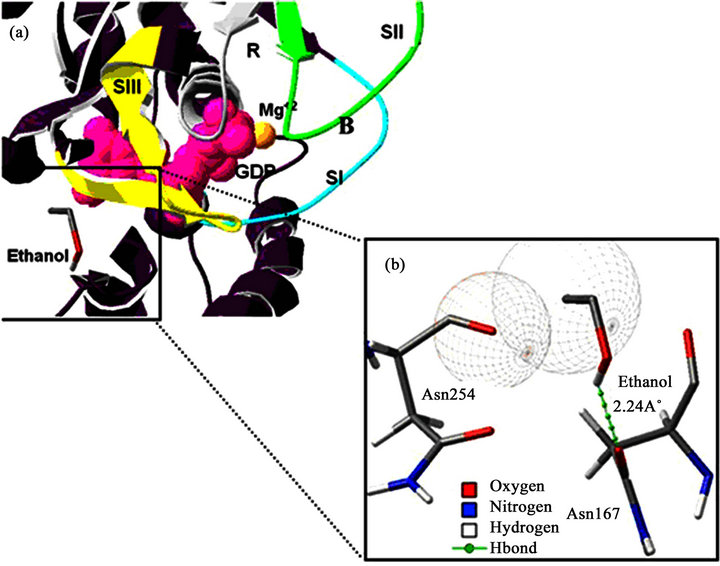
Figure 4. Ethanol-hGas binding site prediction. (a) The data shows the ethanol-hGas binding site energetically most favourable. The hGas structure is displayed as a purple coloured ribbon diagram. The switch region is coloured light blue (SI), green (SII) and yellow (SIII). The nucleotide (GDP) is represented by pink spheres and the Mg2+ by an orange sphere. The grey colour represents the recognition site for the guanine nucleotide (R). (b) A magnified view of the interaction of the protein with ethanol. The ethanol and the residues that interact (Asn254 and Asn167) are represented by the stick diagram and are coloured according to their atoms. The dotted green line represents the interaction involving an H-bond.
similar to the way that denaturation abrogates nucleotide exchange. These findings suggest that the mutation of these residues interfere with the binding of the nucleotide, supporting the validity of the model.
The results of our docking simulations were particularly important because the optimal interaction energies of the identified interaction sites between EtOH and hGαs coincide with the G protein switch regions (the parts of the protein that exhibit conformational changes after the Gα subunits convert from a GDP-bound inactive form to a GTP-bound active form) [19]. The most optimal interaction energy was –6.03 kcal·mol–1 (Table 1), with hydrogen bonds and van der Waals interactions with the amino acids N167, N254 and V256 (Figure 4), all of which reside within the switch III region (Table 1).
According to the three-dimensional structures obtained from crystallised Gαi, the switch II and III regions are ordered in Gαs-GTP and disorganised in Gαs-GDP. For this reason, we propose that the interaction between EtOH and hGαs-GDP induce a conformational change in the switch III region that facilitates the ordering of this region and the more efficient GDP/GTP exchange than in the absence of EtOH. Conversely, the other interaction site is within the switch I region that contains a Mg2+ binding site. The GDP-bound Gαs has little affinity for Mg2+. However, Mg2+ is very important for binding of GTP [19]. Thus, we propose that the EtOH interaction with the switch I region might stabilise Mg2+, stimulating the exchange of GDP/GTP. Our other docking results identified a region of interaction between Gβ and GlyR. The bond of EtOH with the nearest site of interaction between Gαs with Gβγ might destabilise the complex, liberating Gβγ from the Gαs subunit. Although the docking results have highlighted different interaction sites, we cannot exclude the possibility that EtOH has more than one interaction site with hGαs.
This study is important because we demonstrate that EtOH can increase the bond between Gβγ and αlGlyR in cells. To liberate Gβγ and to stimulate binding with α1GlyR, we have proposed possible sites of interaction between Gαs and EtOH that might activate this protein. This is the first time that an interaction between small molecules and G proteins has been shown to stimulate G proteins. Until now, proteins have only been known to act as GEFs (Guanine nucleotide Exchange Factors) on heterotrimeric G proteins (for example, RIC-8B is a GEF for Gs) [26-28].
5. ACKNOWLEDGEMENTS
We thank Dr. L. Aguayo for the plasmids, Dr. A. Oñate and Dr. L. Aguayo for providing facilities during the experiments, to Dr. L. Carvallo and Prof. H.Romo for helpful manuscript criticism, Dr. J. Martinez for his helpfull in bioinformatics. This work was supported by Fondecyt grant 11080174 (XR) and UNAB grant DI 22-12 R (XR).
REFERENCES
- Hunt, W.A. (1993) Neuroscience research: How has it contributed to our understanding of alcohol abuse and alcoholism? A review, Alcohol. Clinical and Experimental Research, 17, 1055-1065. doi:10.1111/j.1530-0277.1993.tb05664.x
- Harris, R.A., Trudell, J.R. and Mihic, S.J. (2008) Ethanol’s molecular targets. Science Signal, 1, re7. doi:10.1126/scisignal.128re7
- Howard, R.J., Murail, S., Ondricek, K.E., Corringer, P.-J., Lindahl, E., Trudell, J.R., et al. (2011) Structural basis for alcohol modulation of a pentameric ligand-gated ion channel. Proceedings of National Academy Science of the USA, 108, 12149-12154. doi:10.1073/pnas.1104480108
- Yevenes, G.E. and Zeilhofer, H.U. (2011) Allosteric modulation of glycine receptors. British Journal of Pharmacology, 164, 224-236. doi:10.1111/j.1476-5381.2011.01471.x
- Aguayo, L.G. and Pancetti, F.C. (1994) Ethanol modulation of the gamma-aminobutyric acidAand glycine-activated Cl-current in cultured mouse neurons. Journal of Pharmacology and Experimental Therapeutics, 270, 61- 69.
- Mihic, S.J., Ye, Q., Wick, M.J., Koltchine, V.V., Krasowski, M.D., Finn, S.E., et al. (1997) Sites of alcohol and volatile anaesthetic action on GABA(A) and glycine recaptors. Nature, 389, 385-389. doi:10.1038/38738
- Mascia, M.P., Trudell, J.R. and Harris, R.A. (2000) Specific binding sites for alcohols and anesthetics on ligandgated ion channels. Proceedings of National Academy Science of the USA, 97, 9305-9310. doi:10.1073/pnas.160128797
- Yevenes, G.E., Moraga-Cid, G., Peoples, R.W., Schmalzing, G. and Aguayo, L.G. (2008) A selective Gβγ-linked intracellular mechanism for modulation of a ligand-gated ion channel by ethanol. PNAS, 105, 20523-20528. doi:10.1073/pnas.0806257105
- Findlay, G.S., Phelan, R., Roberts, M.T., Homanics, G.E., Bergeson, S.E., Lopreato, G.F., et al. (2003) Glycine receptor knock-in mice and hyperekplexia-like phenotypes: Comparisons with the null mutant. Journal of Neuroscience, 23, 8051-8059.
- Yevenes, G.E., Peoples, R.W., Tapia, J.C., Parodi, J., Soto, X., Olate, J., et al. (2003) Modulation of glycine-activated ion channel function by G-protein betagamma subunits. Natural Neuroscience, 6, 819-824. doi:10.1038/nn1095
- Yevenes, G.E., Moraga-Cid, G., Avila, A., Guzmán, L., Figueroa, M., Peoples, R.W., et al. (2010) Molecular requirements for ethanol differential allosteric modulation of glycine receptors based on selective Gbetagamma modulation. Journal of Biological Chemistry, 285, 30203- 30213. doi:10.1074/jbc.M110.134676
- Miyamoto, A., Yang, S.X., Laufs, U., Ruan, X.L. and Liao, J.K. (1999) Activation of guanine nucleotide-binding proteins and induction of endothelial tissue-type plasminogen activator gene transcription by alcohol. Journal of Biological Chemistry, 274, 12055-12060. doi:10.1074/jbc.274.17.12055
- Constantinescu, A., Gordon, A.S. and Diamond, I. (2002) cAMP-dependent protein kinase types I and II differenttially regulate cAMP response element-mediated gene expression: Implications for neuronal responses to ethanol. Journal of Biological Chemistry, 277, 18810-18816. doi:10.1074/jbc.M112107200
- Yoshimura, M. and Tabakoff, B. (1999) Ethanol’s actions on cAMP-mediated signaling in cells transfected with type VII adenylyl cyclase, Alcoholism: Clinical and Experimental Research, 23, 1457-1461.
- Nelson, E.J., Hellevuo, K., Yoshimura, M. and Tabakoff, B. (2003) Ethanol-induced phosphorylation and potentialtion of the activity of type 7 adenylyl cyclase. Involvement of protein kinase C delta. Journal of Biological Chemistry, 278, 4552-4560. doi:10.1074/jbc.M210386200
- Guzmán, L., Romo, X., Grandy, R., Soto, X., Montecino, M., Hinrichs, M., et al. (2005) A Gbetagamma stimulated adenylyl cyclase is involved in Xenopus laevis oocyte maturation. Journal of Cellular Physiology, 202, 223-229. doi:10.1002/jcp.20102
- Yevenes, G.E., Moraga-Cid, G., Romo, X. and Aguayo, L.G. (2011) Activated G protein (alpha)s subunits increase the ethanol sensitivity of human glycine receptors. The Journal of Pharmacology and Experimental Therapeutics, 339, 386-393. doi:10.1124/jpet.111.184408
- Lee, E., Linder, M.E. and Gilman, A.G. (1994) Expression of G-protein alpha subunits in Escherichia coli. Methods in Enzymology, 237, 146-164. doi:10.1016/S0076-6879(94)37059-1
- Sprang, S.R. (1997) G protein mechanisms: Insights from structural analysis. Annual Review of Biochemistry, 66, 639-678. doi:10.1146/annurev.biochem.66.1.639
- Brito, M., Guzmán, L., Romo, X., Soto, X., Hinrichs, M.V. and Olate, J. (2002) S111N mutation in the helical domain of human Gs(alpha) reduces its GDP/GTP exchange rate. Journal of Cellular Physiology, 85, 615-620. doi:10.1002/jcb.10128
- Van Eps, N., Preininger, A.M., Alexander, N., Kaya, A.I., Meier, S., Meiler, J., et al. (2011) Interaction of a G protein with an activated receptor opens the interdomain interface in the alpha subunit. Proceedings of National Academy Science of the USA, 108, 9420-9424. doi:10.1073/pnas.1105810108
- Kapoor, N., Menon, S.T., Chauhan, R., Sachdev, P. and Sakmar, T.P. (2009) Structural evidence for a sequential release mechanism for activation of heterotrimeric G proteins. Journal of Molecular Biology, 393, 882-897. doi:10.1016/j.jmb.2009.08.043
- Yevenes, G.E., Moraga-Cid, G., Peoples, R.W., Schmalzing, G. and Aguayo, L.G. (2008) A selective G betagamma-linked intracellular mechanism for modulation of a ligand-gated ion channel by ethanol. Proceedings of National Academy Science of the USA, 105, 20523-20528. doi:10.1073/pnas.0806257105
- Beck, I.T. and Dinda, P.K. (1981) Acute exposure of small intestine to ethanol: Effects on morphology and function. Digestive Diseases and Sciences, 26, 817-838. doi:10.1007/BF01309614
- Dutta, S., Matsumoto, Y., Muramatsu, A., Matsumoto, M., Fukuoka, M. and Ebling, W.F. (1998) Steady-state propofol brain: Plasma and brain: Blood partition coefficients and the effect-site equilibration paradox. British Journal of Anaesthesia, 81, 422-424. doi:10.1093/bja/81.3.422
- Tall, G.G. (2013) Ric-8 regulation of heterotrimeric G proteins. Journal of Receptors and Signal Transduction. doi:10.3109/10799893.2013.763828
- Klattenhoff, C., Montecino, M., Soto, X., Guzmán, L., Romo, X., García, M.A., et al. (2003) Human brain synembryn interacts with Gsalpha and Gqalpha and is translocated to the plasma membrane in response to isoproterenol and carbachol. Journal of Cellular Physiology, 195, 151-157. doi:10.1002/jcp.10300
- Romo, X., Pastén, P., Martínez, S., Soto, X., Lara, P., de Arellano, A.R., et al. (2008) xRic-8 is a GEF for Gsalpha and participates in maintaining meiotic arrest in Xenopus laevis oocytes. Journal of Cellular Physiology, 214, 673- 680. doi:10.1002/jcp.21257
NOTES
*Corresponding author.