Advances in Bioscience and Biotechnology
Vol.4 No.3(2013), Article ID:28778,9 pages DOI:10.4236/abb.2013.43050
Spectral footprint of Botrytis cinerea, a novel way for fungal characterization
![]()
1National Authority for Remote Sensing and Space Sciences, Cairo, Egypt
2Department of Plant Pathology, Faculty of Agriculture, Ain Shams University, Cairo, Egypt
Email: *hala_abdelwahab@agr.asu.edu.eg
Received 2 January 2013; revised 7 February 2013; accepted 27 February 2013
Keywords: Gray Mold; Fungal Identification; Fungal Classification
ABSTRACT
Botrytis cinerea affects plant yield and quality. Many Botrytis species are morphologically similar leading to difficulty in pathogen identification. Spectroscopy can be used to identify pathogenic fungi. This study describes a novel method for fungal characterization. Here, we determined the spectral signatures of different B. cinerea isolates as well as various fungal genera. A unique spectral pattern was investigated at both genus and isolate level. The short wave infrared II (2055 - 2315 nm) provided the best discrimination between the fungal samples observed. Moreover, the spectral analysis was performed on non-transformed data and investigated significant differences among fungal genera as well as B. cinerea isolates, while the results investigated high similarity among replicates of the same isolate of B. cinerea. The results of each spectral test were obtained reproducibly without an expensive cost consumable during sample preparation and measurements. This innovative approach would allow us to identify, discriminate and classify fungi rapidly and inexpensively at the genus, species and isolate level.
1. INTRODUCTION
Botrytis cinerea Pers.:Fr. (teleomorph: Botryotinia fuckeliana (de Bary) Whetzel), the cause of gray mold, is a necrotrophic pathogen causing economically important preand postharvest diseases in at least 235 plant species. One of the major infections it causes, grape and strawberry fruit rot, leads to reduced quality and quantity of fruit. Although variation in morphology and aggressiveness characteristics had been reported between isolates of Botrytis spp. [1,2], many species are morphologically similar [2]. No key to all recognized species is available and identification of species based on traditional criteria can be difficult [3]. Moreover, genomic variability had been demonstrated in fungi [4-6]. Genetic characterization of B. cinerea had showed significant differentiations among isolates collected from different host plants [7,8]. It was previously determined that isolates sampled from grapes and tomatoes were genetically differentiated using random amplified polymorphic DNA (RAPD) and polymerase chain reaction-restriction fragment length polymorphism (PCR-RFLP) markers [9]. Discrimination of fungi at species-level had been investigated using ITS rDNA test, but variation in the ITS region within Botrytis is low, limiting its use in this genus [3].
Remote sensing is the acquisition of information about an object or phenomenon, without making physical contact with the object. Hyperspectral sensors collect numerous wavelengths of reflected or transmitted radiance in many contiguous wavelengths. In modern usage, the term generally refers to the use of aerial sensor technologies to detect and classify various objects by means of propagated signals [10,11]. Certain objects leave unique “fingerprints” across the electromagnetic spectrum (EM). These “fingerprints” are known as spectral signatures and enable identification of the scanned organism. Spectral signatures are the specific combination of reflected and absorbed electromagnetic radiation at varying wavelengths which can uniquely identify an object. Hyperspectral data contain information that relates to important biochemical properties in the cell [12- 16].
The measurements can be made with various instruments, including spectroradiometers. Hyperspectral remote-sensing approaches have been proposed for various agricultural purposes such as the identification and classification of plant species, estimation of plant yield, detection and quantification of crop diseases [16,17], extraction of crop biophysical parameters [18-20], application of fungicides and plant nutrition [21]. Recently, Fourier transform infrared spectroscopy (FT-IR) has been used for identification of many microorganisms [22-25]. This method involves the analysis of all components of the cell by infrared spectroscopy, using transformed data in order to make promising results [26-28]. Data transformation had already been used for the differentiation of pathogens at the species level [29-33]. The objective of this study is to discriminate spectral footprints of fungi especially B. cinerea isolates directly from the raw data using spectroradiometer. The spectral signature of each tested isolate could be an indicator of its characteristic. This would allow the identification of fungal species accurately and rapidly as molecular approaches but inexpensively for a routine work.
2. MATERIALS AND METHODS
2.1. Plant Samples and Fungal Cultures
The modified selective medium, m1KERS, was based on medium compositions previously developed [6,34,35] without adding pentachloronitrobenzene component, the basis of KERS medium [36,37]. The composition of this medium (g/L distilled water) is: glucose, 20 g; NaNO3, 1 g; KH2PO4, 1.2 g; MgSO4·7H2O, 0.2 g; KCl, 0.15 g; agar, 25 g. This medium was autoclaved at 121˚C for 20 min. After cooling to 65˚C, the following ingredients were added: chloramphenicol, 0.05 g; tannic acid, 5 g; CuSO4, 2.2 g; Cabrio Top fungicide (Pyraclostrobin), 0.1 g. Different organs from strawberry (Var. Florida & 029) and grape (Var. Superior & Flame) were tested for Botrytis infection (Table 1). To reduce the risk of cross-contamination, samples were dipped separately in sterile water for 5 min, dried on paper towels, then plated onto m1KERS and incubated at 23˚C for 3 - 21 days. The
Table 1. Detection of Botrytis infection in various plant organs.
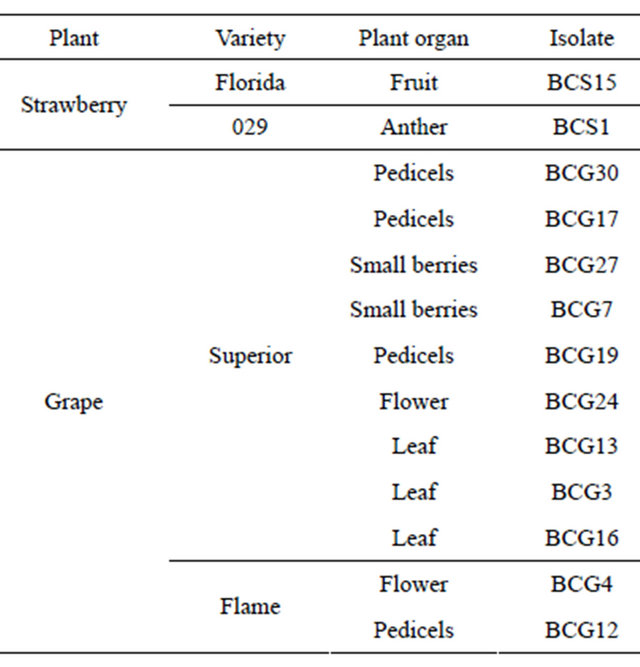
mycelium growth and the brown halo formation of B. cinerea were tested in comparison with other fungal genera used as negative controls (Aspergillus sp., Rhizopus sp., Penicillium italicum, Penicillium digitatum, Fusarium sp., Alternaria sp. and Rhizoctonia sp.). The samples were examined daily for development of B. cinerea isolates which were transferred to potato dextrose agar (PDA; Difco) and incubated for 21 days at 23˚C. Three replicates were prepared for each fungal culture.
2.2. Spectroradiometer Standardization
Spectral data were collected using an ADS field spectroradiometer (Boulder, CO, USA). It has the characteristic of being nearly 100% reflective within the wavelength range of 350 nm to 2500 nm. The spectral resolution of this instrument was 3 nm at wavelengths between 350 - 1000 nm, and 10 nm for longer wavelengths, with spectral sampling intervals of 1.4 and 2 nm, respectively [38].
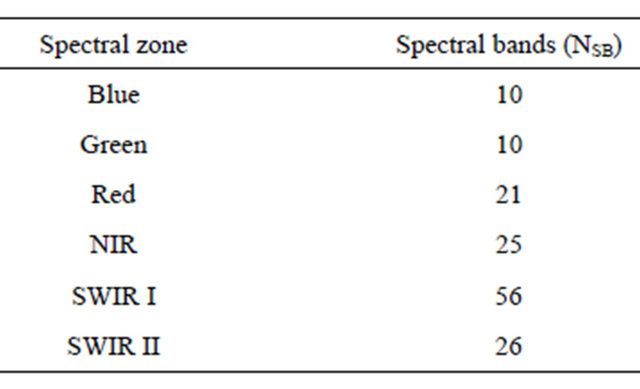
The protocol used for the collection of spectral data was based on measuring radiance from a Spectralon® panel (North Sutton, NH, USA). A designed probe was attached to the instrument’s fiber-optic cable to ensure standardized environmental conditions for reflectance measurement. The fiber-optic cable provides the flexibility to adapt the instrument to a wide range of applications. The measurements were performed by holding the pistol grip by hand. Bare foreoptic 25 degrees used for outdoor measurements resulting circular field of view with 3 cm diameter as measurements were taken at 3 cm height in nadir position 90 degrees over target surface. For the current study and as recommended in the instructions of using the device in outdoor measurements, reference panel is closer to the foreoptics. For outdoor optimization, the Spectralon® was tilted directly towards the sun during optimization. Dark-current is systematic noise from the instrument electronics and detectors. In the current study, the spectroradiometer includes mechanically controlled shutters and software for recording and automatically subtracting dark-current. After calibrating the spectroradiometer, the measurements were performed under sun light condition at 11 am-1 pm according to manufacturer instructions by holding the pistol grip. The reflectance was averaged for each 10 (nm) resulted in a specific number of spectral bands (NSB) for each spectral zone (NSZ) with a total of 138 spectral bands. The number of spectral bands in each spectral zone is represented in Table 2.
2.3. Spectroradiometer Measurements
The spectral measurement was performed on seven different fungi (Aspergillus sp., Botrytis cinerea, Penicillium italicum, Penicillium digitatum, Fusarium sp., Al-
Table 2. Number of spectral bands for each spectral zone.
ternaria sp. and Rhizoctonia sp.) and thirteen isolates of Botrytis cinerea (BCS1, BCS15, BCG3, BCG4, BCG7, BCG12, BCG13, BCG16, BCG17, BCG19, BCG24, BCG27, BCG30). Each fungal culture, aged 21 days, has three replicates in an individual petri dish. The spectral measurement for each fungal culture was measured three times (three observations at the same time) and then we have taken the average of these three measurements to represent the spectral curve of each fungus and then to show the variation of the spectral patterns among different fungal cultures.
2.4. Data Treatments
Spectral zones that represent the atmospheric windows (portions of the electromagnetic reflectance that include data noise because of the relative air humidity) were removed. Spectral pattern of each measured sample was identified. Data were divided into six different spectral portions as follows: blue (350 - 440 nm), green (450 - 540 nm), red (550 - 750 nm), NIR (760 - 1000 nm), SWIR I (1010 - 1775 nm) and SWIR II (2055 - 2315 nm).
2.5. Statistical Analysis
Statistical analysis was performed using SAS program [39]. All means comparison for all measurements were examined by Tukey’s HSD (honestly significant difference) using one way ANOVA (analysis of variance) test. We have subjected spectral measurement data of seven different fungi and thirteen isolates of B. cinerea for statistical analysis. These samples were tested across the six spectral zones previously described. To reduce the effect of low-frequency noise conditions of spectral bands resulted from outdoor measurement, we tested multiple spectra with spectrum averaging set to 10 - 25 nm.
Before conducting the Statistical analysis, the distribution of the spectral responses was assumed to be normal under the central limit theorem and the equality of statistical variances was verified for every spectral location. Then, the hypothesis test was carried out using one way ANOVA at every spectral location between 350 nm and 2500 nm (a total of 2150 spectral bands).
The Tukey’s significant difference test was applied to define ranges that significantly differ along the 2150 bands. The selected bands then formed the basis for a linear discriminant analysis (LDA) that classified the different fungal genera and B. cinerea isolates. We applied a one-way ANOVA to filter out wavebands that did not differ significantly in mean reflectance among different fungi. A one-way ANOVA was carried out on fungi as the independent factor for each of the 2150 wavebands. We considered p < 0.05 as an indication for the significant differences as the mean reflectance of at least two of the different fungi differed in the tested band; all bands meeting this criterion were included in the LDA. One potential criticism of this band selection procedure is that the results of tests on adjacent bands are not statistically independent. However, our objective in applying ANOVA was not to test hypotheses about differences within specific bands; rather, we were seeking to eliminate bands from the analysis that provided no useful information for discriminating fungal reflectance patterns, and thereby reduce the number of analyzed bands to a level that would be operational for LDA. This band selection procedure was performed on all tested samples.
3. RESULTS AND DISCUSSION
3.1. Detection of B. cinerea Using m1KERS Medium
Different organs from both strawberry and grape (Table 1) were screened to detect B. cinerea after incubation on m1KERS medium during 3 - 21 days. The appearance of brown halo formation surrounding the infected plant samples was observed after three days of incubation indicating the presence of Botrytis infection in tested plant samples. While the other fungal genera used as negative controls did not show any brown halo formation during the same period. Different isolates of B. cinerea were then identified morphologically by light microscope and also characterized on PDA medium.
3.2. Spectral Reflectance of Different Fungal Cultures
An average measurement of each fungal culture was taken (see materials and methods) to identify the spectral reflectance pattern which was averaged for each 10 nm resulted in a specific number of spectral bands for each spectral zone (Table 2). The results demonstrated similarity in spectral analysis among different fungi using the spectral zones: blue, red, near infrared and SWIR I (Data not shown). While, the spectral analysis of each fungus using SWIR II at 2055 - 2315 nm showed a unique form of spectral signature that able to distinguish the tested fungus (Figure 1). Statistical analysis using
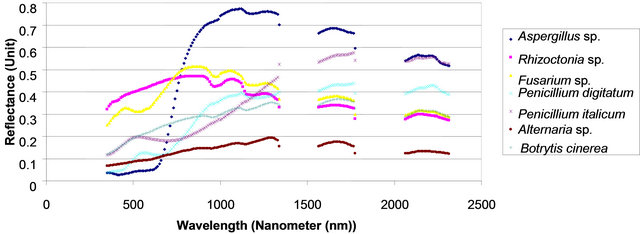
Figure 1. Spectral reflectance pattern of different fungi using SWIR II at 2055 - 2315 nm.
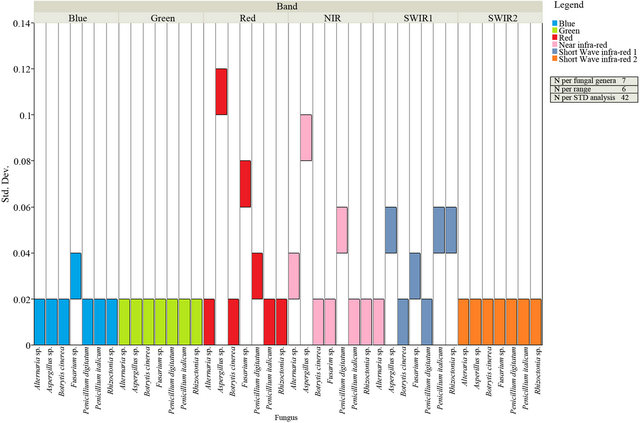
Figure 2. The standard deviation of the spectral reflectance of all analyzed fungal genera within the six spectral zones (Blue, Green, Red, NIR, SWIR I and SWIR II).
Tukey’s HSD test was carried out to show the variation between the different fungi in the six different spectral zones (blue, green, red, NIR, SWIR I and SWIR II).
The standard deviation of the spectral reflectance of all analyzed fungi were indicated within the six spectral zones (Figure 2), and showed that the same significant values (p < 0.05) were only located within the green and SWIR II spectral zones in which all tested fungi showed the same values of standard deviation. However, the number of spectral bands (NSB) was higher in the SWIR II spectral zone than that demonstrated in green spectral zone (Table 2). This indicated that the SWIR II was more suitable than other spectral zones to clarify the variation of spectral reflectance among tested fungi. Additionally, the result of Tukey’s HSD test showed that SWIR II spectral zone provided the best discrimination between tested fungi as it showed that each fungus has a unique median, data range, maximum and minimum values (Figure 3).
3.3. Spectral Reflectance of Different Isolates of B. cinerea
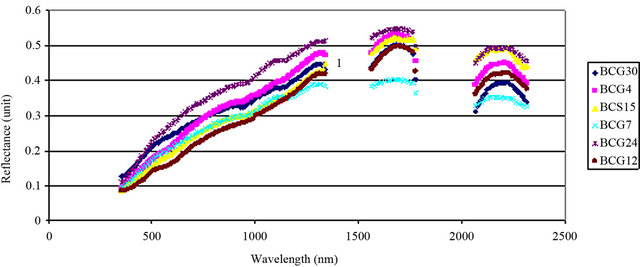
An average measurement of each isolate of B. cinerea was taken (see Materials and Methods) to identify the spectral reflectance pattern. Different isolates were tested for spectral reflectance using the six spectral zones (blue, red, near infrared and SWIR I) which showed similarity in spectral data among isolates (Data not shown). While, the spectral analysis of each isolate using SWIR II at 2055 - 2315 nm showed similar forms of signature which could be divided into 5 groups depending on their footprint similarity: group 1 which contained the majority of B. cinerea isolates: BCG30, BCG4, BCS15, BCG7, BCG24, BCG12 (Figure 4(a)), group 2: BCS19, BCG27, group 3: BCS1, BCG16, group 4: BCG3 and group 5: BCG13 (Figure 4(b)). This evidence may indicate the existence of other polyphagous species within B. cinerea. Statistical analysis using Tukey’s HSD confirmed that the spectral zone SWIR II at 2055 - 2315 nm was the best spectral region to differentiate the isolates of B. cinerea as the result of this test showed a unique median, data range, maximum and minimum value for each isolate (Figure 5). Additionally, the spectral analysis of the replicates of each isolate using SWIR II demonstrated significant values (p < 0.05) of standard deviation with adequate number of spectral bands (NSB), thus it confirmed the ability of SWIR II spectral zone to discriminate the different isolates of the same fungus, B. cinerea (Figure 6). In contrast, at the isolate level, close values of standard deviation between the replicates of the same isolate were observed at all different spectral zone (Figure 7) as well as the SWIR II spectral zone indicating the high similarity of their spectral pattern at any spectral range.
Indeed, the current spectral measurements and data analysis demonstrated result reproducibility confirming the accuracy of using the minimal range of SWIR II (2055 - 2315 nm) for fungal discrimination. In fact, previous studies had demonstrated a large spectral range (Vis-NIR, 400 - 2498 nm) to distinguish fungal species by spectroscopy [40]. Similarly, other spectroscopic techniques had been used to discriminate and classify yeasts [41] and filamentous fungi [42] at a large spectral range (FT-IR, 500 - 4000 cm–1) only after processing data using Fourier transform infrared spectroscopy. Here, we used outdoor spectroradimetric measurements to identify the spectral signatures of different fungal genera and different isolates of Botryis cinerea based on the spectral reflectance characteristics. The statistical analysis was carried out on the raw data (the spectroradiometric measurements) without any data transformation or any other pre-processing. Few studies have been carried out to examine spectral reflectance through specific portion of the electromagnetic spectrum (EM). The current study examined the spectral signature of the fungus through a wide range of the electromagnetic spectrum (300 - 2500 nm). Statistical analysis showed the high capability of SWIR-2 spectral zone to identify and discriminate the different samples over the rest of the spectral zones. The reason of this could be due to the high capability of this portion of the EM to identify cellular molecules by their constituent bonds that affect the spectral reflectance characteristics. The reason could be also due to the high sensitivity of this portion of the EM to the water content of the measured cells [43,44]. In addition, this novel method has proved its reliability to detect, identify and classify the tested fungus directly from the fungal culture without combining with neither
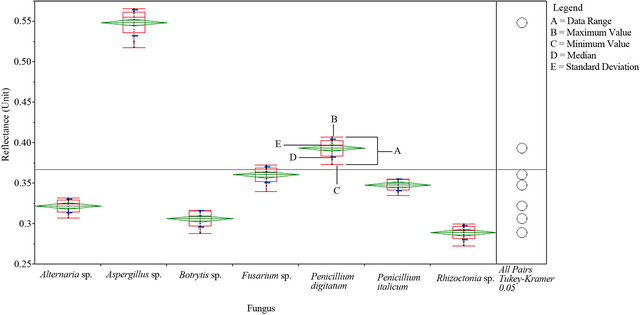
Figure 3. Statistical analysis of spectral reflectance values of different fungi using SWIR II spectral zone.
 (a)
(a)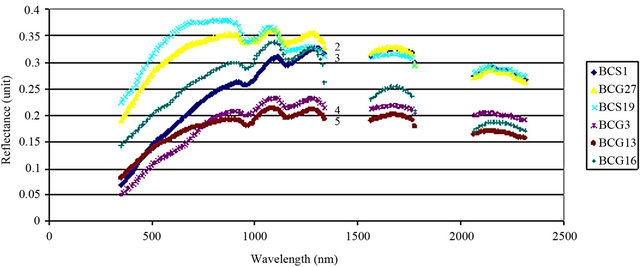 (b)
(b)
Figure 4. Spectral reflectance pattern of different isolates of B. cinerea. 1, 2, 3, 4 and 5: grouping the spectra depending on their footprint similarity.
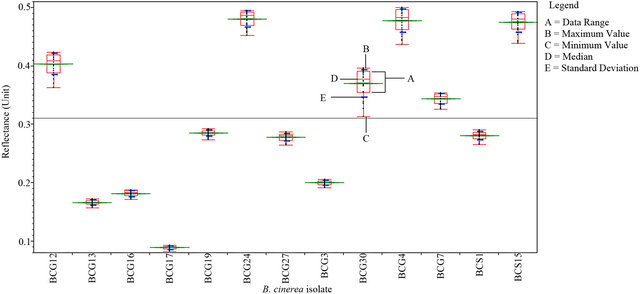
Figure 5. Statistical analysis of spectral reflectance of different B. cinerea isolates at the SWIR II.
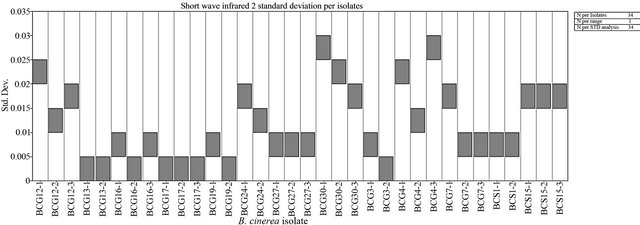
Figure 6. The standard deviation of the spectral reflectance of different isolates of B. cinerea at the SWIR II spectral zone.

Figure 7. Discrimination of isolate replicates of B. cinerea.
methods that depend on cell composition like proteins/ biological materials [45-50] nor transforming data [22- 25]. The results of this study permit us to use spectroradiometer at such limited spectral zone for direct fungal classification. Other advanced molecular technique like PCR approach could not directly classify the tested unknown pathogen although it has many advantages like rapidity, specificity and sensitivity [50].
4. ACKNOWLEDGEMENTS
This project was supported financially by the Science and Technology Development Fund (STDF), Egypt, Grant No 2131. This study was registered as a patent n. 1521/2012 in Egypt. We thank the research staff of the Agricultural applications at the Egyptian National Authority for Remote Sensing and Space Sciences.
![]()
![]()
REFERENCES
- Hutson, R.A. and Mansfield, J.W. (1980) A genetical approach to the analysis of mechanisms of pathogenicity in Botrytis/Vicia faba interaction. Physiological Plant Pathology, 17, 309-317.
- Elad, Y., Williamson, B., Tudzynski, P. and Delen, N. (2007) Botrytis spp. and diseases they cause in agricultural systems—An introduction. Botrytis: Biology, Pathology and Control, Springer, Netherlands, 1-8. doi:10.1007/978-1-4020-2626-3_1
- Nielsen, K., Justesen, A.F., Jensen, D.F. and Yohalem, D.S. (2001) Universally primed polymerase chain reaction alleles and internal transcribed spacer restriction fragment length polymorphisms distinguish two subgroups in Botrytis aclada distinct from B. byssoidea. Phytopathology, 91, 527-533. doi:10.1094/PHYTO.2001.91.6.527
- Dufresne, M., Hua-Van, A., Abd el Wahab, H., Ben M’Barek, S., Vasnier, C., Teysset, L., Kema, G.H.J. and Daboussi, M.J. (2007) Transposition of a fungal MITE through the action of a Tc1-like transposase. Genetics, 175, 441-445. doi:10.1534/genetics.106.064360
- Lopez-Berges, M.S., Di Pietro, A., Daboussi, M.J., Abdel Wahab, H., Vasnier, C., Roncero, I.G., Dufresne, M. and Hera, C. (2009) Identification of virulence genes in Fusarium oxysporum f. sp. lycopersici by large-scale transposon tagging. Molecular Plant Pathology, 10, 95-107. doi:10.1111/j.1364-3703.2008.00512.x
- Abdel Wahab, H., Aly, N.A.H. and Ali, M.K. (2010) Improving detection means for strawberry gray mold caused by Botrytis cinerea in Egypt. Egyptian Journal of Phytopathology, 38, 107-119.
- Diolez, A., Marches, F., Fortini, D. and Brygoo, Y. (1995) Boty, a long-terminal-repeat retroelement in the phytopathogenic fungus Botrytis cinerea. Applied and Environmental Microbiology, 61, 103-108.
- Giraud, T., Fortini, D., Levis, C., Lamarque, C., Leroux, P., LoBuglio, K. and Brygoo Y. (1999) Two sibling species of the Botrytis cinerea complex, transposa and vacuma, are found in sympatry on numerous host plants. Phytopathology, 89, 967-973. doi:10.1094/PHYTO.1999.89.10.967
- Muňoz, G., Hinrichsen, P., Brygoo, Y. and Griaud, T. (2002) Genetic characterization of Botrytis cinerea populations in Chile. Mycological Research, 106, 594-601. doi:10.1017/S0953756202005981
- Schott, J.R. (2007) REMOTE sensing: The image chain approach. 2nd Edition, Oxford University Press, Oxford, 1.
- Schowengerdt, R.A. (2007) REMOTE sensing: Models and methods for image processing. 3rd Edition, Academic Press, Waltham, 2.
- Gates, D.M., Keegan, H.J., Schleter, J.C. and Weidner, V.R. (1965) Spectral properties of plants. Applied Optics, 9, 545-552.
- Hoffer, R.M. (1978) Biological and physical considerations in applying computer-aided analysis techniques to remote sensor data. In Swain, P.H. and Davis, S.M. (Eds.), Remote Sensing: The Quantitative Approach, McGrawHill Book Company, New York, 227-289.
- Kokaly, R.F. (2001) Investigating a physical basis for spectroscopic estimates of leaf nitrogen concentration. Remote Sensing of Environment, 75, 153-161. doi:10.1016/S0034-4257(00)00163-2
- McDonald, M.S. (2003) Photobiology of higher plants. Wiley, Chichester, 354.
- Delalieux, S., Van Aardt, J., Keulemans, W., Schrevens, E. and Coppin, P. (2007) Detection of biotic stress (Venturia inaequalis) in apple trees using hyperspectral data: Non-parametric statistical approaches and physiological implications. European Journal of Agronomy, 27, 130- 143. doi:10.1016/j.eja.2007.02.005
- Michael, P.G., Richard, M.J. and Paul V.Z. (2010) DETECTING Sugarcane yellow leaf virus infection in asymptomatic leaves with hyperspectral remote sensing and associated leaf pigment changes. Journal of Virological Methods, 167, 140-145. doi:10.1016/j.jviromet.2010.03.024
- Thenkabail, P.S., Smith, R.B. and Pauw, E.D. (2000) Hyperspectral vegetation indices and their relationships with agricultural crop characteristics. Remote Sensing of Environment, 71, 158-182. doi:10.1016/S0034-4257(99)00067-X
- Gitelson, A.A. (2004) Wide dynamic range vegetation index for remote quantification of biophysical characteristics of vegetation. Journal of Plant Physiology, 161, 165-173. doi:10.1078/0176-1617-01176
- Gitelson, A.A., Vina, A., Verma, S.B., Rundquist, D.C., Arkebauer, T.J., Keydan, G., Leavitt, B., Ciganda, V., Burba, G.G. and Suyker, A.E. (2006) Relationship between gross primary production and chlorophyll content in crops: Implications for the synoptic monitoring of vegetation productivity. Journal of Geophysical Research, 111. doi:10.1029/2005JD006017
- Paul Jr., J.P., Jerry, C.R., Jerry, L.H. and Galen, F.H. (2003) The agricultural research service’s remote sensing program: An example of interagency collaboration. Photogrammetric Engineering and Remote Sensing, 69, 615- 618.
- Oberreuter, H., Seiler, H. and Scherer, S. (2002) Identification of coryneform bacteria and related taxa by Fourier transform infrared spectroscopy. International Journal of Systematic and Evolutionary Microbiolology, 52, 91-100.
- Wenning, M., Seiler, H. and Scherer, S. (2002) Fouriertransform infrared microspectroscopy, a novel and rapid tool for identification of yeasts. Applied and Environmental Microbiology, 68, 4717-4721. doi:10.1128/AEM.68.10.4717-4721.2002
- Rebuffo, C.A., Schmitt, J., Wenning, M., von Stetten, F. and Scherer, S. (2006) Reliable and rapid identification of Listeria monocytogenes and Listeria species by artificial neural network-based Fourier transform infrared spectroscopy. Applied and Environmental Microbiology, 72, 994-1000. doi:10.1128/AEM.72.2.994-1000.2006
- Beekes, M., Lasch, P. and Naumann, D. (2007) Analytical applications of Fourier transform-infrared (FT-IR) spectroscopy in microbiology and prion research. Veterinary Microbiology, 123, 305-319. doi:10.1016/j.vetmic.2007.04.010
- Rebuffo-Scheer, C.A., Schmitt, J. and Scherer, S. (2007) Differentiation of Listeria monocytogenes serovars by using artificial neural network analysis of Fourier-transformed infrared spectra. Applied Environmental Microbiology, 73, 1036-1040. doi:10.1128/AEM.02004-06
- Kuhm, A., Sutter, D., Felleisen, R. and Rau, J. (2009) Identification of Yersinia enterocolitica at the species and subspecies levels by Fourier transform infrared spectroscopy. Applied and Environmental Microbiology, 75, 5809- 5813. doi:10.1128/AEM.00206-09
- Wortberg, F., Nardy, E., Contzen, M. and Rau, J. (2012) Identification of Yersinia ruckeri from diseased salmonid fish by Fourier transform infrared spectroscopy. Journal of Fish Diseases, 35, 1-10. doi:10.1111/j.1365-2761.2011.01317.x
- Naumann, A. (2009) A novel procedure for strain classification of fungal mycelium by cluster and artificial neural network analysis of Fourier transform infrared (FTIR) spectra. Analyst, 134, 1215-1223. doi:10.1039/b821286d
- Samuels, A.C., Snyder, A.P., Emge, D.K., Amant, D., Minter, J., Campbell, M. and Tripathi A. (2009) Classification of select category A and B bacteria by Fourier transform infrared spectroscopy. Applied Spectroscopy, 63, 14-24. doi:10.1366/000370209787169867
- Santos, C., Fraga, M.E., Kozakiewicz, Z. and Lima, N. (2010) Fourier transform infrared as a powerful technique for the identification and characterization of filamentous fungi and yeasts. Research in Microbiology, 161, 168- 175. doi:10.1016/j.resmic.2009.12.007
- Salman, A., Pomerantz, A., Tsror, L., Lapidot, I., Zwielly, A., Moreh, R., Mordechai, S. and Huleihel, M. (2011) Distinction of Fusarium oxysporum fungal isolates (strains) using FTIR-ATR spectroscopy and advanced statistical methods. Analyst, 136, 988-995. doi:10.1039/c0an00801j
- Salman, A., Lapidot, I., Pomerantz, A., Tsror, L., Shufan, E., Moreh, R., Mordechai, S. and Huleihel, M. (2012) Identification of fungal phytopathogens using Fourier transform infrared-attenuated total reflection spectroscopy and advanced statistical methods. Journal of Biomedical Optics, 17, Article ID: 017002. doi:10.1117/1.JBO.17.1.017002
- Abdel Wahab, H. and Helal, N.A.S. (2013) Evaluation of Pre-harvest Bioagent applications for both production and Biological Control of Onion and Strawberry Plants under Natural Botrytis Infections. African Journal of Plant Science and Biotechnology, 7, 64-69.
- Abdel Wahab, H. and Younis, R. (2012) Early detection of Gray Mold in Grape using conventional and molecular methods. African Journal of Biotechnology, 11, 15251- 15257.
- Kritzman, G. and Netzer, D. (1978) A SELECTIVE medium for isolation and identification of Botrytis spp. from soil and onion seed. Phytoparasitica, 6, 3-7. doi:10.1007/BF02981180
- Kerssies, A. (1990) A selective medium for Botrytis cinerea to be used in a spore trap. Netherlands Journal of Plant Pathology, 96, 247-250. doi:10.1007/BF01974262
- ASD (1999) analytical spectral devices technical guide, fourth edition. Analytical Spectral Devices, Inc., Boulder.
- SAS Institute (1996) SAS/STAT user’s guide. Version 6.12, SAS Inst. Inc., Cary.
- Petisco, C., Downey, G., Murray, I., Zabalgogeazcoa, I., García-Criado, B. and García-Ciudad, A. (2008) Direct classification of related species of fungal endophytes (Epichloe spp.) using visible and near-infrared spectroscopyand multivariate analysis. Federation of European Microbiological Societies Microbiology Letters, 284, 135- 141. doi:10.1111/j.1574-6968.2008.01186.x
- Mariey, L., Signolle, J.P., Amiel, C. and Travert, J. (2001) Review: Discrimination, classification, identification of microorganisms using FTIR spectroscopy and chemometrics. Vibrational Spectroscopy, 26, 151-159. doi:10.1016/S0924-2031(01)00113-8
- Fischer, G., Braun, S., Thissen, R. and Dott, W. (2006) FT-IR spectroscopy as a tool for rapid identification and intra-species characterization of airbone filamentous fungi. Journal of Microbiological Methods, 64, 63-77. doi:10.1016/j.mimet.2005.04.005
- Noble, S.D. and Crowe, T.G. (2005) Analysis of crop and weed leaf diffuse reflectance spectra. Transactions of the American Society of Agricultural and Biological Engineers, 48, 2379-2387.
- Noble, S.D. and Brown, R.B. (2009) Plant species discrimination using spectral/spatial descriptive statistics. Proceedings of the 1st International Workshop on Computer Image Analysis in Agriculture, Potsdam, 27-28 August, 82-92.
- Demirev, P.A., Ho, Y.P., Ryzhov, V. and Fenselau, C. (1999) Microorganism identification by mass spectrometry and protein database searches. Analytical Chemistry, 71, 2732-2738. doi:10.1021/ac990165u
- Hu, A., Tsai, P.J. and Ho, Y.P. (2005) Identification of microbial mixtures by capillary electrophoresis/selective tandem mass spectrometry. Analytical Chemistry, 77, 1488-1495. doi:10.1021/ac0484427
- Lundquist, M., Caspersen, M.B., Wikström, P. and Forsman, M. (2005) Discrimination of Francisella tularensis subspecies using surface enhanced laser desorption ionization mass spectrometry and multivariate data analysis. FEMS Microbiology Letters, 243, 303-310. doi:10.1016/j.femsle.2004.12.020
- Van Wuijckhuijse, A.L., Stowers, M.A., Kleefsman, W.A., van Baar, B.L.M., Kientz, C.E. and Marijnissen, J.C.M. (2005) Matrix-assisted laser desorption/ionisation aerosol time-of-flight mass spectrometry for the analysis of bioaerosols: Development of a fast detector for airborne biological pathogens. Journal of Aerosol Science, 36, 677-687. doi:10.1016/j.jaerosci.2004.11.003
- Wynne, C., Fenselau, C., Demirev, P.A. and Edwards, N. (2009) Top-down identification of protein biomarkers in bacteria with unsequenced genomes. Analytical Chemistry, 81, 9633-9642. doi:10.1021/ac9016677
- Ho, Y.P. and Reddy, P.M. (2010) Identification of Pathogens by Mass Spectrometry. Clinical Chemistry, 56, 525- 536. doi:10.1373/clinchem.2009.138867
NOTES
*Corresponding author.
#These authors contributed equally to this work.