Advances in Bioscience and Biotechnology
Vol.3 No.3(2012), Article ID:20003,11 pages DOI:10.4236/abb.2012.33033
Secretion and expression dynamics of a GFP-tagged mucin-type fusion protein in high cell density Pichia pastoris bioreactor cultivations
![]()
1Department of Civil, Environmental and Natural Resources Engineering, Luleå University of Technology, Luleå, Sweden
2Absorber AB, Stockholm, Sweden
3Department of Clinical Chemistry & Transfusion Medicine, Sahlgrenska Academy, University of Gothenburg, Gothenburg, Sweden
Email: ulrika.rova@ltu.se
Received 15 February 2012; revised 26 March 2012; accepted 5 April 2012
Keywords: GFP; GFP-Fusion; Green Fluorescent Protein; KAR2; Pichia pastoris; Secretion; Unfolded Protein Response; Yeast
ABSTRACT
The methanol inducible alcohol oxidase 1 promoter and the Saccharomyces cerevisiae alpha-factor prepro secretion signal were used to drive expression and secretion of a mucin-type fusion protein by Pichia pastoris in 1 L scale bioreactors. The aim of the study was to understand how varying expression rates influenced the secretion dynamics of the fusion protein in terms of intracellularand extracellular concentrations. Endoplasmic reticulum (ER) folding stress was assessed by the relative expression of the unfolded protein response controlled KAR2 gene. Three predefined methanol feeding models were applied to control the fusion protein synthesis rate. To track the fusion protein synthesis in a non-invasive manner and to follow its intracellular distribution, its C-terminal was linked to the green fluorescent protein. Under all conditions the fusion protein was found to partially accumulate intracellularly, where the major fraction was an insoluble, fluorescent full-sized protein. The high degree of glycosylation of the insoluble fusion protein indicated a secretory bottle-neck in the Golgisystem. This result was consistent with low ER folding stress as quantified by the relative expression of the KAR2 gene. Reduction of recombinant protein synthesis rate, by using lower feed rates of methanol, enhanced extracellular concentrations from 8 to 18 mg·L–1 and reduced the rate of intracellular accumulation. This clearly demonstrates the importance of tuning the synthesis rate with secretory bottle-necks to maintain secretion.
1. INTRODUCTION
The methylotrophic yeast Pichia pastoris is a robust microorganism for industrial cultivation and has been used to express and secrete several recombinant proteins in the g per litre range [1]. However, the secretion levels with this yeast are still highly variable and in several cases intracellular accumulation of the recombinant protein destined for secretion has been observed [2,3]. Various strategies have been employed to try to improve secretion including the use of different promoters [2], gene copy number [2,4], secretion signals [5,6], overexpression of proteins involved in the folding and secretion processes [7,8], manipulation of genes involved in cellwall biogenesis [9] and different cultivation techniques [10,11]. Although secretion may be improved by one or several of these types of actions, no general method that ensures enhanced secretion of an arbitrary recombinant protein have been found.
To improve secretion systems it is important to have an understanding of the limiting steps within the secretory pathway. Frequently, the major limitations to secretion in recombinant yeast are signal sequence processing, membrane translocation and folding within ER [2]. Proteolytic degradation of the product in the media is another factor which often hampers high cell density cultivations and may reduce absolute yields [12,13].
When the balance between the different steps of protein synthesis and secretion is off-set, the secretory pathway may be saturated. This may in turn lead to intracellular accumulation of missfolded and folded recombinant protein which ultimately may impair secretion [2,14]. Furthermore, increased levels of missfolded proteins in the endoplasmic reticulum (ER) can induce the unfolded protein response (UPR), which may lead to reduced secretion levels by a variety of UPR linked mechanisms [15-17]. A better understanding of how these processes are coupled may provide an important foundation on which to base process development strategies. The ambition of the present study was therefore to provide more information on how recombinant protein synthesis rate, ER folding stress and secretion titres are interrelated. By using a mucin-type fusion protein, as a model protein, information about different stages within the secretory pathway could be assessed as O-linked glycans are exclusively synthesized within the Golgi system [18]. To monitor productive folding of the fusion protein and to track its intracellular distribution, the green fluorescent protein was genetically linked to the C-terminal of the mucin-type fusion protein.
2. MATERIALS AND METHODS
2.1. Strains and Plasmids
The P. pastoris expression strain GS115 (Mut+), chemicals for transformation and plasmids for P. pastoris chromosome integration were acquired from the EasySelectTM Pichia Expression Kit version G (Invitrogen, Carlsbad, USA). For propagation of plasmids, E. coli XL-1 Blue (Agilent Technologies, Palo Alto, CA, USA) was used. The GFPuv cDNA sequence was obtained from the GFPuv vector pGFPuv (Clontech, Palo Alto, CA, USA). All restriction endonucleases for molecular cloning were acquired from New England Biolabs.
2.2. Chemicals
Yeast nitrogen base without amino acids was from EasySelectTM Pichia Expression Kit version G (Invitrogen). Peptone (CAS: 91079-38-8) and yeast extract (CAS: 8013-01-2) were from (Merck, Darmstadt, Germany). All other chemicals were acquired from Sigma Aldrich unless otherwise stated.
2.3. Construction of Recombinant Plasmids
pPICZα/PSGL-1/mIgG2b/GFP. The cDNA encoding PSGL- 1/mIgG2b was PCR amplified from the PSGL-1/mIgG2b expression plasmid [19] using 5’-CGC GGG AAT TCC AGC TGT GGG ACA CCT GGG-3’ and 5’-GCG GGG TAC CTT TAC CCG GAG ACC GGG AG-3’ as forward and reverse primers, respectively, and subcloned into the multiple cloning site of the pPICZα vector (Invitrogen) by EcoR1 and Kpn1 digestion. A stop codon was excluded in the reverse primer. The cDNA encoding GFPuv was PCR amplified from the pGFPuv vector (Clontech) using 5’-GCG GGG TAC CCC AAC GCC GAC ACC AAC GCC GAC AGG AGA ATT CAT GAG TAA AGG AGA AGA ACT TTT CAC TGG AGT TG-3’ and 5’-CGC GGG CGG CCG CTT ATT TGT AGA GCT CAT CCA TGC CAT GTG TAA TC-3’ as forward and reverse primers, respectively, and subcloned into the pPICZα/PSGL-1/mIgG2b (no stop codon) expression plasmid by Kpn1 and Not1 digestion. A linker with the amino acid sequence 5’-GTPTPTPTPTGEF-3’ was included in the forward primer (underlined) [20]. The sequence was confirmed by DNA sequencing.
2.4. Plasmid Integration and Selection of High Producing Clones
The vector pPICZα/PSGL-1/mIgG2b/GFP was amplified in E. coli XL-1 Blue using 25 µg·mL–1 ZeocinTM as selective agent. Following purification, the vectors were linearized by PmeI and transformed into P. pastoris GS115 cells according to standard procedures (Easy CompTM, Invitrogen). Tranformants of the Mut+ phenoltype were subsequently identified by growing nine clones from each transformation on MDH agar (1.34% yeast nitrogen base without amino acids, 4 × 10⁻³% histidine, 4 × 10⁻⁵% biotin, 2% glucose, 1.5% agar) and on MMH agar (same as MDH but with 0.5% methanol instead of glucose) using P. pastoris GS115/Albumin (Muts) and P. pastoris GS115/pPICZ/lacZ (Mut+) from Invitrogen as negative and positive control, respectively. To screen for high expressing clones, seven transformants of each transformation exhibiting the Mut+ phenotype were selected and inoculated in BMGY (1% yeast extract, 2% peptone, 1% v/v glycerol, 1.34% yeast nitrogen base, 100 mM potassium phosphate pH 6.0, 4 × 10⁻⁵% biotin) and grown for 24 hours at 29˚C. This was followed by a 72 hours induction period in BMMY (0.5% methanol, 1% yeast extract, 2% peptone, 1.34% yeast nitrogen base, 100 mM potassium phosphate pH 6.0, 4 × 10⁻⁵% biotin) at 29˚C. Cell culture supernatants were then harvested by centrifuging at 10,000 × g, 10 minutes at 4˚C and the concentration of PSGL-1/mIgG2b and PSGL-1/mIgG2b/ GFP in the supernatants was determined by ELISA using a goat anti-mouse IgG (Fc) antibody described below. The clone secreting most PSGL-1/mIgG2b/GFP was used to make glycerol stocks to be used in subsequent bioreactor cultivations.
2.5. Inoculum Preparation
An inoculum was prepared by inoculating 50 mL BMGY media in a 500 mL shake flask with P. pastoris GS115 encoding PSGL-1/mIgG2b/GFP. The culture was incubated at 180 rpm, 29˚C until OD600 was approximately five.
2.6. Bioreactor Medium and Set-Up
Duplicate runs were made for all cultivation conditions. All bioreactor cultivations were started in modified BMGY media (same as BMGY but with 40 g·L–1 glycerol and 1 g·L–1 histidine). In addition, 500 μL of antifoam (Sigma A6426) was used per cultivation and added prior to inoculation. An additional supplementation of 5 mL of 3.5% histidine was added before induction to ensure histidine was never limiting. Preliminary experiments indicated that two and three times this amount of histidine did not result in higher or lower growth rates or productivities during the time interval studied. All cultivations were conducted at 29˚C and pH 6.0 in 1 L bioreactors (Biobundle, Applikon, the Netherlands). The pH was maintained by automatic addition of 15% NH4OH. Dissolved oxygen tension (DOT), measured by a pO2 electrode, was kept at 35% of air saturation by adjusting agitation from 700 - 900 rpm and feed rate of air and pure oxygen as required. The pO2 electrode was calibrated before inoculation with air saturation at 29˚C, pH 6.0, one atmosphere absolute pressure, aeration of 0.75 L·min–1 and an agitation of 700 rpm.
2.7. Glycerol Batch and Fed-Batch Phases
The glycerol batch phase was initiated by transferring 45 mL of the inoculum to 620 mL bioreactor medium. After the initial glycerol was consumed, indicated by a DOT value of 100%, the cells were fed 45 mL of a 50% w/v glycerol solution including 12 mL PTM1 (0.6% CuSO4 × 5H2O, 8 × 10⁻³% NaI, 0.3% MnSO4 × H2O, 0.02% NaMoO4 × 2H2O, 2 × 10⁻³% Boric Acid, 0.05% CoCl2, 2% ZnCl2, 6.5% FeSO4 × 7H2O, 0.02% Biotin, 0.5% v/v H2SO4) salts per litre glycerol at a constant rate of 14 mL·h–1 giving a biomass concentration of approximately 48 g dry cell weight per litre cultivation volume.
2.8. Induction Phase
The methanol feed rate was incrementally changed 4 times per hour according to three pre-defined feeding strategies with the equation:
 , (1)
, (1)
where F is the feed rate in mL·h–1, F0 is the initial feed rate in mL·h–1, t is the time after induction in hours (h) and μ is the exponent in h–1. Preliminary experiments indicated that secretion was favoured under low initial feed rates and therefore the following conditions were investigated in this study: 1) F0 = 1.4 mL·h–1·L–1, μ = 0.04 h–1; 2) F0 = 1.4 mL·h–1·L–1, μ = 0.09 h–1; 3) F0 = 3.5 mL·h–1·L–1, μ = 0.12 h–1. These feeding models are termed “Low”, “Medium” and “High” in the text. For the run with F0 = 3.5 mL·h–1·L–1, this feed rate was constant during the initial 2.5 hours of induction to let the cells adapt to methanol. The initial feed rate was increased to a maximum of 8 mL·h–1·L–1, or until the cells maximum methanol consumption rate was reached, after which it was adjusted to the cells methanol consumption rate. To ensure that the methanol concentrations were growth limiting, the responsiveness of the cells to a complete stop in the methanol feed was measured. A 20% increase in DOT in less than 30 seconds was assumed to represent growth limiting concentrations of methanol. Off-line analysis of the supernatant with HPLC (described below) confirmed that residual methanol concentration was less than 100 mg·L–1 during the time interval of the study, and was hence never toxic to the cells.
2.9. Methanol Concentration Determinations
An HPLC system equipped with a Series 200 refractive index (RI) detector and a BioRad Aminex HPX87-H column was used for analysis of methanol. The column was kept at 65˚C and 5 mM H2SO4 was used as the mobile phase. A flow rate of 0.6 mL·min–1 was applied. A reference curve was prepared using methanol concentrations ranging from 100 to 10,000 mg·L–1. Bioreactor samples were centrifuged 10,000 × g, 10 minute at 4˚C and sterile filtered using 0.22 µm PES filter prior to injection. Peak areas from the chromatograms were subsequently evaluated on the basis of the reference curve.
2.10. Sample Preparation for Secreted and Intracellular Soluble and Insoluble PSGL-1/mIgG2b/GFP
To assay for secreted recombinant protein, cell culture supernatants were collected by centrifugation at 10,000 × g for 10 minutes at 4˚C. Cells and cell debris were removed by sterile filtration through 0.22 µm polyether sulfone (PES) filter (Nalgene) after which the supernatants were treated with 500 µL protease inhibitor cocktail (Sigma P8215) per litre supernatant and stored at –20˚C. To estimate the intracellular soluble PSGL-1 /mIgG2b/GFP, expressed as micrograms per g dry cell weight (μg gDCW–1), 250 μL bioreactor sample was centrifuged at 10,000 × g for 10 minutes at 4˚C, the supernatant discarded and the pellet washed once with 1 mL of sterile, ice cold phosphate buffered saline (100 mM M phosphate buffer, 2.7 mM potassium chloride and 137 mM sodium chloride, pH 7.4). Subsequently the cell pellet was suspended in ice cold yeast breaking buffer (50 mM sodium phosphate, 1 mM phenylmethylsulfonyl fluoride, 1 mM EDTA, 5% v/v glycerol, pH 7.4) up to a volume of 500 μL. Acid washed glass beads (Sigma 8772) were added to a total volume of 1000 μL and the samples were vortexed 12 × 1 minute with 1 minute cooling on ice in-between. The samples were then centrifuged at 15,000 × g for 30 minutes at 4˚C and the clear lysate was assayed for soluble PSGL-1/mIgG2b/GFP with ELISA described below. Estimation of specific soluble PSGL-1/mIgG2b/GFP concentration could then be made by dividing the total amount of extracted protein with the total dry biomass of the 250 μL bioreactor sample. To estimate the amount of specific insoluble PSGL-1/ mIgG2b/GFP, expressed as μg gDCW–1, the remaining cell debris was washed once by resuspending it in 1000 μL of YBB and transferring it to a fresh centrifuge tube and centrifuging at 10,000 × g for 10 minutes at 4˚C. After washing, the pellet was resuspended in extraction buffer up to 1000 µL (YBB with 2% w/v of sodium dodecyl sulphate, SDS) and incubated in a water bath at 37˚C for 2 hours. Finally, the samples were centrifuged at 15,000 × g for 30 minutes at 4˚C and the clear supernatant was assayed for insoluble PSGL-1/mIgG2b/GFP.
2.11. Fluorescence Measurements
All fluorescence measurements were made directly on cell pellets in ordinary, transparent 1.5 mL microcentrifuge tubes of polypropylene (Plastibrand 780500). Hence the fluorescence data represent the relative specific fluorescence, i.e relative per cell fluorescence. Measurements were made on pellets from 1500 μL bioreactor samples, washed once in ice cold PBS and then centrifuged at 10,000 × g for 10 minutes at 4˚C. To ensure that the microcentrifuge tubes were positioned exactly the same for each measurement an in-house positioning device was constructed. The fluorescence measurements were made with an USB2000-FLG spectrometer (Ocean Optics), a back-scattering probe R200-7-UV-VIS (Ocean Optics), and a PX-2 light source (Ocean Optics) in pulsed mode. An integration time of 1500 ms was used at all times. To shape the excitation wavelength with peak intensity at 395 nm, the linear variable filter LVH-HL (Ocean Optics) was used. Excitiation light was always checked against a reference spectrum before sample measurements to ensure that fluorescence intensity differences were not due to different excitation. Entire spectra from the samples were collected and emission intensity at 508 nm was recorded (counts·s–1). The OOIBase32 operating software (Ocean Optics) was used to acquire data.
2.12. ELISA
The intraand extracellular concentrations of recombinant fusion protein were determined by a two-antibody sandwich ELISA method as previously described [21]. Briefly, 96-well ELISA plates (Corning) were coated with an affinity-purified, polyclonal goat anti-mouse IgG(Fc) antibody (Sigma) at a concentration of 10 mg·mL–1. The plate was blocked with 1% BSA in PBS, which was also used for dilution of fusion protein as well as the second antibody (peroxidase-conjugated, antimouse IgG(Fc) antibody; Sigma). All incubations lasted for 2 hours. Between and after incubations the plates were washed with PBS containing 0.5% (v/v) Tween 20. Bound peroxidase-conjugated antibody was visualized with 3,3’,5,5’-tetramethylbenzidine dihydrochloride (TMB, Sigma). The reaction was stopped by the addition of 2 M H2SO4 and the absorbance at 450 nm was recorded. The fusion protein concentration was estimated using a dilution series of purified mouse IgG2b (Serotec) in blocking buffer as an internal standard.
2.13. Western Blotting
The recombinant proteins were analyzed by Western blotting. SDS-PAGE was run under non-reducing and reducing conditions using 4% - 12% gradient Bis-Tris gels and MES buffer (Invitrogen). For reducing conditions NuPAGE® Sample Reducing Agent was used according to manufacturer’s instructions (Invitrogen). Western blot membranes were probed with a mouse anti-human CD162 (BD Pharmingen) at a dilution of 1:500. The secondary antibody was a goat anti-mouse IgG-AP-conjugated antibody (Calbiochem) at a dilution of 1:5000. Bound antibodies were visualized by colorimetric detection using His-Tag AP western reagents according to manufacturer’s instructions (Novagen).
2.14. Biomass Concentration
Biomass concentration, X, expressed as gram dry cell weight per litre (gDCW L–1), was determined by centrifuging 5 mL of cell suspension at 3000 × g for 4 minutes at 4˚C and then washing the cells with two volumes of distilled water. The cells were resuspended in distilled water, transferred to a pre-weighed aluminium dish and dried at 90˚C until constant weight.
2.15. Calculation of Specific Productivity
The specific productivity was taken as;
 , (2)
, (2)
where Xtot is the total dry biomass in g·L–1, Ptot is the total PSGL-1/mIgG2b/GFP in the media in mg and t is induction time in (h). Regression curves (p = 0.05) were fitted to the secretion data points. To calculate the specific productivity at the sampling time points the derivatives of the regression models were used in combination with Xtot for respective sample point.
2.16. Confocal Microscopy
Glass slides, 76 × 26 × 1 mm, (VWR) were prepared by etching two 9.5 mm circles with a diamond pen and then transferring 30 μL of 1% polyethyleneimine, PEI, (Sigma) to each circle, incubating 5 minutes and removing excess PEI by aspiration. Slides were then stored in a moist chamber until use. Cells taken from the bioreactor (equivalent to approximately 4 mg dry cell weight) at the different time points were immediately fixed in 4% formaldehyde for 15 minutes at 37˚C, washed two times in 3 mL sterile filtered PBS and then adhered to the PEI areas of the glass slides. The cells were allowed to settle for 30 minutes after which the slides were rinsed twice in PBS and allowed to air dry and put in a moist chamber. The cover glasses were subsequently mounted with ProLong Antifade Kit (Molecular Probes) according to manufacturer’s instructions. Epifluorescence images were taken using a Zeiss Axioimager Z1 system with AxioVision software, using a 63xplan-APOCHROMAT objective, at appropriate excitation and emission wavelengths. A P. pastoris GS115 strain not carrying the recombinant gene was used as control.
2.17. Quantitative PCR
RNA was isolated using Trizol reagent (Invitrogen Life Technologies, Paisley, UK) and subjected to DNaseI (Ambion, Austin, Tx, USA) treatment to exclude genomic DNA contaminants. To generate cDNA from 1 mg RNA templates, the iScript cDNA synthesis kit (Bio-Rad laboratories, Hercules, CA, USA) was used. RNA was degraded by adding 2 µL 2.5 M NaOH to each 20 µL reaction, followed by incubation at 42˚C for 10 min. Upon neutralization using 5 µL 1 M HCl, the cDNA was diluted to 100 µL, diluted another 10 times and used for quantitative PCR using the SYBR Green PCR master mix (Applied Biosystems, Foster City, CA, USA). Each 25 µL reaction mixture consisted of 5 µL template, 12.5 µL SYBR Green PCR master mix and 0.2 µM of each primer. For all samples, controls were made, where either template or superscript was omitted during cDNA synthesis. All reactions were performed in triplicate on independent RNA preparations from different time points taken from two bioreactor cultivations using the “high” methanol feeding model, with a 7900HT Sequence Detection System (Applied Biosystems) using the Sequence Detection System software and the program: 1 cycle at 50˚C for 2 min and 95˚C for 10 min, followed by 40 cycles at 95˚C for 15 s and 60˚C for 60 s. Samples were normalized against the actin gene [22] and compared to the KAR2 gene in P. pastoris. Results were analysed using the delta delta Ct method of analysis and converted to relative expression ratio (2–ΔΔCt) for statistical analysis [23]. Sample points taken from the glycerol batch phase, where no recombinant protein expression occurs, was used as a reference for calculating upor down regulation of the KAR2 gene in response to induction. Primer sequences to the actin and KAR2 genes were designed according to [22].
3. RESULTS AND DISCUSSION
3.1. Western Blot Confirms Secretion of PSGL-1/mIgG2b/GFP but Suggests Incomplete Prepro Peptide Processing and a Secretion Bottle-Neck in the Golgi
The homodimeric mucin-type fusion protein consisting of the extracellular part of P-selectin glycoprotein ligand- 1 and the Fc part of mouse Immunoglobulin G2b (PSGL- 1/mIgG2b) was used as the model protein. PSGL-1/ mIgG2b has the theoretical capacity to carry 106 O-glycans and 6 N-glycans [24]. Expressed and secreted by Pichia pastoris, it is a highly mannosylated, 250 kDa homodimer where the two monomers are linked by a disulfide bridge [24,25]. When each PSGL-1/mIgG2b monomer also carries a GFP moiety 27 kDa in size [26] plus linkers, the total molecular size of the PSGL-1/ mIgG2b/GFP homodimer would be around 310 kDa. Western blot analysis of the culture supernatants indicated that P. pastoris secreted two anti-PSGL-1 anti-bodyreactive protein species, approximately 300 - 350 kDa in size under non-reducing conditions (Figure 1). Bands of lower molecular size were also found and probably represent degradation products, monomers or differently glycosylated species. The double band at 300 - 350 kDa correlates with dimeric PSGL-1/mIgG2b/GFP.
The Western blot of intracellular protein revealed a difference in molecular size between the soluble and insoluble fractions comparable with the molecular size difference between the two bands of the double band observed for the secreted PSGL-1/mIgG2b/GFP (Figure
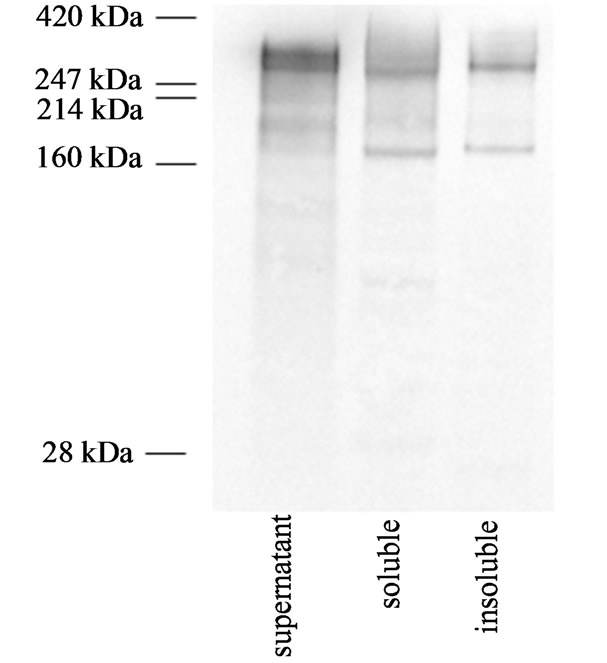
Figure 1. Representative Western blot analyses of supernatant and cell extract containing the soluble or insoluble fractions of PSGL-1/mIgG2b/GFP expressed by P. pastoris GS115. Sample was taken after 13 hours of induction under the low methanol feeding regime (F0 = 1.4 mL·h·L–1 and µ = 0.04 h–1). The same banding pattern was observed for all methanol feeding regimes. Approximately 150 ng recombinant protein was loaded and membranes were probed by antiPSGL-1 antibodies. Colorimetric detection was done using the alkaline phosphatase system as described in the Material and Methods section. Prestained Hi MarkTM (Invitrogen) was used as protein standard.
1). This difference might be explained by concomitant secretion of PSGL-1/mIgG2b/GFP with differently processed signal peptide. The alfa factor secretion signal used to direct secretion of PSGL-1/mIgG2b/GFP consists of a 19 amino acid pre signal, a 66 amino acid pro signal and a 4 amino acid spacer (two Glu-Ala repeats) [1]. The pro signal also carries three sites for N-glycosylation. Incomplete processing of the prepro peptide has been demonstrated for GFP-fusion proteins expressed by S. cerevisiae [27]. Under normal conditions the pre peptide is proteolytically removed during translocation by signal peptidase, whereas the pro peptide remains bound through the secretory pathway until it is eventually removed in the trans Golgi by the endogenous Kex2p protease [1]. In addition, two Glu-Ala repeats following the Kex2p cleavage site are removed by the Ste13 gene product exposing the native N-terminal end of the recombinant protein [1]. The differences in molecular size between the intracellular insoluble and soluble PSGL-1/mIgG2b/GFP, and between the bands in the double band of the secreted PSGL-1/mIgG2b/GFP, are similar and falls in the range of about 10 - 30 kDa. This result would be consistent with the theoretical molecular size of 7.7 kDa for the propeptide plus two Glu-Ala repeats, assumeing an average amino acid molecular size of 110 Da, and no Nlinked glycosylation. N-glycosylation of the propeptide would result in higher molecular size. Too high protein synthesis rates might have saturated the Kex2p proteases resulting in incomplete processing of the pro peptide leading to intracellular aggregation but also to some secretion of the incompletely processed form. Variation in the N-terminal is frequently observed with recombinant proteins secreted by P. pastoris [1]. Alternatively and/or in addition, the difference in molecular size could be related to different glycosylation. Different glycosylation of the same protein core has been observed to result in distinct bands of different molecular weight [28].
Western blot analysis of intracellular soluble and insoluble PSGL-1/mIgG2b/GFP revealed two anti-PSGL- 1-reactive protein species approximately 300 - 350 and 170 kDa in sizes under non-reducing conditions (Figure 1). The two bands correlate with the dimeric and monomeric form of PSGL-1/mIgG2b/GFP. The same band pattern was observed for the soluble and insoluble fractions indicating the insoluble form also consists of intact full length dimeric PSGL-1/mIgG2b/GFP or its corresponding monomer. The calculated molecular size of nonglycosylated dimeric PSGL-1/mIgG2b/GFP is 174 kDa. SDS PAGE was run also under reducing conditions to break the disulfide bond linking the two monomers in the dimer to determine if the 170 kDa bands are the monomer and not an underglycosylated dimeric species. Subsequent western blot revealed a single ~170 kDa species confirming that it is the monomer (data not shown). The molecular size of 300 - 350 kDa for the dimer or 170 kDa for the monomer is indicative of extensive Oand/or N-glycosylation, suggesting that PSGL-1/mIgG2b/GFP has progressed into Golgi before aggregation. Hence the bottle-neck to secretion of PSGL-1/mIgG2b/GFP appears to be located within the Golgi and not within the ER.
3.2. RT-qPCR of the KAR2 Gene Suggest Low ER Folding Stress
The high translational rates as imparted on the cell by the AOX1 promoter may overwhelm the folding capacity of the ER resulting in accumulation of missfolded proteins [1]. The unfolded protein response, UPR, serves to restore homeostasis in the ER following accumulation of missfolded proteins [15,29]. Briefly, increased levels of missfolded proteins in the ER induce transcription of genes encoding ER-resident chaperones, including KAR2, which improves the folding capacity in ER [29]. UPR may also reduce secretion by global suppression of protein synthesis and translocation into ER as well as enhanced degradation of missfolded proteins through a process termed ER associated degradation [16,29,30]. Accumulation of recombinant proteins in P. pastoris has been shown to induce the unfolded protein response in other studies [2]. Transcriptional activation of the KAR2 gene in response to induction may be analyzed by quantifying the KAR2 mRNA by RT-qPCR [22]. RT-qPCR analysis of the KAR2 gene was performed on the cultivations with the highest methanol feed rates to determine

Figure 2. Relative expression levels of the KAR2 gene at different cultivation phases. The relative KAR2 gene expression was compared between the different cultivation phases to investigate if induction of recombinant protein production induced KAR2 transcription. During the glycerol batch phase the AOX1 promoter should be fully repressed and no recombinant protein production should occur. During fed-batch some derepression of the AOX1 promoter occurs and during the induction phase the AOX1 promoter is fully induced. Data is based on duplicate runs but at different time points. Actin was used as control. When comparing the relative gene expressions between the time points, the glycerol batch phase was set as a reference point (zero) as the AOX1 promoter should be fully repressed at that point.
if the UPR was differentially induced before and some hours after induction. Although the data suggests a slight up-regulation during the induction phase, there is no major upor down regulations of the KAR2 gene following methanol induction (Figure 2). This would be in accordance with low folding problems in ER. Al ternatively, it may also indicate that P. pastoris has a more constitutive active UPR, which have been noted in other studies as well [22].
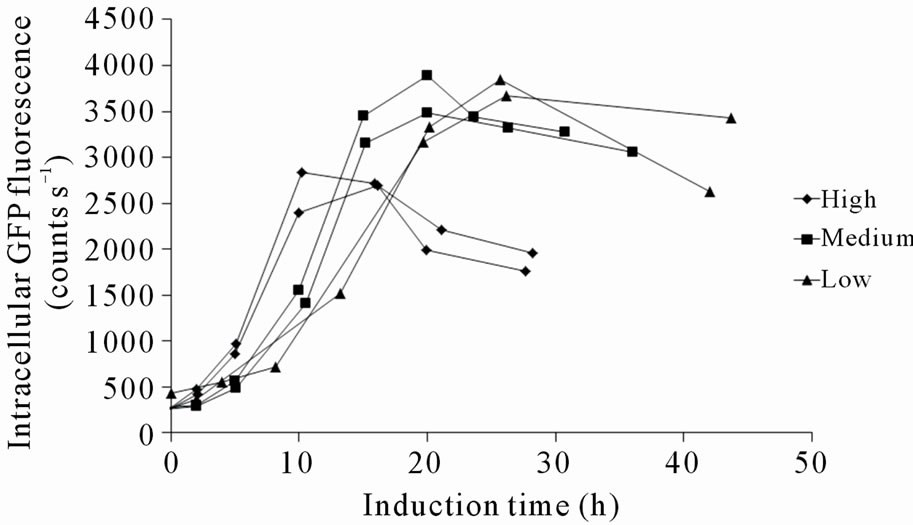
3.3. Fluorescence of Cell Pellets Shows a Gradual Accumulation of Insoluble Recombinant Protein, Suggesting a Congestion of the Secretory Pathway
The fluorescence intensity at 508 nm of the cell pellets correlated approximately with the amount of specific insoluble PSGL-1/mIgG2b/GFP which indicates a high degree of productive folding despite aggregation, Figures 3(a) and (b). The specific amount of soluble PSGL-1/ mIgG2b/GFP was consistently lower than the specific insoluble amounts, Figures 3(b) and (f). The increase in intracellular soluble PSGL-1/mIgG2b/GFP also occurred before the increase in insoluble PSGL-1/mIgG2b/GFP, which is in accordance with a gradual congestion of the secretory pathway (compare Figures 3(b) and (f)). Accumulation of insoluble PSGL-1/mIgG2b/GFP started at the time of induction whereas the soluble form accumulated already during the glycerol fed-batch phase which is consistent with the derepression of the AOX1 promoter during the fed-batch phase.
3.4. Intracellular Fusion Protein Accumulation Disturbs Secretion and Metabolic Activity of the Cells
It was generally observed that higher methanol feed rates, or methanol up-take rates, resulted in faster intracellular accumulation of both soluble and insoluble recombinant protein, which is in accordance with a higher induction of the AOX1 promoter (Figures 3(a), (b), (e) and (f)). This confirms that the protein synthesis rate can be controlled to some extent by the methanol feed rates. In contrast, the total amount of secreted fusion protein decreased with higher methanol up-take rates (compare Figures 3(c) and (e)). Although the specific rate of secretion was initially higher under higher methanol uptake rates it declined faster and reached zero already after 12 hours of induction (Figure 3(g)). At a certain time, indicated both by a peak in intracellular GFP fluorescence and intracellular PSGL-1/mIgG2b/GFP concentration, intracellular accumulation stopped and declined (Figures 3(a), (b) and (e)). This peak level also appeared to coincide with a decrease in secretion rate and methanol consumption rate of the cells (compare Figures 3(a)-(d)). To ensure that the methanol concentration in the media was growth limiting and that the cells were consuming all methanol supplied by the feed, regular controls of cells’ responsiveness to a complete stop in the methanol feed were made [11]. The “responsiveness” was taken to be the time for the dissolved oxygen tension to increase 20% after a complete stop in the methanol feed. Under conditions before the GFP fluorescence peaked, the responsiveness was 5 - 10 seconds ensuring that the methanol concentrations were very low. Off-line analysis of the culture supernatant showed that the methanol concentrations under these conditions were outside the detection limit of the HPLC instrument implying methanol concentrations <100 mg·L–1. After the GFP fluorescence peaked, the response time gradually increased to more than a minute suggesting a slight accumulation of methanol and the methanol feeds were reduced. Off-line analysis of the culture supernatant showed that the methanol concentrations still were below 500 mg·L–1 during the remainder of the cultivation. These facts suggest that the intracellular accumulation of recombinant protein reduced the methanol consumption rate which in turn caused a slight increase in residual methanol concentration. In fact, the methanol feed rates had to be decreased after these time points to fit the declining methanol consumption rates (Figure 3(e)).
Because of the decreasing productivities the cultivations were terminated at these time points (data not shown). In spite of the reduced methanol consumption rate and the high intracellular concentrations of the fusion protein, cell growth appeared not to be immediately influenced (Figure 3(h)). The fact that the reduction in methanol consumption rate and secretion were not correlated with the level of methanol feed rate or specific methanol up-take rate (data not shown) but rather with the peak levels of intracellular GFP fluorescence, suggests that the intracellular fusion protein concentrations were decisive for the reduced metabolic activity and secretion capabilities of the cells. According to the data the intracellular concentrations of insoluble fusion protein tolerable by the cells, ranged between 300 to 545 µg gDCW–1. It appeared as the cells tolerated lower concentrations of fusion protein when the rate of accumulation was higher. This might be related to the fact that the cells had a shorter time to adapt to the increasing amounts of recombinant protein. Control experiments where the P. pastoris GS115 strain without the recombinant gene was grown on methanol according to the high methanol feeding regime never displayed any reduction in methanol consumption rate during 48 hours induction (Figure 3(d)). This would be consistent with the idea that it is the intracellular concentration of fusion protein which disturbs the metabolic activity and secretion capabilities of the cells.
Postponing accumulation of PSGL-1/mIgG2b/GFP by
 (a)
(a)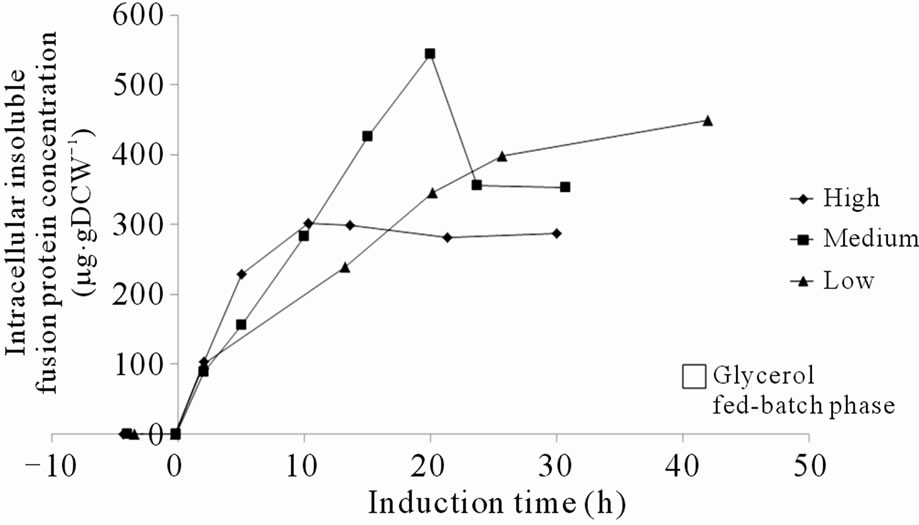 (b)
(b)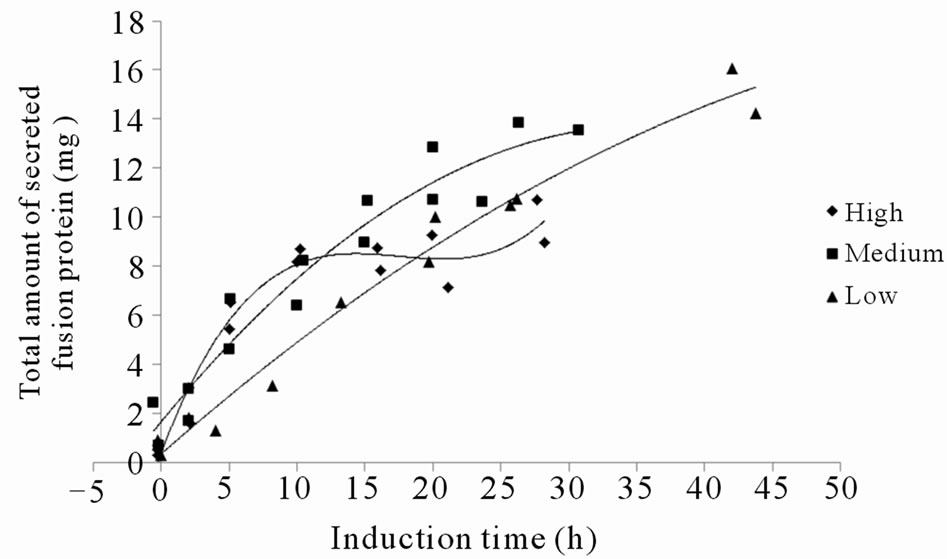 (c)
(c) (d)
(d)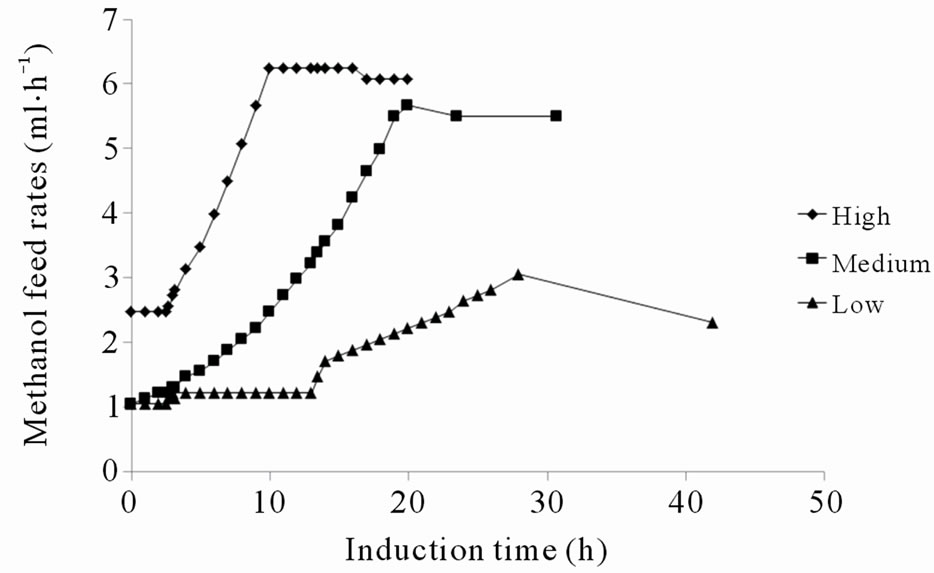 (e)
(e) (f)
(f)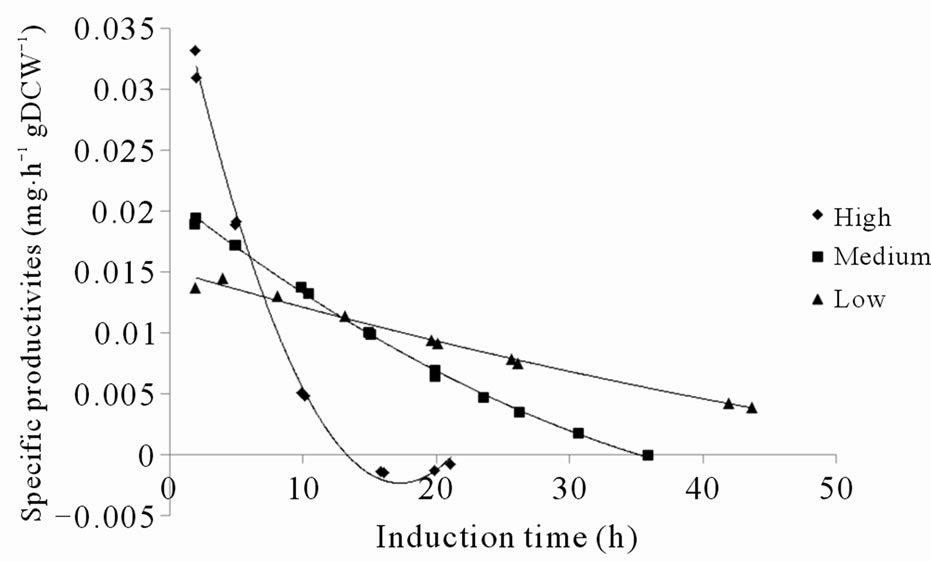 (g)
(g)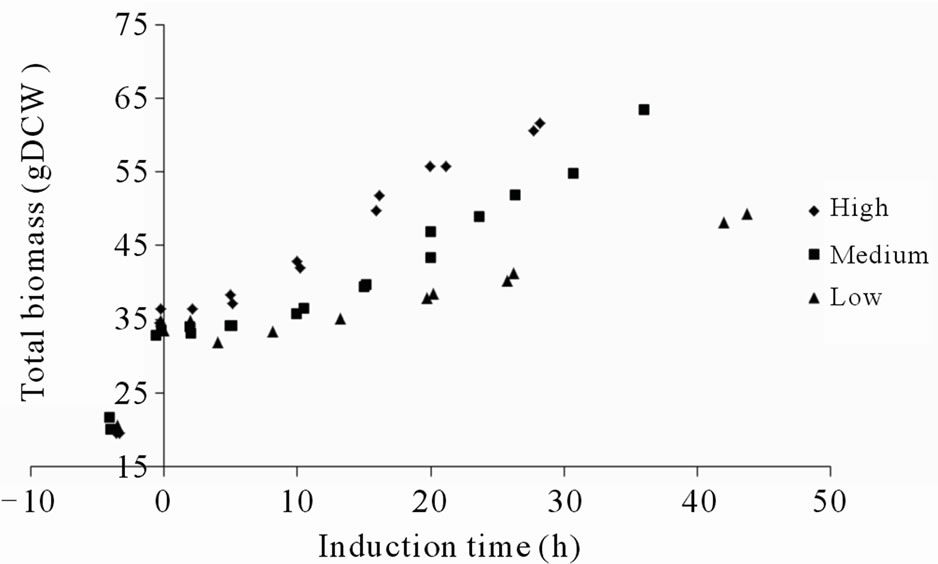 (h)
(h)
Figure 3. (a) Intracellular GFP fluorescence; (b) Insoluble intracellular fusion protein concentration; (c) Total amount of secreted fusion protein; (d) Responsivness to complete stop in methanol feed. The responsivness was taken as the time for the dissolved oxygen tension to increase 20%; (e) Methanol feed rates; (f) Soluble intracellular fusion protein concentration; (g) Specific productivities; (h) Total biomass generation (gram dry cell weight (gDCW)).
using lower methanol feed rates was favourable for maintaining secretion. Although the protein synthesis rate could be controlled to some degree by using lower methanol feed rates, the AOX1 promoter seemed too strong for the expression and secretion of PSGL-1/mIgG2b/GFP unless solving the suggested Golgi bottle-neck. If Kex2p processing of the secretion signal propeptide is limiting secretion, a possibility to resolve this would possibly be to overexpress Kex2p concomitantly with fusion protein expression. Despite the secretion bottle-necks the productivities were amongst the highest reported for GFP fusion proteins secreted by yeast reaching media concentrations up to 18 mg·L–1.
3.5. Confocal Microscopy Shows that Intracellular PSGL-1/mIgG2b/GFP Fluorescence Is Gradually Sorted to an Isolated Area Close to the Cell Wall
Confocal microscopy clearly showed an increase in green (508 nm) fluorescence intensity inside the cells with time proving that the measured fluorescence of the cell pellets stems from intracellular GFP (Figure 4). Interestingly, the distribution of GFP fluorescence inside the cells also appeared to change with time (Figure 4). Because ELISA quantification of intracellular PSGL-1/ mIgG2b/GFP correlated rather well with the observed fluorescence intensity and Western blot of intracellular PSGL-1/mIgG2b/GFP indicated full length protein, the GFP fluorescence observed with confocal microscopy is likely to reflect the localisation of full length PSGL-1/ mIgG2b/GFP. After 13 hours of induction, with the low methanol feed rate (F0 = 1.4 mL·h–1·L–1 and μ = 0.04 h–1), GFP fluorescence has generally lower specific intensity and is more evenly distributed within the cells compared to 42 hours of induction (Figure 4). After 42 hours of
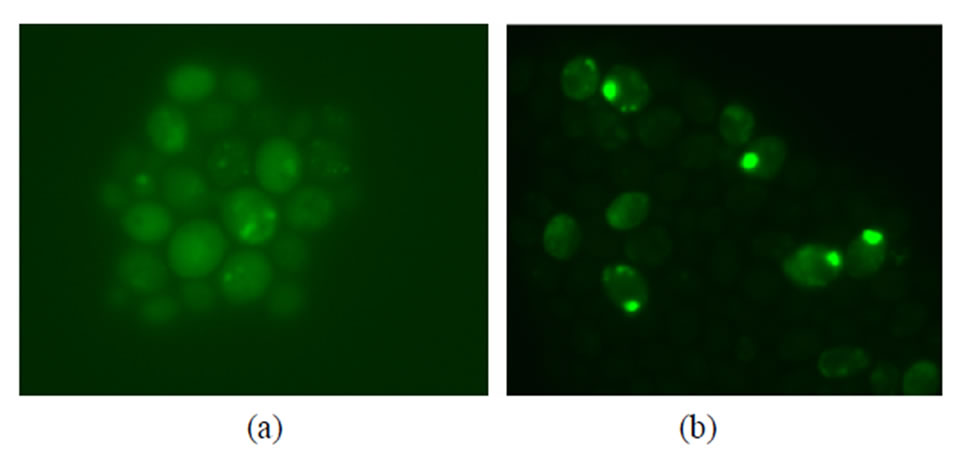
Figure 4. Confocal microscopy pictures of cells at different time points of induction using the low methanol feed rate model (F0 = 1.4 mL·h–1·L–1 and µ = 0.04 h–1). (a) Cells sampled after 13 hours of induction at 700 ms exposure time; (b) Cells sampled after 42 hours induction at 200 ms exposure time. GFP fluorescence is gradually sorted into large single spots located close to the cell wall which appears to have high concentration of fusion protein. Note that different exposure times have been used due the high GFP fluorescence at 42 hours induction.
induction the specific fluorescence is higher in intensity and polarized to one small isolated area close to the cell wall. Other studies with P. pastoris have shown that smaller elements of transitional ER and Golgi structures may fuse with one another to generate larger structures [31]. Hence, in this study it could be speculated that the concentration of fusion protein in elements from the secretory machinery, possibly the Golgi, become progressively higher and that these elements fuse with each other with time to form the larger spot seen in the confocal image (Figure 4). In addition, not all cells appeared to express PSGL-1/mIgG2b/GFP. Genetic instability has been observed in P. pastoris and has been suggested to be caused by excess methanol [32]; however, the confocal pictures were taken with cells that had been cultivated with low methanol concentration (<100 mg·L–1) suggesting other mechanisms.
4. CONCLUSION
Strong promoters, such as the methanol inducible AOX1 promoter which often is used to drive recombinant protein expression with the P. pastoris expression system, may cause intracellular accumulation of the recombinant protein which in turn may hamper secretion. In this study the secretion dynamics of a 310 - 350 kDa, GFP tagged mucin-type protein, PSGL-1/mIgG2b/GFP, under three predefined exponential methanol feeding regimes in high cell density bioreactor cultivations of P. pastoris GS115 (Mut+) were investigated. It was shown that the protein synthesis rate could be controlled by the methanol feed rates. Lower methanol feed rates reduced intracellular accumulation and secretion could be maintained for longer times. Tuning expression rates with secretion rates is therefore important for improving productivity. For PSGL- 1/mIgG2b/GFP the AOX1 promoter was too strong and using weaker promoters, such as the PEX8 or YPT1 promoters [1], would possibly allow for extended secretion times and higher yields. The large molecular size of the intracellularly accumulated fusion protein implies extensive Nand O-glycosylation which suggests that the secretion bottle-neck was located in the Golgi. This would also be consistent with the low folding stress as measured by the relative expression of the UPR controlled KAR2 gene before and after induction. The productivities were among the highest reported for GFP fusion proteins expressed in yeast, reaching media concentrations up to 18 mg·L–1 which confirms the high secretion capacity of P. pastoris.
5. ACKNOWLEDGEMENTS
This work was supported by the Research Council of Norrbotten, Innovationsbron and Längmanska företagarfonden. J. H. was supported by the Swedish Research Council (No. K2011-65X-3031-01-6) and the County Council of Västra Götaland (ALF). We also acknowledge Jeanette Bröms of Umeå University, division of clinical microbiology for technical assistance with RT-qPCR, personnel of Recopharma AB for technical assistance and Richard Lundmark of Umeå University, division of Medical Biochemistry and Biophysics, for technical assistance with Confocal Micrsoscopy.
REFERENCES
- Cereghino, J.L. and Cregg, J.M. (2000) Heterologous protein expression in the methylotrophic yeast Pichia pastoris. FEMS Microbiology Reviews, 24, 45-66. doi:10.1111/j.1574-6976.2000.tb00532.x
- Hohenblum, H., Gasser, B., Maurer, M., Borth, N. and Mattanovich, D. (2004) Effects of gene dosage, promoters, and substrates on unfolded protein stress of recombinant Pichia pastoris. Biotechnology and Bioengineering, 85, 367-375. doi:10.1002/bit.10904
- Resina, D., Cos, O., Ferrer, P. and Valero, F. (2005) Developing high cell density fed-batch cultivation strategies for heterologous protein production in Pichia pastoris using the nitrogen source-regulated FLD1 promoter. Biotechnology and Bioengineering, 91, 760-767. doi:10.1002/bit.20545
- McGrew, J.T., Leiske, D., Dell, B., Klinke, R., Krasts, D., Wee, S.F., Abbott, N., Armitage, R. and Harrington, K. (1997) Expression of trimeric CD40 ligand in Pichia pastoris: Use of a rapid method to detect high-level expressing transformants. Gene, 187, 193-200. doi:10.1016/S0378-1119(96)00747-0
- Paifer, E., Margolles, E., Cremata, J., Montesino, R., Herrera, L. and Delgado, J.M. (1994) Efficient expression and secretion of recombinant alpha-amylase in Pichia pastoris using 2 different signal sequences. Yeast, 10, 1415-1419. doi:10.1002/yea.320101104
- Zhao, H.L., He, Q., Xue, C., Sun, B., Yao, X.Q. and Liu, Z.M. (2009) Secretory expression of glycosylated and aglycosylated mutein of onconase from Pichia pastoris using different secretion signals and their purification and characterization. FEMS Yeast Research, 9, 591-599. doi:10.1111/j.1567-1364.2009.00498.x
- Bao, W.G. and Fukuhara, H. (2001) Secretion of human proteins from yeast: Stimulation by duplication of polyubiquitin and protein disulfide isomerase genes in Kluyveromyces lactis. Gene, 272, 103-110. doi:10.1016/S0378-1119(01)00564-9
- Mukaiyama, H., Tohda, H. and Takegawa, K. (2010) Overexpression of protein disulfide isomerases enhances secretion of recombinant human transferrin in Schizosaccharomyces pombe. Applied Microbiology and Biotechnology, 86, 1135-1143. doi:10.1007/s00253-009-2393-x
- Marx, H., Sauer, M., Resina, D., Vai, M., Porro, D., Valero, F., Ferrer, P. and Mattanovich, D. (2006) Cloning, disruption and protein secretory phenotype of the GAS1 homologue of Pichia pastoris. FEMS Microbiology Letters, 264, 40-47. doi:10.1111/j.1574-6968.2006.00427.x
- Cos, O., Ramon, R., Montesinos, J.L. and Valero, F. (2006) Operational strategies, monitoring and control of heterologous protein production in the methylotrophic yeast Pichia pastoris under different promoters: A review. Microbial Cell Factories, 5, 17. doi:10.1186/1475-2859-5-17
- Jahic, M., Veide, A., Charoenrat, T., Teeri, T. and Enfors, S.O. (2006) Process technology for production and recovery of heterologous proteins with Pichia pastoris. Biotechnology Progress, 22, 1465-1473.
- Jahic, M., Gustavsson, M., Jansen, A.K., Martinelle, M. and Enfors, S.O. (2003) Analysis and control of proteolysis of a fusion protein in Pichia pastoris fed-batch processes. Journal of Biotechnology, 102, 45-53. doi:10.1016/S0168-1656(03)00003-8
- Zhang, Y.W., Liu, R.J. and Wu, X.Y. (2007) The proteolytic systems and heterologous proteins degradation in the methylotrophic yeast Pichia pastoris. Annals of Microbiology, 57, 553-560. doi:10.1007/BF03175354
- Huang, D. and Shusta, E.V. (2006) A yeast platform for the production of single-chain antibody-green fluorescent protein fusions. Applied Environmental Microbiology, 72, 7748-7759. doi:10.1128/AEM.01403-06
- Kimata, Y., Kimata, Y.L., Shimizu, Y., Abe, H., Farcasanu, R.C., Takeuchi, M., Rose, M.D. and Kohno, K. (2003) Genetic evidence for a role of BiP/Kar2 that regulates Ire1 in response to accumulation of unfolded proteins. Molecular Biology of the Cell, 14, 2559-2569. doi:10.1091/mbc.E02-11-0708
- Schroder, M. and Kaufman, R.J. (2005) The mammalian unfolded protein response. Annual Review of Biochemistry, 74, 739-789. doi:10.1146/annurev.biochem.73.011303.074134
- Travers, K.J., Patil, C.K., Wodicka, L., Lockhart, D.J., Weissman, J.S. and Walter, P. (2000) Functional and genomic analyses reveal an essential coordination between the unfolded protein response and ER-associated degradation. Cell, 101, 249-258. doi:10.1016/S0092-8674(00)80835-1
- Gemmill, T.R. and Trimble, R.B. (1999) Overview of Nand O-linked oligosaccharide structures found in various yeast species. BBA-General Subjects, 1426, 227-237. doi:10.1016/S0304-4165(98)00126-3
- Liu, J.N., Qian, Y.J. and Holgersson, J. (1997) Removal of xenoreactive human anti-pig antibodies by absorption on recombinant mucin-containing glycoproteins carrying the Gal alpha 1,3Gal epitope. Transplantation, 63, 1673- 1682. doi:10.1097/00007890-199706150-00023
- Gustavsson, M., Lehtio, J., Denman, S., Teeri, T.T., Hult, K. and Martinelle, M. (2001) Stable linker peptides for a cellulose-binding domain-lipase fusion protein expressed in Pichia pastoris. Protein Engineering, 14, 711-715. doi:10.1093/protein/14.9.711
- Liu, J.N., Gustafsson, A., Breimer, M.E., Kussak, A. and Holgersson, J. (2005) Anti-pig antibody adsorption efficacy of alpha-Gal carrying recombinant P-selectin glycoprotein ligand-1/immunoglobulin chimeras increases with core 2 beta 1,6-N-acetylglucosaminyltransferase expression. Glycobiology, 15, 571-583. doi:10.1093/glycob/cwi037
- Guerfal, M., Ryckaert, S., Jacobs, P.P., Ameloot, P., Van Craenenbroeck, K., Derycke, R. and Callewaert, N. (2010) The HAC1 gene from Pichia pastoris: Characterization and effect of its over expression on the production of secreted, surface displayed and membrane proteins. Microbial Cell Factories, 9, 49. doi:10.1186/1475-2859-9-49
- Livak, K.J. and Schmittgen, T.D. (2001) Analysis of relative gene expression data using real-time quantitative PCR and the 2(T)(-Delta Delta C) method. Methods, 25, 402- 408. doi:10.1006/meth.2001.1262
- Gustafsson, A. and Holgersson, J. (2006) A new generation of carbohydrate-based therapeutics: Recombinant mucin-type fusion proteins as versatile inhibitors of protein-carbohydrate interactions. Expert Opinion on Drug Discovery, 1, 161-178. doi:10.1517/17460441.1.2.161
- Gustafsson, A., Sjoblom, M., Strindelius, L., Johansson, T., Fleckenstein, T., Chatzissavidou, N., Lindberg, L., Angstrom, J., Rova, U. and Holgersson, J. (2011) Pichia pastoris-produced mucin-type fusion proteins with multivalent O-glycan substitution as targeting molecules for mannose-specific receptors of the immune system. Glycobiology, 21, 1071-1086. doi:10.1093/glycob/cwr046
- Tsien, R.Y. (1998) The green fluorescent protein. Annual Review of Biochemistry, 67, 509-544. doi:10.1146/annurev.biochem.67.1.509
- Huang, D. and Shusta, E.V. (2006) A yeast platform for the production of single-chain antibody-green fluorescent protein fusions. Applied and Environmental Microbiology, 72, 7748-7759. doi:10.1128/AEM.01403-06
- Van den Steen, P., Rudd, P.M., Proost, P., Martens, E., Paemen, L., Kuster, B., van Damme, J., Dwek, R.A. and Opdenakker, G. (1998) Oligosaccharides of recombinant mouse gelatinase B variants. BBA-General Subjects, 1425, 587-598. doi:10.1016/S0304-4165(98)00113-5
- Ng, D.T.W., Spear, E.D. and Walter, P. (2000) The unfolded protein response regulates multiple aspects of secretory and membrane protein biogenesis and endoplasmic reticulum quality control. Journal of Cell Biology, 150, 77-88. doi:10.1083/jcb.150.1.77
- Bernales, S., Papa, F.R. and Walter, P. (2006) Intracellular signaling by the unfolded protein response. Annual Review of Cell and Developmental Biology, 22, 487-508. doi:10.1146/annurev.cellbio.21.122303.120200
- Bevis, B.J., Hammond, A.T., Reinke, C.A. and Glick, B. S. (2002) De novo formation of transitional ER sites and Golgi structures in Pichia pastoris. Nature Cell Biology, 4, 750-756. doi:10.1038/ncb852
- Curvers, S., Linnemann, J., Klauser, T., Wandrey, C. and Takors, R. (2001) Recombinant protein production with Pichia pastoris in continous fermentation—Kinetic analysis of growth and product formation. Chemie Ingenieur Technik, 73, 1615-1621. doi:10.1002/1522-2640(200112)73:12<1615::AID-CITE1615>3.3.CO;2-Y