Modern Economy
Vol.10 No.04(2019), Article ID:91801,12 pages
10.4236/me.2019.104080
Research on China’s “Lewis Turning Point” and Efficiency Analysis of Each Province―Based on DEA and SFA Methods
Shu Liu
Economy College, Jinan University, Guangzhou, China
![]()
Copyright © 2019 by author(s) and Scientific Research Publishing Inc.
This work is licensed under the Creative Commons Attribution International License (CC BY 4.0).
http://creativecommons.org/licenses/by/4.0/


Received: March 22, 2019; Accepted: April 13, 2019; Published: April 16, 2019
ABSTRACT
Based on the current situation of China’s labor market, this paper studies whether China crosses the “Lewis Turning Point” in 2009-2017. Research shows that China has not yet entered the “Lewis Turning Point”. This paper uses the marginal productivity of labor as the criterion for judging the problem and calculates the capital stock through the perpetual inventory method to further estimate the production function and the marginal productivity of labor. Although China has not entered the “Lewis Turning Point”, due to the heterogeneity between cities, some cities may have entered the “Lewis Turning Point” in advance. This paper further analyzes the provinces of China and uses DEA and SFA methods to analyze the efficiency of capital stocks and labor input in various provinces. The results show that some cities are inefficient due to excessive labor input. China can transfer labor through a reasonable labor policy, thereby avoiding labor shortages in some cities and ultimately improving the efficiency of resource allocation in each province.
Keywords:
“Lewis Turning Point”, Perpetual Inventory Method, DEA, SFA

1. Introduction
The labor problem is inseparable from the national economy and politics, and the efficient solution of the labor issue has a positive effect on people’s livelihood and social development. From the perspective of China’s national conditions, China has 960 square meters of land area and abundant natural resources, with a population of 1.3 billion, accounting for one-fifth of the world’s population. The large number of labors provides the advantage of low production costs for the development of Chinese enterprises, while the development of enterprises drives the rapid development of China’s economy. However, the trend of social development is also inevitable in China, and China is gradually facing the problem of shifting the labor force from surplus to shortage. The phenomenon of “labor shortage” has gradually spread from the developed areas along the Pearl River Delta and the Yangtze River Delta to inland areas. Due to the imbalance of labor supply in the market, the wages of the labor force have increased substantially, and some enterprises have “escaped” under the situation of greatly increased operating costs. For example, many processing enterprises have moved from the southeast coastal areas of China to Southeast Asia. Based on these phenomena, scholars have asked: Has China’s “Lewis Turning Point” arrived? If China’s “Lewis Turning Point” has arrived, China’s demographic dividend will quickly disappear, and the Chinese economy will also enter a stage of economic downturn and economic restructuring due to labor shortages. Reference [1] believes that there is still a system inflection point of labor migration in China before the arrival of China’s “Lewis Turning Point”. Before the proportion of the primary industry fell to 5%, China was in the process of shifting labor from rural to urban areas. As labor costs continue to increase, some scholars believe that China’s “Lewis Turning Point” has arrived [2] [3] ; scholars have different views on this issue. Reference [4] thought that China’s national conditions are more complicated, and the current labor surplus and “Lewis turning point” exist at the same time. Some scholars believe that China has not yet entered the “Lewis Turning Point” stage. The labor wage gap exists between industries and regions. Urbanization and industrialization are the main reasons for the “labor shortage”. China’s “Lewis Turning Point” has not yet arrived [5] , Reference [6] pointed out that population fluctuations are the cause of the “labor shortage”. Reference [7] further predicted the “Lewis Turning Point” and believed that China will reach the “Lewis Turning Point” between 2020 and 2025. Scholars do not have a unified view on whether China has reached the “Lewis Turning Point” issue. This article further analyzes this issue. Based on scholars’ research, the contribution points of this paper have the following three points: 1) Support for research during the period 2009-2017. This paper combines the Chinese labor market with Lewis turning point theory and analyzes the state of China’s labor market from 2009 to 2017. Scholars’ research on the labor market turning point is mostly before 2010, and the research conclusions lack data support after 2010. Although some scholars have made predictions about Lewis turning point, they have not further tracked the progress of the prediction. The research in this paper provides support for scholars’ research. 2) Micro analysis of the city. Due to the Chinese hukou system, there is a period of labor migration from rural to urban areas before the labor shortage in China. Therefore, this paper not only studies the entire Chinese labor market, but also studies the efficiency of each city’s labor market. 3) A variety of methods to compare to ensure the objectivity of the results. In this paper, DEA and SFA are used to compare and rank the labor efficiency of 31 cities. However, there are still some limitations in this paper: 1) Due to the different methods of calculating the capital stock, the calculated capital stock values are different. 2) There is no specific data index for the judgment method of “Lewis Turning Point”, and there is scholar’s subjectivity in judging. 3) Although it can be judged that China’s current labor market is at a stage, it cannot specifically predict the arrival time of the “Lewis Turning Point”. The structure of this paper is as follows: The first part, introduction; the second part, the realistic observation of “Lewis turning point”; the third part, data description; the fourth part, model construction; the fifth part, the empirical results; the sixth part, conclusion and policy analysis.
2. Realistic Observation of “Lewis Turning Point”
2.1. Dual Economic Development Theory
The economist Lewis proposed a dual economic development model [8] , in which the binary refers to the departments produced by traditional production methods (represented by the traditional agricultural sector) and the sectors produced by modern production methods (represented by the industrial sector and cities). The development model can be divided into two phases: the first phase of labor surplus. In the second stage, there is a shortage of labor. The modern industrial sector absorbs the surplus labor of all traditional sectors, and there is still a large demand in the market. As shown in Figure 1, in the first stage, the labor supply is unlimited, and the wage level of the workers is unchanged. In the second stage, the supply in the market is less than demand, and the wage at this stage depends on the marginal productivity of the labor. The turning point in the first phase to the second phase is the “Lewis Turning Point”. In 1972, Lewis proposed two points of turning point [9] . After the dual economy enters the labor shortage stage, as the labor productivity of agriculture continues to increase, the rural surplus labor force is further released, and the development of the modern industrial sector exceeds the population growth, resulting in the wages of the sector will eventually rise. When the traditional agricultural sector is equal to the marginal product of the modern industrial sector, the traditional agricultural sector is roughly equivalent to the wages of the modern industrial sector, which means that the urban-rural integration of the labor market has taken shape. The entire economy is fully commoditized, and economic development will end the surplus state of the dual economy, and it will begin to transform into the one-element economic state of the neoclassical school. At this time, the “Lewis second turning point” begins. China’s household registration system determines the process of rural population transfer to the city before the labor force turns into a shortage. The city further absorbs the rural labor force. This stage is the period between the intersection of AD2 and AS and the intersection of AD3 and AS in Figure 1. Further, the transformation of China’s labor force into a shortage phase is actually the “Lewis second turning point”. The next article in this article analyzes the “Lewis second turning point”.
2.2. Realistic Observation in China
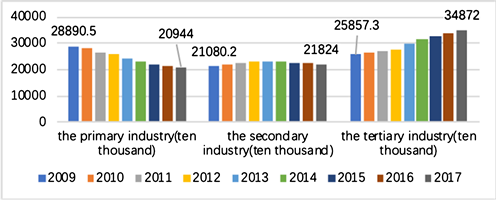
Since the reform and opening up, China’s industrial structure has been gradually optimized and upgraded, and the changes in the number of employed people in various industries reflect the state of China’s labor force. This paper selects the data from 2009 to 2017 for analysis. As shown in Figure 2, the employment of the primary industry shows a decreasing trend, and the secondary industry appears to increase first and then decrease. In 2017, the number of employed people in the second and primary industries was close to the same, and the number of employed people in the tertiary industry was about 1.5 times that of the secondary industry. The number of employed persons in the tertiary industry continued to increase from 2009 to 2017. This indicates that China’s industrial structure has been further optimized and upgraded, and the labor force has gradually shifted from the primary industry to the secondary and tertiary industries. From the analysis of the total number of employed persons, the total number of employed persons in 2009 was 758.28 million. In 2017, the total number of employed persons was 18.12 million higher than that in 2009, and the total number of employed persons reached 77.64 million. The labor force in the market is increasing, and the market absorbs the surplus labor to be employed. This also indicates that the market demand for labor is increasing. Increased market

Figure 1. Supply and demand.
 Note: The data comes from the National Bureau of Statistics.
Figure 2. Number of employed people (by industry).
demand is not the only way to increase labor, and changes in population are also sources of increased labor. In 2017, the total population of the country was higher than the 56 million in 2009. The change in population was derived from two aspects: 1) The population mortality rate was reduced. Due to the rapid development of medical conditions, the population growth caused by the increase in life expectancy in China. 2) Birth rate leads to an increase in population. The birth rate in 2017 increased by 0.48‰ to 12.43‰ compared with 2009, further indicating that China’s future labor reserve is increasing. If our birth rate is lower than the aging rate, then we will also face the dilemma of labor reduction. Therefore, we further analyze the demographic structure. In 2017, the number of people over 65 years old was 45.24 million more than in 2009. In 2017, the population aged 15 - 64 was 23.45 million more than in 2009 (data from the National Bureau of Statistics of China). Although the labor force is increasing, the number of potential labor force increases is lower than the increase in population aging. Without a positive policy, we may face a shortage of labor in the future. In summary, the increase in the labor force indicates that China’s demographic dividend has not completely disappeared, but with the development of the economy, the market’s demand for labor has gradually increased. If the rate of labor increase is lower than the market’s increase in labor demand, China still Will enter the stage of labor shortage.
The supply and demand relationship in the labor market determines the wages of labor. If China enters the “Lewis turning point”, the labor shortage will lead to a sharp rise in labor wages. We analyze the changes in labor wages to determine the state of China’s labor market. The average wage of urban workers is shown in Figure 3. In 2009, the average wage of urban workers was 32,244 yuan. In 2017, the average wage was nearly doubled in 2009, and the average wage of the labor force increased year by year. The changes in China’s labor wages are consistent with the characteristics of the labor shortage phase, but this does not mean that China’s “Lewis Turning Point” has arrived. The average wage increase of the labor force may be related to economic operations. The
 Note: The data comes from the National Bureau of Statistics.
Figure 3. Average wages of urban workers (yuan).
economic development will increase the price of animals, and the average wage of employed people will also rise.
In order to further study the rise in the average wage of China’s labor force, it is mainly due to supply and demand or economic development. We analyze the changes in the GDP index and the consumer price index. If the economy develops rapidly at this stage, we will not be able to conclude that labor wages are caused by supply and demand. As shown in Figure 4, there is a significant increase in the GDP index and the consumer price index at this stage. In the case of a stable economy, the average wage of the labor force increases with economic development. Excluding the exogenous factors of economic development, is there still a correlation between per capita wages and the imbalance between labor supply and demand? In order to study this problem, we continue to analyze the changes in the number of employed people. If the increase in wages is accompanied by a decrease in the number of laborers, it can be said that the rise in wages is caused by labor shortages. Otherwise, this view will not hold. As shown in Figure 5, the number of employed people has risen slightly. It is worth noting that
 Note: The data comes from the National Bureau of Statistics.1978 is the benchmark.
Figure 4. Consumer price index and gross domestic product index.
 Note: The data comes from the National Bureau of Statistics.
Figure 5. Number of employed persons.
when distinguishing between urban and rural areas, we find that the number of employed people in urban areas is gradually rising, and rural employment is on the opposite trend. In summary, we preliminarily speculated that China has not yet entered the “Lewis second turning point”. At present, China is in the stage of rural labor migration to urban labor. In the following part, we will further verify this conclusion.
3. Data Description
The data in this paper is based on the 2009-2017 panel data published by the National Bureau of Statistics. The main variables include the fixed asset investment price index (based on 1990), the total fixed asset investment of the whole society, the fixed growth rate, the depreciation rate, the number of employed persons in the secondary industry, the total industrial production value, and the capital stock. Among them, the capital stock variable needs to be calculated by other variables. Since the value of the depreciation rate is missing, we need to use other methods to get the data. The currently used solutions are as follows: 1) Select a fixed depreciation rate [10] [11] . 2) Using the PIM method, the depreciation rate is first classified and then weighted to obtain the total depreciation rate [12] [13] . 3) Based on the national economic identity [14] . In this paper, the fixed depreciation rate method is used to select the same depreciation rate of 6% as [11] . The main variables are described in Table 1.
4. Model Construction
In this section, we describe the method of judging the Lewis inflection point and further define the efficiency.
4.1. The Method of Judging “Lewis Turning Point”
In the above, we conduct a preliminary analysis of the current situation in China. The following content, we choose a more standardized theoretical framework to judge. When labor is turned into a shortage, workers’ wages depend on the marginal productivity of labor. Some scholars have pointed out that if the marginal

Table 1. Main variable description.
productivity of labor in the industrial sector rises significantly from the base period, then it can be judged that this economy has surpassed the Lewis turning point during this period [8] . This article uses the same method to measure. Since the calculation of labor marginal productivity, the production function needs to be calculated. We assume that the production function conforms to the Cobb Douglas production function form, and the production function form is as in Equation (1):
. (1)
In Equation (1), is the total output, K is the capital stock, L is the labor , , and . Since the capital stock in the Cobb Douglas production function cannot be directly obtained, further estimation is needed. The current perpetual inventory method is the most commonly used method for estimating capital stock. This paper uses this method to estimate. The basic formula is as follows:
. (2)
. (3)
In Equations (2) and (3), I is the fixed capital investment amount of the whole society, P is the fixed asset price index, d is the depreciation rate, and g is the fixed asset growth rate.
4.2. Definition of Efficiency
“Efficiency” generally adopts the Pareto optimal concept in economics, and there is no situation that increases one’s interests without harming other people’s interests. [15] pointed out that economic efficiency is divided into three kinds of efficiencies in microeconomic theory, namely, allocation efficiency, technical efficiency, and dynamic efficiency. Economic efficiency is defined as:
. (4)
Economic efficiency refers to the ratio of the ideal minimum cost to the actual cost of the output level. When , it is called comprehensive effective, and when , it is called comprehensive invalid. In this paper, the economic efficiency values are obtained for each province. When the efficiency value is lower than 1, it indicates that the province still has inefficiency and needs further improvement. The lower the efficiency value, the higher the inefficiency of the province.
5. Empirical Results
5.1. Labor Marginal Productivity Calculation
Through the perpetual inventory method, we calculate the value of the capital stock, as shown in the second column of Table 2. Further, we estimate the production function. In order to facilitate the processing of the data, we take a logarithmic regression analysis of the Equation (1). Based on the estimated capital
Table 2. Capital stock and labor marginal productivity in the industrial sector.
stock and labor regression coefficient, we write Equation (1) as . The marginal productivity of labor is calculated according to the production function, as shown in the third column of Table 2. During the period from 2009 to 2017, the marginal productivity of industrial labor showed an upward trend, but it did not rise significantly. We believe that China will reach the “Lewis second turning point” during 2009-2017. At present, there is no shortage of labor in China, and the main reason for the rise in wages for workers is economic development. However, we do not deny that there is a heterogeneous view between cities. Some cities in China may have entered the “Lewis second turning point” in advance, which means that some cities have labor shortages, while in other cities, there are still surplus people to be employed. This phenomenon has caused the inefficiency of China’s labor force. The state can promote the transfer of labor between cities through reasonable policy guidance and further improve labor efficiency. In the next section, we analyzed the labor efficiency of China’s provinces in 2016.
5.2. Labor Efficiency in Different Provinces
This part of the study studied the labor efficiency of each province in 2016, including 31 research objects (22 provinces, 5 autonomous regions, 4 municipalities). The calculation method of the capital stock of fixed assets is calculated by [13] . In the frontier analysis method of measurement efficiency, it is divided into parameter and non-parameter methods according to the production function form. Stochastic frontier analysis (SFA) is a commonly used method in parameter method. Non-parametric method is represented by data envelopment analysis (DEA). In this paper, the stock of assets and the number of employed persons is used as input variables, and the gross national product of each province is the output variable. The efficiency values and rankings of each province are calculated by DEA and SFA, as shown in Table 3. Column (2) is a provincial efficiency value calculated using the DEA method, and columns (3)-(4) are ranking
Table 3. Efficiency value and ranking.
the efficiency values of the different methods. From the ranking point of view, the rankings of the two methods are similar, and the following analysis is based on the DEA efficiency value.
Table 3 shows that the provinces with lower rankings are mostly cities in the northwest, and the top cities are the eastern coastal cities. The economic development of the eastern coastal cities is rapid, so the resource allocation efficiency is generally higher than that of the northwestern cities. It is worth noting that the efficiency values of the top three are all higher than 0.9, but the fourth Jiangsu province is only 0.773, and the capital and labor input efficiency is obviously broken. Although Jiangsu ranks high, there is still a high inefficiency. Further analysis, we found that some cities in the central region ranked lower than the northwest region, which is inconsistent with its economic development level. For example, in 2016, the total GDP of Henan Province ranked fifth in the country, but its efficiency ranking was only 27. Since Henan is China’s most populous province, we further infer that the labor force is causing its inefficiency, and the large investment in labor has caused inefficiency.
6. Conclusions and Policy Recommendations
Through an analysis of the marginal productivity of China’s labor, we initially determined that China’s “Lewis second turning point” has not yet arrived. However, we do not object to the fact that some Chinese cities have entered the “Lewis Turning Point” ahead of schedule. This is mainly due to the uneven distribution of labor between cities. To this end, we have studied the efficiency of capital stock and labor input in cities. Studies have shown that the efficiency values in the Northwest are generally lower than those in the eastern coastal areas. This is mainly because the eastern coastal areas have absorbed more overseas and mainland investment due to their geographical advantages. The economic development of the eastern coastal areas is rapidly higher than that of the western regions. Although China has implemented partial support for the western plan, from the perspective of efficiency in 2016, the support for the west still needs to increase. On the other hand, some provinces with large populations are inefficient due to excessive labor input, while some cities have labor shortages. In response to this problem, we suggest that the state introduces policies to the populous provinces to support the flow of labor to the western and eastern coastal areas where the labor force is lacking. The rational allocation of labor also increases the efficiency of labor outflows and inflows, thereby increasing the average labor efficiency of the entire country.
Conflicts of Interest
The author declares no conflicts of interest regarding the publication of this paper.
Cite this paper
Liu, S. (2019) Research on China’s “Lewis Turning Point” and Efficiency Analysis of Each Province―Based on DEA and SFA Methods. Modern Economy, 10, 1178-1189. https://doi.org/10.4236/me.2019.104080
References
- 1. Yuan, Z.G. (2010) Three Questions about China’s “Lewis Turning Point”. Contemporary Economy, No. 19, 6-8.
- 2. Shen, Y. and Zhu, S.F. (2014) Lewis Turning Point, Labor Supply and Demand and Industrial Structure Upgrading. Research on Financial and Economic Issues, No. 1, 42-47.
- 3. Cai, W. (2010) Lewis Turning Point and the Transformation of Public Policy Directions—Some Characteristic Facts about Social Protection in China. Chinese Social Sciences, No. 6, 125-137.
- 4. Wang, X. and Weaver, N. (2013) Surplus Labour and Urbanization in China. Eurasian Economic Review, 3, 84-97.
- 5. Zhou, Y. and Yan, J.D. (2012) Lewis Turning Point. Open Economy and China’s Dual Economic Transformation. Nankai Economic Research, No. 5, 3-17.
- 6. Su, Y.Q. and Wang, Z.G. (2016) Lewis Turning Point, or the Population of Eastlin’s Population?—Testing and Re-Evaluation of the Cause of Labor Shortage. East China Economic Management, 30, 69-76.
- 7. Das, M. and N’Diaye, P.M. (2014) Chronicle of a Decline Foretold: Has China Reached the Lewis Turning Point? IMF Working Papers.
- 8. Lewis, W.A. (1954) Economic Development with Unlimited Supplies of Labour. The Manchester School, 22, 139-191. https://doi.org/10.1111/j.1467-9957.1954.tb00021.x
- 9. Lewis, W.A. (1972) Reflections on Unlimited Labor. In: DiMarco, L.E., Ed., International Economics and Development, Elsevier, New York, 75-96. https://doi.org/10.1016/B978-0-12-216450-7.50017-7
- 10. Wang, Y. and Yao, Y. (1999) Sources of China’s Economic Growth, 1952-99: Incorporating Human Capital Accumulation: The World Bank.
- 11. Hall, R.E. and Jones, C.I. (1999) Why Do Some Countries Produce So Much More Output per Worker Than Others? The Quarterly Journal of Economics, 114, 83-116. https://doi.org/10.1162/003355399555954
- 12. Shan, H. and Shi, B. (2008) Return on Capital of China’s Industrial Sector: 1978-2006. Industrial Economics Research, No. 6, 1-9.
- 13. Zhang, J., Wu, G.Y. and Zhang, J.P. (2004) Estimation of China’s Inter-Provincial Physical Capital Stock: 1952-2000. Economic Research Journal, 10, 35-44.
- 14. Xu, X.X., Zhou, J.M. and Shu, Y. (2007) Estimation of Three Industrial Capital Stocks in China’s Provinces. Statistical Research, 245, 6-13.
- 15. Roskill, T.G. (1993) Economic Benefits and Economic Efficiency. Economic Research, 6, 38-40.