Modern Economy
Vol.07 No.08(2016), Article ID:69253,10 pages
10.4236/me.2016.78093
Industrial Structure Change in Chinese Cities: Measurement Based on the Extent and Quality
Min Liu1*, Liangxiong Huang2, Jinshan Liu1
1Department of Economics, School of Economics of Jinan University, Guangzhou, China
2Guangdong Research Institute for International Strategies, Guangdong University of Foreign Studies, Guangzhou, China

Copyright © 2016 by authors and Scientific Research Publishing Inc.
This work is licensed under the Creative Commons Attribution International License (CC BY).
http://creativecommons.org/licenses/by/4.0/


Received 22 June 2016; accepted 25 July 2016; published 28 July 2016
ABSTRACT
Promoting industrial restructure and optimizing industrial structure are the keys to improve ecological environment and upgrade products’ global value chain. From aspects of the extent of industrial change and productivity of industrial upgrading, by constructing the extent index of industrial change and quality index of industrial upgrading, we examine and evaluate the industrial structure change of 270 cities of China since 1999. This paper finds that, the extent of China’s industrial structure change in 1999-2007 appears to follow an inverted U-shaped trend with a turning point emerging in 2004. The productivity index of industrial upgrading rises and China’s industrial structure increasingly depends on industries with high productivity and high technology complexity. Eastern regions are characterized by biggest change and the best quality, better in the central and the worst in the west. However, from 2001, the regional difference of the extent of industrial change and quality of industrial upgrading is narrowing, the spatial distribution pattern of big change of the industrial structure in the east and the small change of the west is gradually broken down, the quality of industrial structure converging.
Keywords:
Industrial Structure Adjustment, Extent, Quality, Total Factor Productivity

1. Introduction
China is experiencing unprecedented economic and social transformation; the environment, resource and ecology problems it faced during its industrialization process have not been confronted by other industrialized countries [1] . On the other hand, “made in China” products lie in the low-end of the global value chain and the low- end of the smile curve, thus, Chinese manufacturing industry can get only meager profit. Nowadays, the global economic situation is under major change, China needs to adjust its industrial structure, or in other words, China needs to optimize its industrial structure and establish a new and modern industrial development system, in order to protect the ecological environment and enhance Chinese manufacturing industry’s position in the global value chain.
The industrial structure refers to the constitution of each industry, the connection between each industry and their ratio relationship. Since researches on industrial structure became part of economics, adjustment of industrial structure has been regarded as an important driving force of economic growth. Industrial structural adjustment includes four aspects: structural changes in Three Industry, structural changes in primary industry, structural changes in secondary industry and structural changes in tertiary industry. As China is in the transition period, it may be particularly important to gain driving force of economic growth, construct ecological civilization and exalt Chinese products’ position in global value chain by optimizing industrial structure.
Therefore, domestic scholars have paid a lot of attention to the researches about industrial structural adjustment. However, it is still lack of studies with systematic measurements and analysis of industrial structural adjustment. First, part of scholars studied the extent of industrial structural adjustment. For example, Song et al. [2] and Huang et al. [3] focused on the study of the extents of industrial structural adjustment of the four digit industries in each region of China, but they ignored to assess the adjustments’ quality. Second, part of scholars followed those high productive industries closely, and used the growth of those industries as a main measure to assess the adjustments’ quality. For example, Zhang and Gao [4] took the growth of high-tech industry as an important proof of industrial structural adjustment, they investigated the impacts of fiscal policy on the growth. So did Pang and Li [5] , they made judgments of Chinese new industrialization path. However, it needs appraisements under pattern of world industrial division to judge whether the growth of high-tech industry may lead to the adjustment and promotion of Chinese industrial structure. Third, part of scholars compared the gap of industrial structure of China and those advanced levels in the world from the difference of multinational industrial structure. For example, Zhou and Zhang [6] inspected the ratio of three industries; and Li et al. [7] compared Chinese industrial structure with world’s developed countries and found that the ratio of second industry in China was not very high, so they suggested that the industrial structure needed further adjustment. Then, Huang et al. [8] reviewed the existing literatures and find that it is lack of studies with systematic measurements and analysis of industrial structural adjustment. Thus, from three dimensions: adjustment range, adjustment quality and adjustment path, they tried to investigate and evaluate the industrial structural adjustment since 1999 using four indexes: extent index of industrial structure change, industrial structure productivity index, industrial structure complexity index and the industrial structure similarity index.
The limits of most of the literatures are that their analysis of industrial structural adjustment was only confined to the provincial level. While under the background of political centralization and economic decentralization in China, governments in city level always grasp the economic power to manage the local state-owned enterprises, as well as rights of administrative examination and approval within region, land acquisition, loan guarantee and preferential policies, etc., thereby; those governments have even more “rights” to constitute industrial policies to conduct industrial structural adjustment. So it may reflect the real situation of Chinese industrial structural adjustment better if we use the city level data.
This paper fills the gaps in the literature. Firstly, it focuses on the city level data, hoping that the study can benefit Chinese industrial structural adjustment and provides a more comprehensive way to measure China’s industrial structural adjustment and providing policy makers a new perspective. Secondly, it focuses on not only the extent of industrial structural adjustment also the adjustments’ quality. Thirdly, it uses micro industrial data- China Industrial Enterprise Database1, the four digit industries in each region of China which can measure the extent and quality of industrial structural adjustment more exactly.
This paper uses China Industrial Enterprise Database, analyzing situation of the industrial structural adjustment of about 270 cities in China and try answer two questions: Firstly, How about the adjustment range? Which region gets the maximum adjustment range? Secondly, How about the quality of those adjustments? Has the adjustment led to higher technical lever or higher productivity? In our study, we will construct city’s industrial structure adjustment range index and its industrial structure quality index separately, and then try to evaluate the existing city’s industrial structural adjustment objectively. On this basis, this paper put forward corresponding policy recommendations.
2. Industrial Structure Adjustment Range Index
2.1. Construction Method
There are two limitations in the past literatures describing Chinese industrial structural adjustment: firstly, they focused more on the changes between three industries, by using the ratio of second industry to GDP, or using the ratio of manufacturing industry to GDP to show the structural changes in three industries, or just stay in the two digit industrial level analysis. Song et al. and Huang et al. think that it may reflect true situation of industrial structural adjustment more effectively via more micro data and more segmented industry. Secondly, analysis toward industrial structural adjustment is limited more to the provincial level, yet governments in city level always handle more power to draw up industrial policy in China, so this paper will pay attention to the industrial structural adjustment in the city level. China Industrial Enterprises Database, which focuses more on the situation of industrial internal segments, makes our study more conveniently.
Here, following practices of Song et al. and Huang et al. to construct our industrial structure adjustment range index, using China Industrial Enterprises Database, summing all the enterprises’ data within each four digit industry by prefecture-level city, we construct four digit industrial structure adjustment range index, reflecting China’s industrial structural adjustment more accurately.
This section, we process data from China Industrial Enterprises Database as follows: 1) adjust data’s industrial categories before 2003 in accordance with national industry code (GB/T 46754-4004); 2) we save only the complete data of four digit industry from 1998-2007. Song et al. and Huang et al. constructed their index referring to government’s expenditure structure changing index putting forward by Brender and Drazen [9] , so industrial structure adjustment index in this section is as follows:
 . (1)
. (1)
Here, i, t and j stand for the municipal area, time and the four digit industry respectively, J is the total amount of all the four digit industries, while n refers to the time span. Formula (1) measures the summation of variation of the industry in the year of t to the year of t − n. The reason why we choose four digit industries is that the total of two digit industries is too large, it may miss a great deal of information about the adjustment within a two digit industry, the industrial change in the internal sub sectors of the two digit industries is very important. Besides,  in the formula record four digit industry j to as a percentage of total number of national industry in the year of t. In order to evaluate the extent of structural changes within an industry from different dimension, we are going to use four aspects to construct four kinds of industrial structure adjustment index; the four aspects are as following: increase value, total output, sales volume and quantity of employment. This method is similar with Liu [10] , which index has been called the Michaeli coefficient.
The index mentioned above measures the cumulative change of every four digit industry at the end of each period relative to the amount of their shares at the beginning of each period, or the index measures the range of industrial structural adjustment at the very year to the base period, so the higher of the index, the larger of the adjustment range within a region’s manufactory. However, the index can only show the magnitude of industrial structural adjustment, but not the specific direction of adjustment of industrial structure, which means that the index can’t either reflect change direction of industry structure changes, or any quality problems of the industrial structure adjustment.
2.2. Index Analysis
In order to get a clear view of the situation of the industrial structural adjustment in Chinese cities, this section, we are going to use the industrial structure adjustment index referring to a city’s increasing value in a year to national share as an example, and analyze the time trend and regional distribution of the ranges of Chinese cities’ industrial structural adjustment.
Figure 1 depicts time trend of industrial structure adjustment range index of China and its cities in the eastern,

Figure 1. Time trend of the range of industrial industry adjustment.
middle and western areas. In terms of quantity, we can find that the adjustment ranges of eastern coastal provinces are larger than the middle, and the western are the smallest, and we get the same result when in view of the volatility, which is in accordance with the analysis conducted by Huang et al. in the province level. They mentioned in their essay that industrial structural adjustment always come from two aspects: market competition and government guidance. Compared to provinces in the middle and west, market competition in eastern provinces is usually stronger, and government’s efficiency gets higher, so the ranges of industrial structural adjustment are larger than the others. As for the change trend, in the period of 1999 to 2007, all the three areas present an inverted U type, and get the turning point in 2004. The eastern part for example, in 1999, the industrial structure adjustment index of the eastern part was 11.48, and it raised to 14.83 in 2004, after that, the speed of the industrial structural adjustment kept slowing down, and in 2007, the index dropped to 7.55. There are three causes that we think might possibly lead to the inverted U type: firstly, because of the reform of state owned enterprises since 1998, the industrial structure has focused on the restructuring of major enterprises and leave minor ones to fend for them, and this appears significantly in eastern area. Secondly, China’s industry has conducted a great new round of adjustment since 2001, right after China joined WTO, for the aims to adapt to the needs of international market. so the index change of the three areas all became larger in 2002-2004, and the increase is evident. Thirdly, till 2004, after several years of industrial structural adjustment, enterprises that couldn’t meet market’s need have been mostly out of the market. Meanwhile, as China haven’t put forward scientific outlook on development that emphasizes accord development and balanced development until 2003, this period, industrial structural adjustment focus more on eliminating high pollution industries, so the extent of adjustment is reducing and tending to be stable.
Figure 2 uses the coefficient of variation of industrial structural adjustment range index to reflect regional differences. From 1999 to 2002, the regional differences of industrial structure adjustment range in China continued to expand, the coefficient of variation raised from 2.16 in 1999 to 3.18 in 2002. After that, industrial structural adjustment has converged, regional differences narrowed. In 2007, the coefficient of variation has dropped to 1.69, which was 78.24% of that in 1999. It also represents an inverted U type; we can get the turning point in 2002.There are three reasons for the inverted U type: firstly, before China joining in WTO, governments attach great importance to the developing areas, especially in the eastern region, because of the reform policy of state owned enterprises emphasizes that the industrial structure has been adjusted under the guide line that “invigorate large enterprises while relaxing control over small ones” since 1998. Secondly, after joining in WTO in 2002, every region in China has great development, so there is a great decrease on the differences of the industry structure of regions. Thirdly, the differences of regional industry structure differences have kept stable decrease from 2004, it was closely related to China’s regional balanced development strategy.

Figure 2. Coefficient of variation industrial industry adjustment range index.
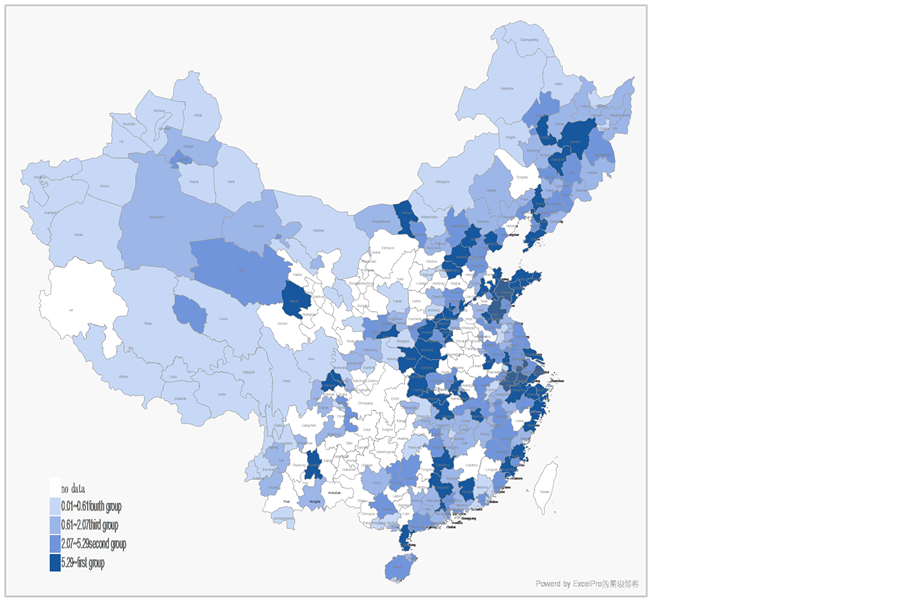
Figure 3 shows the city spatial distribution of China’s industrial structure adjustment extent index2. Whether it is 1999 or 2007, cities in the first group and the second group were concentrated in the Middle East(the deep blue areas), while the extent of adjustment of the western city was a little bit small, so there came into being the distribution pattern of “East High West Low”, which also proved findings in Figure 1. Then, compared to the evolution of urban transformation in 1999 and 2007, there is little transformation in cities in different groups, though indexes in Shanghai, Beijing and Guangzhou ranked highest. Thus, in 1999-2007, changes in the extent of Chinese industrial structural adjustment were mainly promoted by those developed regions in the east.
3. Industrial Structure Quality Index
3.1. Construction Method
Industrial structural adjustment as well as its transformation and upgrading are states in the process when industrial structure develops from lower to higher level; it reflects more about a region’s economy, industry, science and technology development and competitive power. In the process of development, industry converted from labor intensive, capital intensive to technology intensive industries in sequence; from being good at manufacturing primary products to be stronger in manufacturing intermediate or final products. The two processes are known as the industrial structure supererogation [11] . As far as the productivity is concerned, industrial structure supererogation can be expressed as follows: the original elements and resources has been transferred from low productivity sectors to high productivity sectors, and the new elements and resources has been allocated to sectors with new high productivity, then, it may lead to the increase of proportion of the high productivity industry departments, and improve the productivity of different kinds of industrial sectors jointly. Therefore, industrial structure supererogation has two connotations in nature: changes of the proportion relationship and increases of productivity.
We use industrial structure quality index to measure industrial structural adjustment of Chinese city, and test whether proportion of high productivity industry has become larger and larger. Our industrial structure supererogation index includes two parts: quantity (percentage) and quality (productivity), like the following formula:
 . (2)
. (2)
Here, i, t and J stand for area, time and industry respectively, J is the total amount of industries, Sijt accounts for the proportion of added value of industry J to that of the total of all countries in the year of t in the i area, while Fijt reflects the productivity of industry j in the year of t in i area. The industrial structure supererogation index gets higher if the proportion of high productivity industry gets larger in the economy.
Indeed, it can reflect the real situation of the industrial structural adjustment more effectively if the data is more micro. Like the industrial structure adjustment range index, we still use China Industrial enterprise database to construct the industrial structure supererogation index to throw light to the industrial structural adjustment
 (a) In 1999
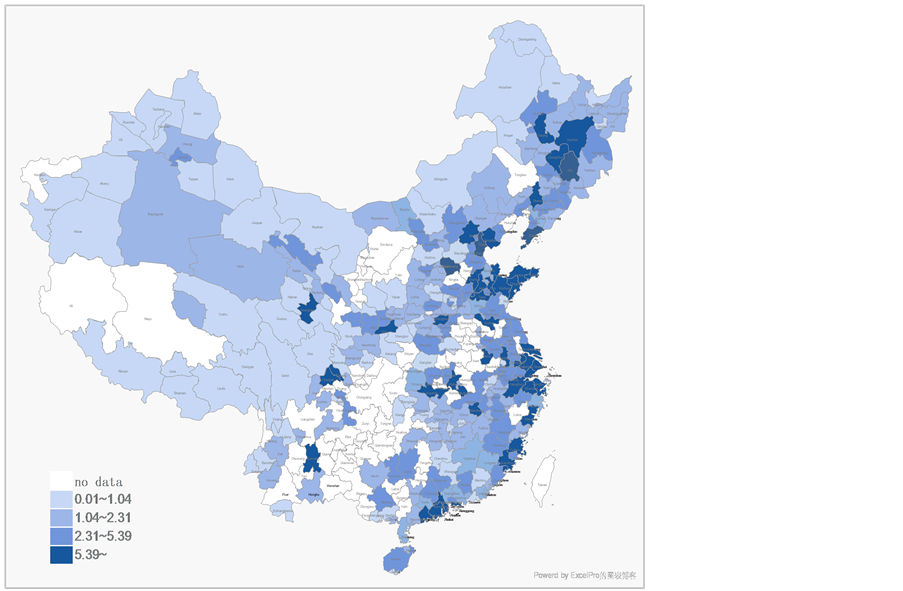 (a) In 2007
Figure 3. Industrial structure adjustment of China’s cities: regional distribution of industrial structure adjustment range index.
Note: The above figure is only for academic use, not reflecting the accurate Chinese map.
in Chinese industry, and here we still use the four digit industry. There are several indexes that can reflect industry’s productivity, for example, labor productivity (industrial added value/employment), capital productivity (industrial added value/capital stock), value added rate (industrial added value/total industrial output value), total factor productivity, etc.).
In this paper, we mainly use total factor productivity to measure industry’s productivity. Total factor productivity (TFP) is usually explained as “surplus” in the total output that can’t be interpreted by input. TFP reflects the average level of output of every input element in the production process, which is the overall efficiency of transition from input to the final output. We are going to measure and calculate TFP by the following steps: 1) calculate the total factor productivity using micro enterprises sample, in concrete, we are going to use Levi Vincent (Levinsohn) and LP which is proposed by Petrin [12] , as well as OP proposed by Austria (Olley) and Perks (Pakes) [13] ; 2) According to the sum of all enterprises’ TFP weighted by the proportion of added value, we can get the TFP of four digit industry in the prefecture level.
3.2. Index Analysis
For example, by means of LP method, we calculate the industrial structure supererogation index by summing all TFP, and then analyze the time trend and regional distribution of Chinese industrial structure quality.
Figure 4 depicts time trend of the industrial structure quality index in China and its cities in the eastern, middle and western areas. In terms of the trend, we can find that China’s industrial structure was upgraded higher and higher in the period of 1999 to 2007, the industrial structure quality index raised from 2.86 in 1999 to 3.49 in 2007, with an average annual growth rate of 2.52%. With Chinese industrial structure upgrading, it may more likely to tend into industries with higher productivity level. In view of region, index in eastern part raised from 3.13 in 1999 to 3.66 in 2007, with an average annual increase of 1.97%; index in the middle raised from 2.91 in 1999 to 3.58 in 2007; index in western part raised from 2.58 in 1999 to 3.24 in 2007, with an average annual growth rate of 2.89%. Industrial Structure of all cities in the three areas keep upgrading, the index of eastern area ranks highest while the western part is the lowest. Finally, in the aspect of the average annual growth rate, index of the eastern part is the lowest here, while that of the western part is the highest. On the one hand, the eastern part has already had a high industrial structure supererogation index, if keep upgrading, the speed may slow down. On the other hand, since 1997, Chinese government has put forward the balanced development strategy “west development”, the revitalization of the northeast and the rise of the central, etc. to stimulate investment and industrial structural adjustment in central and western regions, so the upgrading of cities’ industrial structure in the Midwest may become faster.
We use the coefficient of variation of industrial structural quality index to reflect regional differences (see Figure 5); we can find that the overall coefficient of variation shows a downward trend except the year of 1999. The coefficient of variation rose from 0.24 in 1999 to 0.19 in 2007, regional differences is narrowing and converging. Decreasing of regional differences may come from two aspects: first, the impact of joining WTO. Since China joined WTO in 2001, China’s enterprises faced stronger competition. So only enterprises with high productivity and good profit can stay; second, China put forward the balanced development strategy, especially

Figure 4. Time trend of industrial structure quality.

Figure 5. Coefficient of variation industrial structure quality.
scientific development policy put forward in the end of 2003 which focused on accordance development and balanced development. The two reasons interacted together and led to the decrease of regional differences, which on the other hand proved the results we’ve got by analyzing the average annual growth rate of the industrial structural quality index.
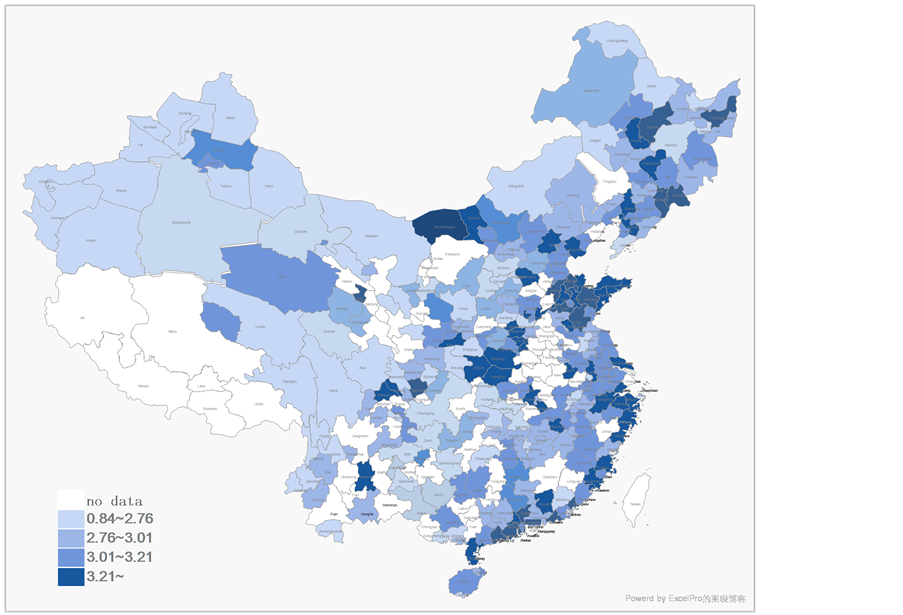
Figure 6 shows the spatial distribution of Chinese cities’ industrial structure quality index. In the year of 1999, cities in the first group and the second group were concentrated in the eastern coastal areas, which formed three major central zones: the Pearl River delta group centered on Guangdong; the Delta group centered on Shanghai, Zhejiang and Jiangsu and the Bohai group centered on Beijing, Tianjin and Shandong. Meanwhile, there came into being the “East High, West Low” distribution pattern. Here, the improvement of industrial structural adjustment consists with regions’ development status. Till 2007, cities in the central and western regions like Tibet as the most typical example has entered the first group, while most cities’ ranks about industrial structural improvement in the coastal area have dropped gradually; the pattern of “East High West Low” has been broken little by little. The situation may mainly be caused by the following two reasons: firstly, the industrial structure quality index constructed by four digit industry refers to only industry, however, in eastern cities, increasing amplitude of the third industry’s proportion gets larger, so we missed the condition that industrial structural adjustment in eastern cities may move in the direction to the third industry, Secondly, there is industry transfer. Developed area may remove some enterprises that have some degree of productivity in order to develop the service industry. For example, Beijing removed factories of Shougang in Beijing to Tangshan, Hebei to protect the environment, whose productivity isn’t low.
4. Conclusions, Limitation and Policy Suggestions
Promoting and optimizing industrial structure is a main route to improve ecological environment and upgrade product position in global value chain. The existing literature does not have systematic analysis about the industry structure adjustment of Chinese cities. In terms of extent and quality of industrial structure change, this paper examines and evaluates the industrial structure change among more than 270 cities in China since 1999 by constructing extent index of industrial change and index of industrial upgrading. We find that:
In terms of extent of industrial structure change, the extent of industrial structural adjustment and regional differences represents an inverted U trend. In terms of quantity however, amplitude of industrial structural adjustment gets highest in the eastern provinces, then the central is the middle and the western provinces is the smallest. In terms of adjustment quality, from 1999-2007, all the industrial structural quality kept increasing in China and all of the three areas, the industrial structure in our country focused more and more on the industries with high productivity. As for the quantity, it shows that the eastern part ranks highest while the western part is the lowest. So far, the highest values of the industrial structural quality index are concentrated in the Pearl River delta group, Delta group and Bohai group with a pattern of “East High West Low”, but the pattern has been broken gradually and the quality of our nation’s industrial structure tends to converge.
The paper has some limitations which can provide areas for future research: firstly, as for the lack of accuracy of the industry enterprises micro data from 2007 to 2011 in the database, the data from 1999 to 2007 are used, although it is a little old, it provides a way to measure the industrial structure more macrocosmically and exactly.
 (a) In 1999
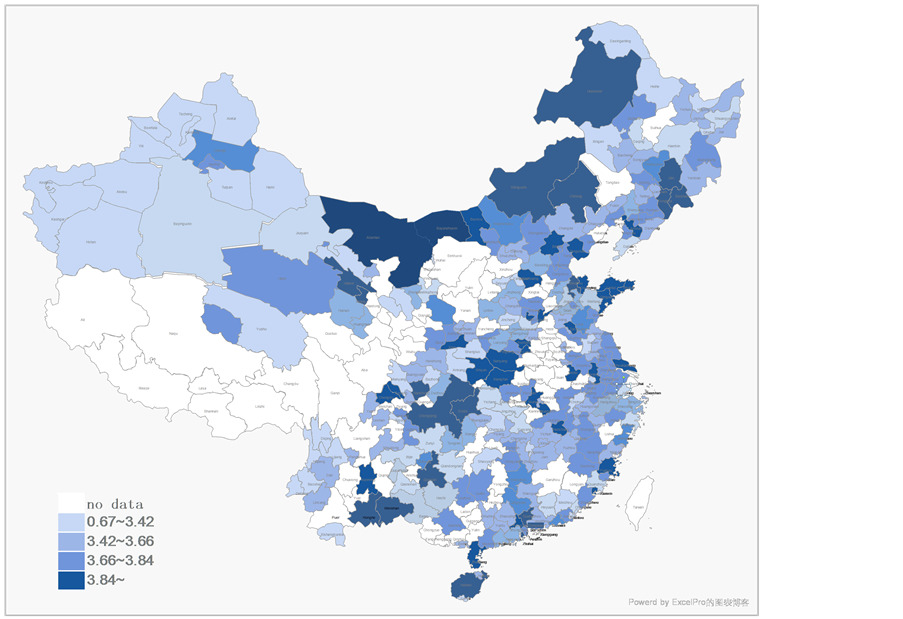 (b) In 2007
Figure 6. Regional distribution of Chinese industrial structure adjustment quality index.
Secondly, there is a lack of comprehensive analysis on the comparison of China’s industrial structure adjustment and the world’s, which cannot judge whether China’s industrial structure adjustment is going to the standard of the world’s. A comparison between China and the world can give a deep illustration on China’s industrial structure adjustment.
According to the situation of industrial structural adjustment in China, we are going to put forward two policy suggestions:
First, government needs to do the guiding role well. The Chinese government plays an important role in the adjustment of industrial structure. The government should fully respect the role of market mechanism in the realization of the allocation of resources; it needs to intervene in the economy on the premise that the market readjustment will not be disturbed, which means that government can only make the necessary decisions to make up for market failure. The government should pay more attention to the investment and construction of education and scientific research and development, and promote the industrial structure to a higher quality by using progressed science and technology. In practice, government can constitute corresponding policies, improve the core-competitiveness of large and medium-sized enterprises, and support small and micro enterprises.
Second, great importance should be attached to the leading role effect of developed areas, especially eastern developed areas. The eastern region can lead and push the adjustment of the central and western regions by sharing experiences; the central and western regions should also take the initiative to imitate and learn from the advanced experience. However, fierce regional competition often leads to the phenomenon of “benefit oneself at the expense of others”. So, it is necessary to develop effective regional cooperation mechanism. First, it will create a better platform for the communication and learning among different regions in China and finally it is good for the leading role of eastern areas. Second, it is conducive to the sharing of resources and complementary advantages. If lacking in the cooperation mechanism, regional distribution of industry structure is not reasonable. It often appears when some projects with low productivities are removed from the developed areas. They may be conducted immediately by the developing areas, and it is obvious that this situation can’t help to realize the comprehensive optimization of industrial structure in China. So, how to guide local government moving from competition to cooperation has become a very important issue to be solved.
Cite this paper
Min Liu,Liangxiong Huang,Jinshan Liu, (2016) Industrial Structure Change in Chinese Cities: Measurement Based on the Extent and Quality. Modern Economy,07,894-903. doi: 10.4236/me.2016.78093
References
- 1. Jin, B. (2003) The Position and Role of High-Tech in China’s Industrial Development. China Industrial Economy, 12, 5-10.
- 2. Huang, L.X., Wang, H. and Song, L.Y. (2012) Is China’s Industrial Change Green? Nankai Economic Studies, 3, 110-127.
- 3. Song, L.Y., Wang, X.B. and Xu, X.X. (2013) Local Officials Induce Structural Change. China Economic Quarterly, 1, 75-94.
- 4. Zhang, T.B. and Gao, T.M. (2012) Finance and Taxation Policy Motivation, High-Tech Industry Development and Industrial Structure Adjustment. Economic Research Journal, 5, 58-70.
- 5. Pang, R.Z. and Li, P. (2011) Product’s Homogeneity, Local Protection of Investment and Measure of the Integration of Domestic Market. Economic Research Journal, 11, 36-47.
- 6. Zhou, T.Y. and Zhang, M. (2012) New Change of the Global Industrial Structure Adjustment and Chinese Industrial Development Strategy. Financial Issues Research, 2, 21-25.
- 7. Li, G., Liao, J.H. and Xiang, Y.M. (2011) Direction and Route of China’s Industrial Upgrading? China Industrial Economy, 10, 16-26.
- 8. Huang, L.X., An, Y. and Liu, S.L. (2013) Industrial Structure Change in China: Measures Based on Three Different Dimensions. China Industrial Economy, 10, 70-82.
- 9. Brender, A. andA. Drazen, A. (2009) Do Leaders Affect Government Spending Priorities? NBER Working Paper 15368.
- 10. Liu, K. (2007) Analysis of Industrial Structural Change and Growth Vitality in China during the Year 1999-2005. China Industrial Economy, 9, 40-47.
- 11. Liu, W., Zhang, H. and Huang, Z.H. (2008) The Study on the Industrial Structure Height and the Industrial Process and the Region Difference in China. China Economic Dynamics, 11, 4-8.
- 12. Levinsohn, J. and Petrin, A. (2003) Estimating Production Functions Using Inputs to Control for Unobservables. Review of Economic Studies, 2, 317-341.
http://dx.doi.org/10.1111/1467-937X.00246 - 13. Olley, S. and Pakes, A. (1996) The Dynamics of Productivity in the Telecommunications Equipment Industry. Econometrica, 64, 1263-1298.
http://dx.doi.org/10.2307/2171831
NOTES

*Corresponding author.

1The data in China Industrial Enterprise Database from 2007 to 2011 is not so accurate, so it is seldom used.

2In the analysis of the sample in the paper, there are about 270 prefecture level cities, descending rank is carried on according to the size of the index, the areas are divided into 4 groups, corresponding to the first, second, third and fourth group, the same as below.